


Total staff
261
Employees
138
Contractors
123
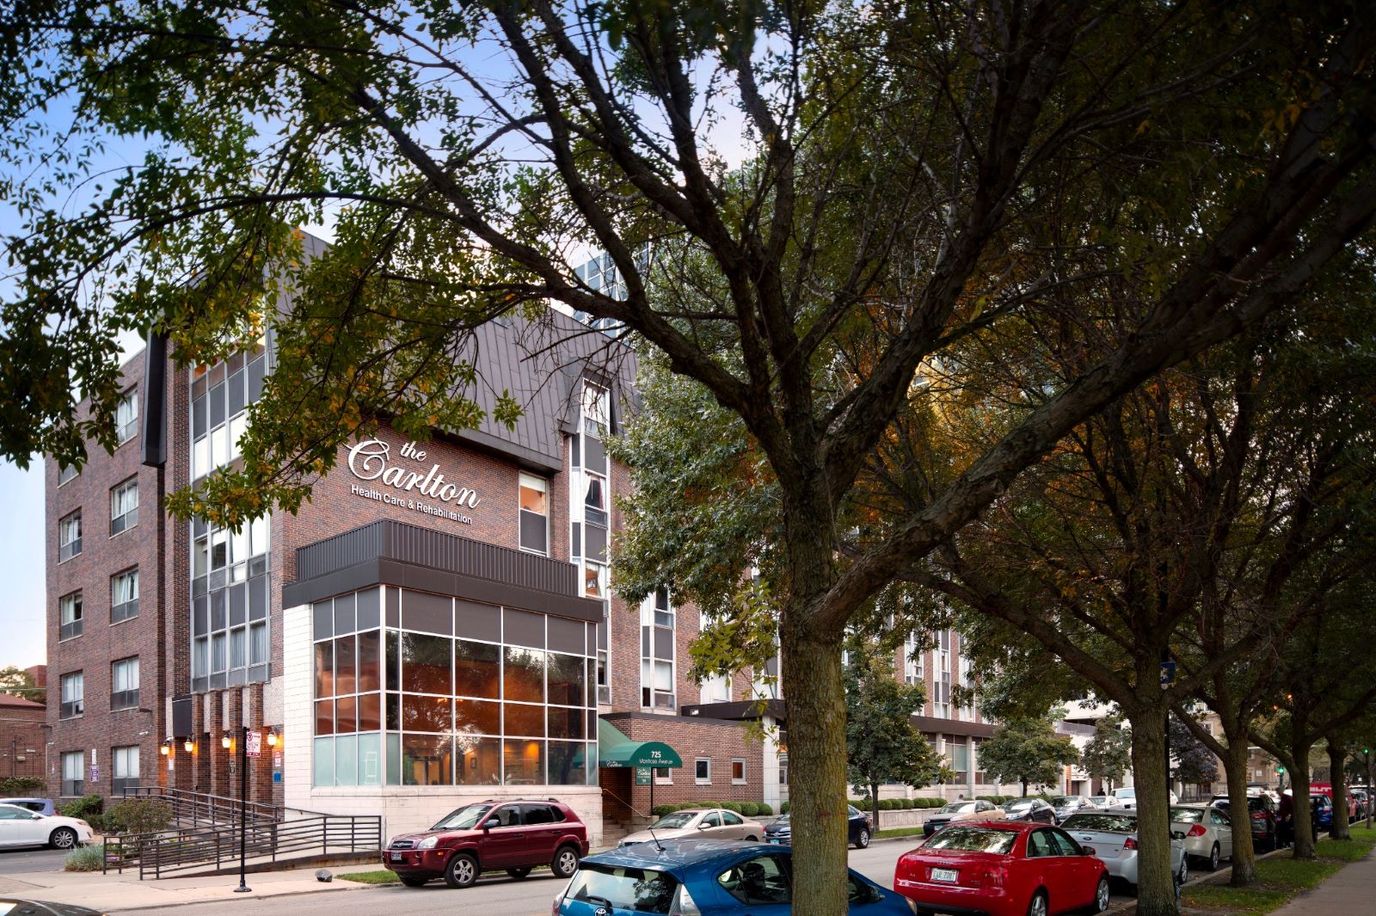
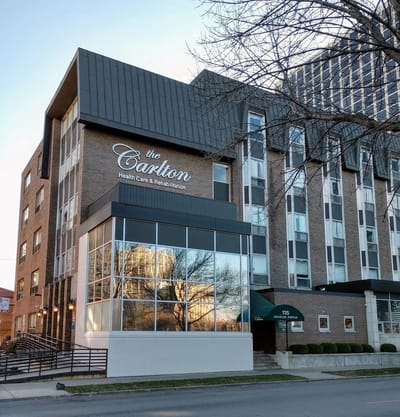

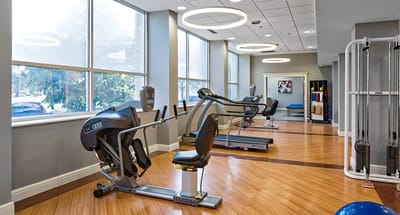


The Carlton is an oasis of premier healthcare nestled in the heart of Chicago. This extraordinary residence on the far north side offers an experience that surpasses expectations, combining outstanding services with a serene and soothing atmosphere. Whether you seek short-term rehabilitation or long-term skilled nursing care, The Carlton’s commitment to clinical excellence is simply unmatched. The safety and well-being of residents are paramount. With 24-hour security and skilled nursing care, along with regular visits from trusted professionals such as dentists, podiatrists, psychologists, and psychiatrists, every aspect of their health is attentively tended to. Pharmacy services are also seamlessly integrated, ensuring convenience and peace of mind.
The Carlton thrives on a daily tapestry of social and leisure activities, carefully curated to cater to diverse interests and passions. Engage in lively rounds of bingo, savor the aroma of freshly brewed coffee during cozy gatherings, or feel the rhythm of life pulsate through invigorating exercise sessions. Lose yourself in the melodies of soul-stirring music concerts, relish in delightful tea parties, or immerse yourself in the warmth of Sunday socials. Here, each resident is valued as an individual, and the team at The Carlton works tirelessly to provide personalized care that embraces their unique stories.
Staffing hours
![]() Daily nursing hours per resident by staff type, reported to CMS. Higher is generally better — compare this facility to state and national averages to see where staffing stands.
Daily nursing hours per resident by staff type, reported to CMS. Higher is generally better — compare this facility to state and national averages to see where staffing stands.
Hours per resident per day vs Illinois averages
Total nursing care
![]() This home is ranked 127th out of 154 homes in Illinois for nurse hours. Total adjusted nursing hours per resident per day, combining RN, LPN, and aide time. CMS adjusts this for case-mix so facilities can be fairly compared.
This home is ranked 127th out of 154 homes in Illinois for nurse hours. Total adjusted nursing hours per resident per day, combining RN, LPN, and aide time. CMS adjusts this for case-mix so facilities can be fairly compared.
2h 26m
22% below state avg2 of 6 metrics below state avg
Reporting period: October 1 – December 31, 2025 (Q4 2025). Source: CMS Payroll-Based Journal report.
Manages medical care and health needs.
Assists with medical care and medications.
Helps with daily care and mobility.
Total hours from contractors
6,742 contractor hours this quarter
| Certified Nursing Assistant | 72 | 32 | 104 | 27,715 | 92 | 100% | 7.4 |
| Registered Nurse | 23 | 51 | 74 | 9,756 | 92 | 100% | 8.7 |
| Licensed Practical Nurse | 18 | 19 | 37 | 9,027 | 92 | 100% | 8.4 |
| Qualified Activities Professional | 7 | 9 | 16 | 2,417 | 92 | 100% | 9.6 |
| RN Director of Nursing | 4 | 0 | 4 | 1,780 | 91 | 99% | 6.1 |
| Clinical Nurse Specialist | 4 | 0 | 4 | 1,500 | 92 | 100% | 6.4 |
| Dental Services Staff | 3 | 0 | 3 | 1,195 | 90 | 98% | 5.6 |
| Other Dietary Services Staff | 3 | 0 | 3 | 1,054 | 86 | 93% | 7.8 |
| Qualified Social Worker | 0 | 1 | 1 | 509 | 64 | 70% | 8 |
| Nurse Practitioner | 1 | 0 | 1 | 500 | 89 | 97% | 5.6 |
| Speech Language Pathologist | 0 | 1 | 1 | 499 | 63 | 68% | 7.9 |
| Dietitian | 1 | 0 | 1 | 492 | 85 | 92% | 5.8 |
| Mental Health Service Worker | 1 | 0 | 1 | 468 | 84 | 91% | 5.6 |
| Administrator | 1 | 0 | 1 | 364 | 64 | 70% | 5.7 |
| Physical Therapy Assistant | 0 | 4 | 4 | 329 | 52 | 57% | 5.6 |
| Respiratory Therapy Technician | 0 | 3 | 3 | 250 | 34 | 37% | 7.3 |
| Physical Therapy Aide | 0 | 3 | 3 | 181 | 23 | 25% | 7.6 |
Includes penalties issued in 2023-2024
Federal penalties imposed by CMS for regulatory violations, including civil money penalties (fines) and denials of payment for new Medicare/Medicaid admissions.
Source: CMS Penalties Database (Data as of Jan 2026)
Illinois average: $143K
Illinois average: 3.0
Illinois average: 1.1
Penalties are imposed by CMS for violations of federal nursing home regulations.
5 penalties in the past 3 years
Multiple penalties were reported in the last 3 years.
Last updated: Jan 2026
These measures show how residents usually do over time at this home, based on health outcomes and preventive care.
Illinois average: 9.7
Illinois average: 18.6
Illinois average: 15.5%
Illinois average: 18.4%
Illinois average: 21.6%
Illinois average: 3.4%
Illinois average: 5.3%
Illinois average: 1.8%
Illinois average: 6.5%
Illinois average: 48.1%
Illinois average: 20.2%
Illinois average: 89.2%
Illinois average: 91.6%
Illinois average: 2.05
Illinois average: 2.25
Illinois average: 68.3%
Illinois average: 2.3%
Illinois average: 63.0%
Illinois average: 26.2%
Illinois average: 14.0%
Illinois average: 0.8%
Illinois average: 53.7%
Illinois average: 50.6%
Quality measures are calculated from Minimum Data Set (MDS) assessments. For most measures, lower percentages indicate better care quality.
23% of new residents, usually for short-term rehab.
59% of new residents, often for short stays.
18% of new residents, often for long-term daily care.
Source: CMS Long-Term Care Facility Characteristics (Data as of Jan 2026)
Residents meet regularly to discuss policies, care quality, and activities
Organized group of residents that meets regularly to discuss facility policies, quality of life, and activities.
Data sourced from CMS Long-Term Care Facility Characteristics quarterly report. Payer mix reflects the current resident census by primary payment source.
Historical financial and operational data for The Carlton from 2011–2023, based on CMS SNF Cost Reports.
Key figures below are for fiscal year ending in 12/2023.
Based on CMS SNF Cost Report for fiscal year ending in 12/2023.
This home supports both short-term rehab and long-term care, with residents staying for a wide range of durations.
Most new residents arrive under private pay (59% of admissions), and a typical private pay stay runs around 4 - 5 months.
Coverage residents most often arrive under.
Coverage residents most often leave under.
![]() 5.5 miles from city center
5.5 miles from city center
![]() Estimated distance in miles from Chicago's city center to The Carlton's address, calculated via Google Maps.
— 2 miles to nearest hospital (Ascension Saint Joseph - Chicago)
Estimated distance in miles from Chicago's city center to The Carlton's address, calculated via Google Maps.
— 2 miles to nearest hospital (Ascension Saint Joseph - Chicago)
Add your location
Info below is compiled from CMS reports & the IL Dept. of Public Health (IDPH), senior community websites & trusted data sources such as Walk Score & BBB.
Communities are listed from highest to lowest based on our ranking methodology.
| Mercy Circle Senior Living | NH AL IL MC SNF | Chicago (Mount Greenwood) | 43
Facility
43
IL AVG
85
Rank
#329 / 418 | - | - | 4.57
Facility
4.57
IL AVG
3.10
Rank
#24 / 154 | -8% | +47% | $0
Facility
$0
IL AVG
$151.3k
Rank
#1 / 154 | 16
Facility
16
IL AVG
36.8
Rank
#23 / 154 | 4.0
Facility
4.0
IL AVG
3.7
Rank
#104 / 154 | - | 22 | - |
44
Facility
44
IL AVG
52
Rank
#392 / 634 | Sisters Of Mercy Of The Americas West Midwest Community Inc | $10.3MFiscal year ending 06/2024
Facility
$10.3MFiscal year ending 06/2024
IL AVG
$13.2M
Rank
#84 / 135 | $5.1MFiscal year ending 06/2024
Facility
$5.1MFiscal year ending 06/2024
IL AVG
$7.4M
Rank
#99 / 135 | 49.8%Fiscal year ending 06/2024
Facility
49.8%Fiscal year ending 06/2024
IL AVG
60.5%
Rank
#76 / 135 | 146174 | ||||
| The Selfhelp Home Senior Living Community | NH AL IL RC SNF | Chicago (Uptown) | 72
Facility
72
IL AVG
85
Rank
#204 / 418 |
81.9%
Facility
81.9%
IL AVG
73
Rank
#63 / 156 | +12% | 5.56
Facility
5.56
IL AVG
3.10
Rank
#8 / 154 | +44% | +79% | $0
Facility
$0
IL AVG
$151.3k
Rank
#1 / 154 | 21
Facility
21
IL AVG
36.8
Rank
#40 / 154 | 5.3
Facility
5.3
IL AVG
3.7
Rank
#137 / 154 | 1 | 59 | A+ |
92
Facility
92
IL AVG
52
Rank
#28 / 634 | Marvin Rubin | $9.3MFiscal year ending 09/2023
Facility
$9.3MFiscal year ending 09/2023
IL AVG
$13.2M
Rank
#96 / 135 | $7.0MFiscal year ending 09/2023
Facility
$7.0MFiscal year ending 09/2023
IL AVG
$7.4M
Rank
#64 / 135 | 75.3%Fiscal year ending 09/2023
Facility
75.3%Fiscal year ending 09/2023
IL AVG
60.5%
Rank
#16 / 135 | 146009 | ||||
| The Clare | NH AL IL MC SNF | Chicago (Rush & Division) | 49
Facility
49
IL AVG
85
Rank
#293 / 418 |
92.2%
Facility
92.2%
IL AVG
73
Rank
#23 / 156 | +26% | 3.69
Facility
3.69
IL AVG
3.10
Rank
#48 / 154 | +61% | +19% | $0
Facility
$0
IL AVG
$151.3k
Rank
#1 / 154 | 13
Facility
13
IL AVG
36.8
Rank
#18 / 154 | 2.6
Facility
2.6
IL AVG
3.7
Rank
#24 / 154 | 1 | 45 | A+ |
100
Facility
100
IL AVG
52
Rank
#1 / 634 | County Of Fulton | $4.4MFiscal year ending 11/2023
Facility
$4.4MFiscal year ending 11/2023
IL AVG
$13.2M
Rank
#131 / 135 | $3.6MFiscal year ending 11/2023
Facility
$3.6MFiscal year ending 11/2023
IL AVG
$7.4M
Rank
#124 / 135 | 81.8%Fiscal year ending 11/2023
Facility
81.8%Fiscal year ending 11/2023
IL AVG
60.5%
Rank
#13 / 135 | 146151 | ||||
| Asbury Gardens | NH HOS MC PC SNF | North Aurora (Airport Road) | 75
Facility
75
IL AVG
85
Rank
#193 / 418 |
76.5%
Facility
76.5%
IL AVG
73
Rank
#77 / 156 | +5% | 4.00
Facility
4.00
IL AVG
3.10
Rank
#41 / 154 | +6% | +29% | $6.4k
Facility
$6.4k
IL AVG
$151.3k
Rank
#65 / 154 | 21
Facility
21
IL AVG
36.8
Rank
#40 / 154 | 3.5
Facility
3.5
IL AVG
3.7
Rank
#71 / 154 | - | 57 | A+ |
38
Facility
38
IL AVG
52
Rank
#434 / 634 | Abraham Diamond | $6.7MFiscal year ending 12/2023
Facility
$6.7MFiscal year ending 12/2023
IL AVG
$13.2M
Rank
#120 / 135 | $3.8MFiscal year ending 12/2023
Facility
$3.8MFiscal year ending 12/2023
IL AVG
$7.4M
Rank
#121 / 135 | 56.5%Fiscal year ending 12/2023
Facility
56.5%Fiscal year ending 12/2023
IL AVG
60.5%
Rank
#51 / 135 | 146170 | ||||
| The Carlton | NH HOS PC RC SNF | Chicago (Uptown) | 244
Facility
244
IL AVG
85
Rank
#11 / 418 |
71.0%
Facility
71.0%
IL AVG
73
Rank
#98 / 156 | -3% | 2.43
Facility
2.43
IL AVG
3.10
Rank
#127 / 154 | +100% | -22% | $241.1k
Facility
$241.1k
IL AVG
$151.3k
Rank
#143 / 154 | 60
Facility
60
IL AVG
36.8
Rank
#129 / 154 | 3.5
Facility
3.5
IL AVG
3.7
Rank
#71 / 154 | 9 | 173 | - |
84
Facility
84
IL AVG
52
Rank
#80 / 634 | Joanne Ventrella | $20.5MFiscal year ending 12/2023
Facility
$20.5MFiscal year ending 12/2023
IL AVG
$13.2M
Rank
#15 / 135 | $9.1MFiscal year ending 12/2023
Facility
$9.1MFiscal year ending 12/2023
IL AVG
$7.4M
Rank
#29 / 135 | 44.3%Fiscal year ending 12/2023
Facility
44.3%Fiscal year ending 12/2023
IL AVG
60.5%
Rank
#115 / 135 | 145679 |
The Carlton is located in Chicago, Illinois.
Here are the financial assistance programs available to residents in Illinois.
The Carlton is in the Uptown neighborhood.
The Carlton has a walk score of 84. Very walkable. Most errands can be accomplished on foot, and many essentials are within a short walk.
The Carlton's occupancy is 75.3%.
No, The Carlton has a no-pet policy.
The Carlton is registered as a for-profit.
Yes — there are 7 photos of The Carlton in the photo gallery on this page.
The Carlton is located at 725 W Montrose Ave, Chicago, IL 60613.
Care Cost Calculator: See Prices in Your Area
Nursing Home Data Explorer
Don’t Wait Too Long: 7 Red Flag Signs Your Parent Needs Assisted Living Now
The True Cost of Assisted Living in 2025 – And How Families Are Paying For It
Understanding Senior Living Costs: Pricing Models, Discounts & Financial Assistance


