Explore Open Rooms

1 Contact details
2 What type of senior care service are you looking for?
3 What budget do you have in mind for senior care?
4 How soon do you need to find care?
5 Additional details

Thank you for your interest!

Our team will be in touch shortly to help with next steps.

Nursing Home

The Gardens Skilled Nursing and Rehabilitation

Nursing Home

The Gardens Skilled Nursing and Rehabilitation

104 Lois Ln, Colorado Springs, CO 80904 View map
Overview of The Gardens Skilled Nursing and Rehabilitation

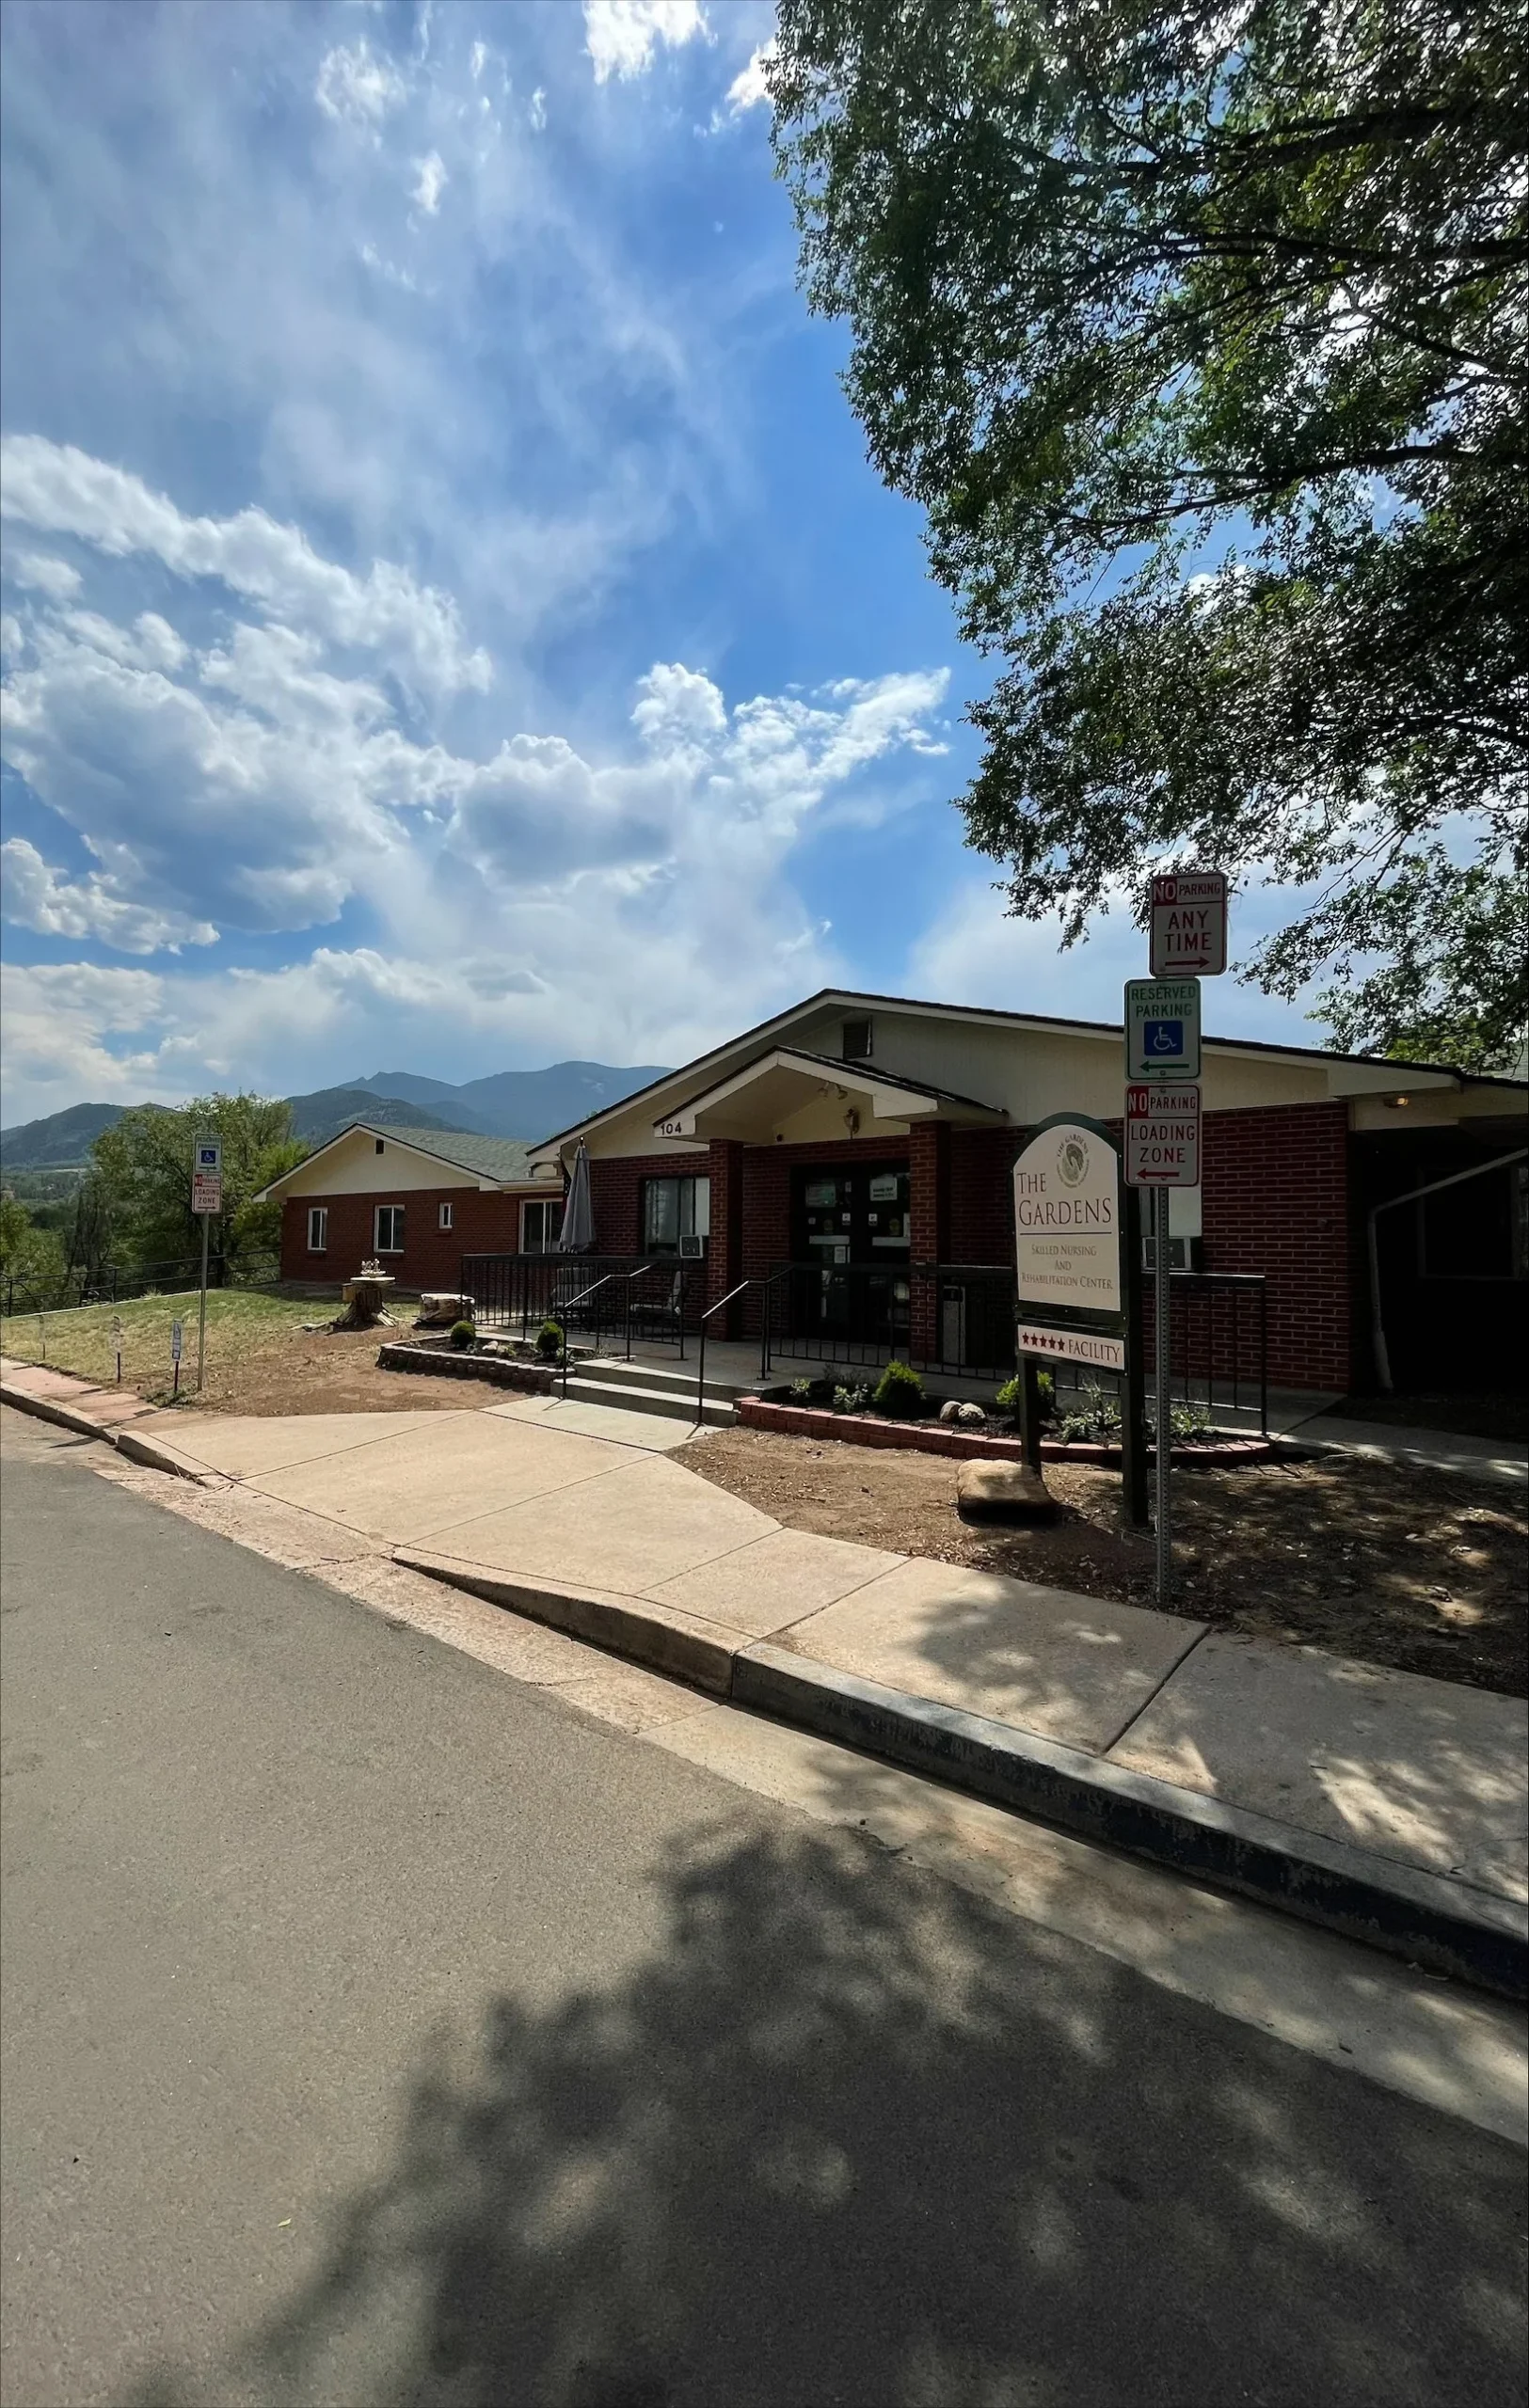
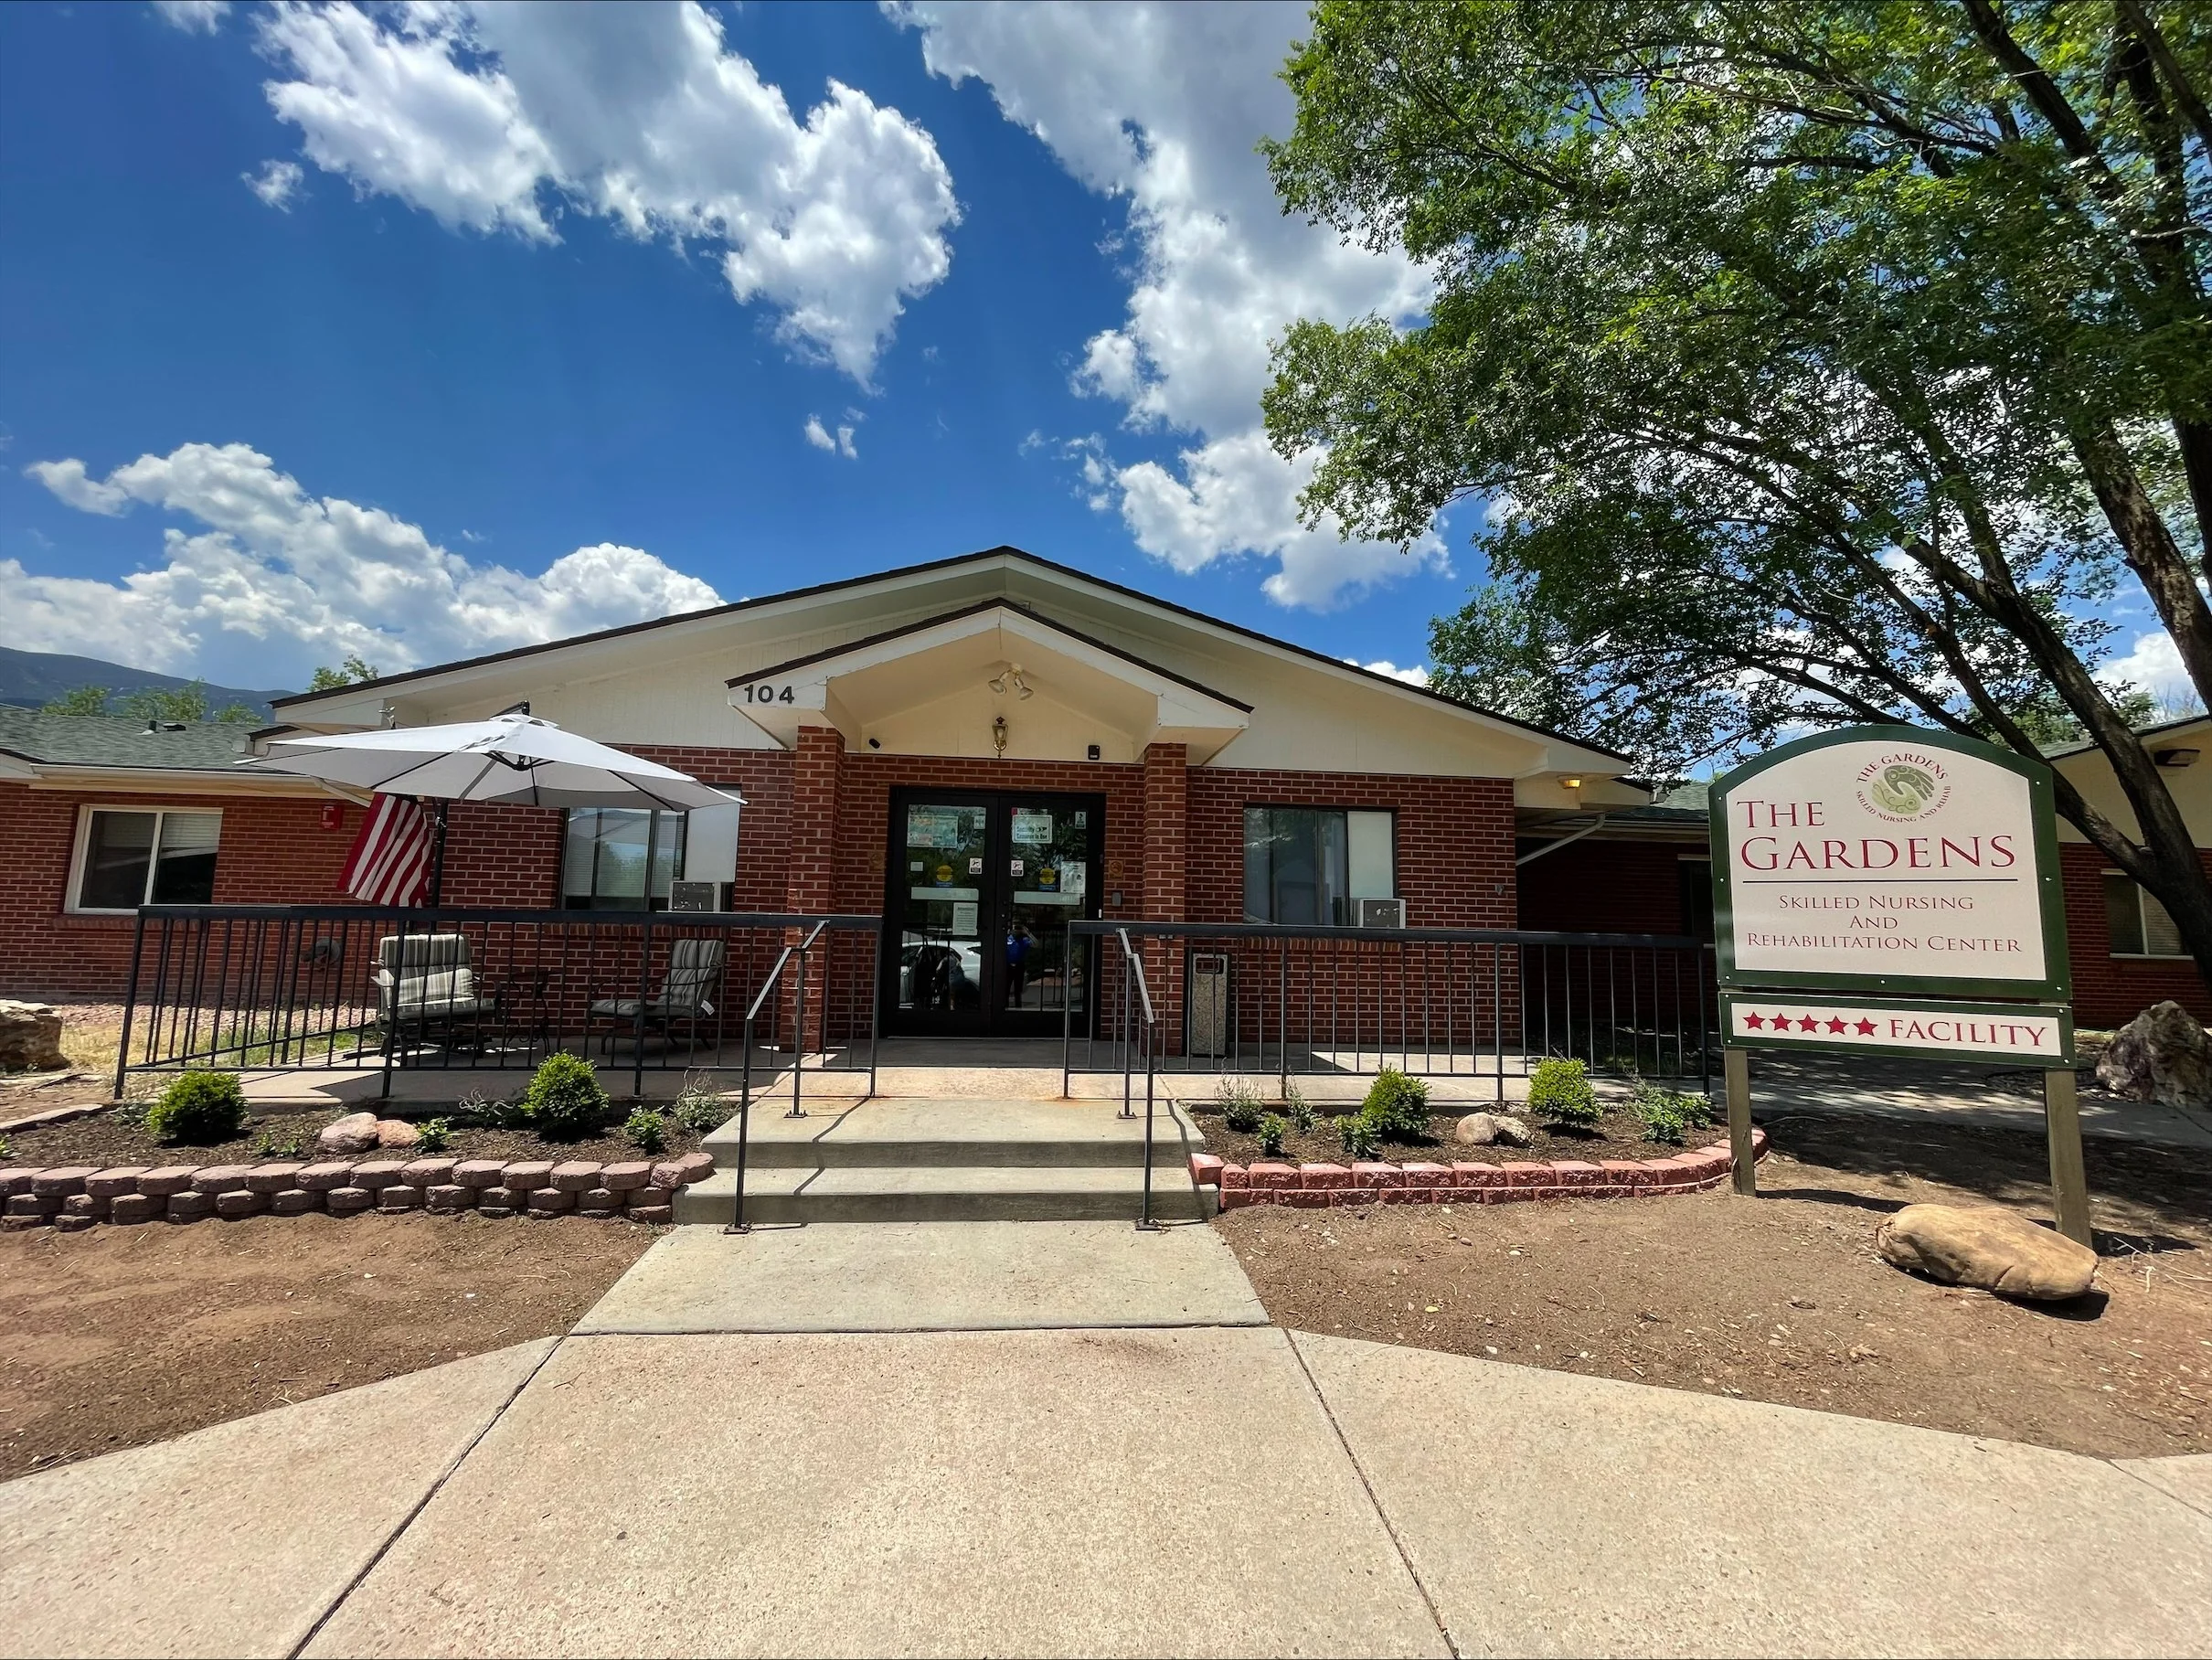
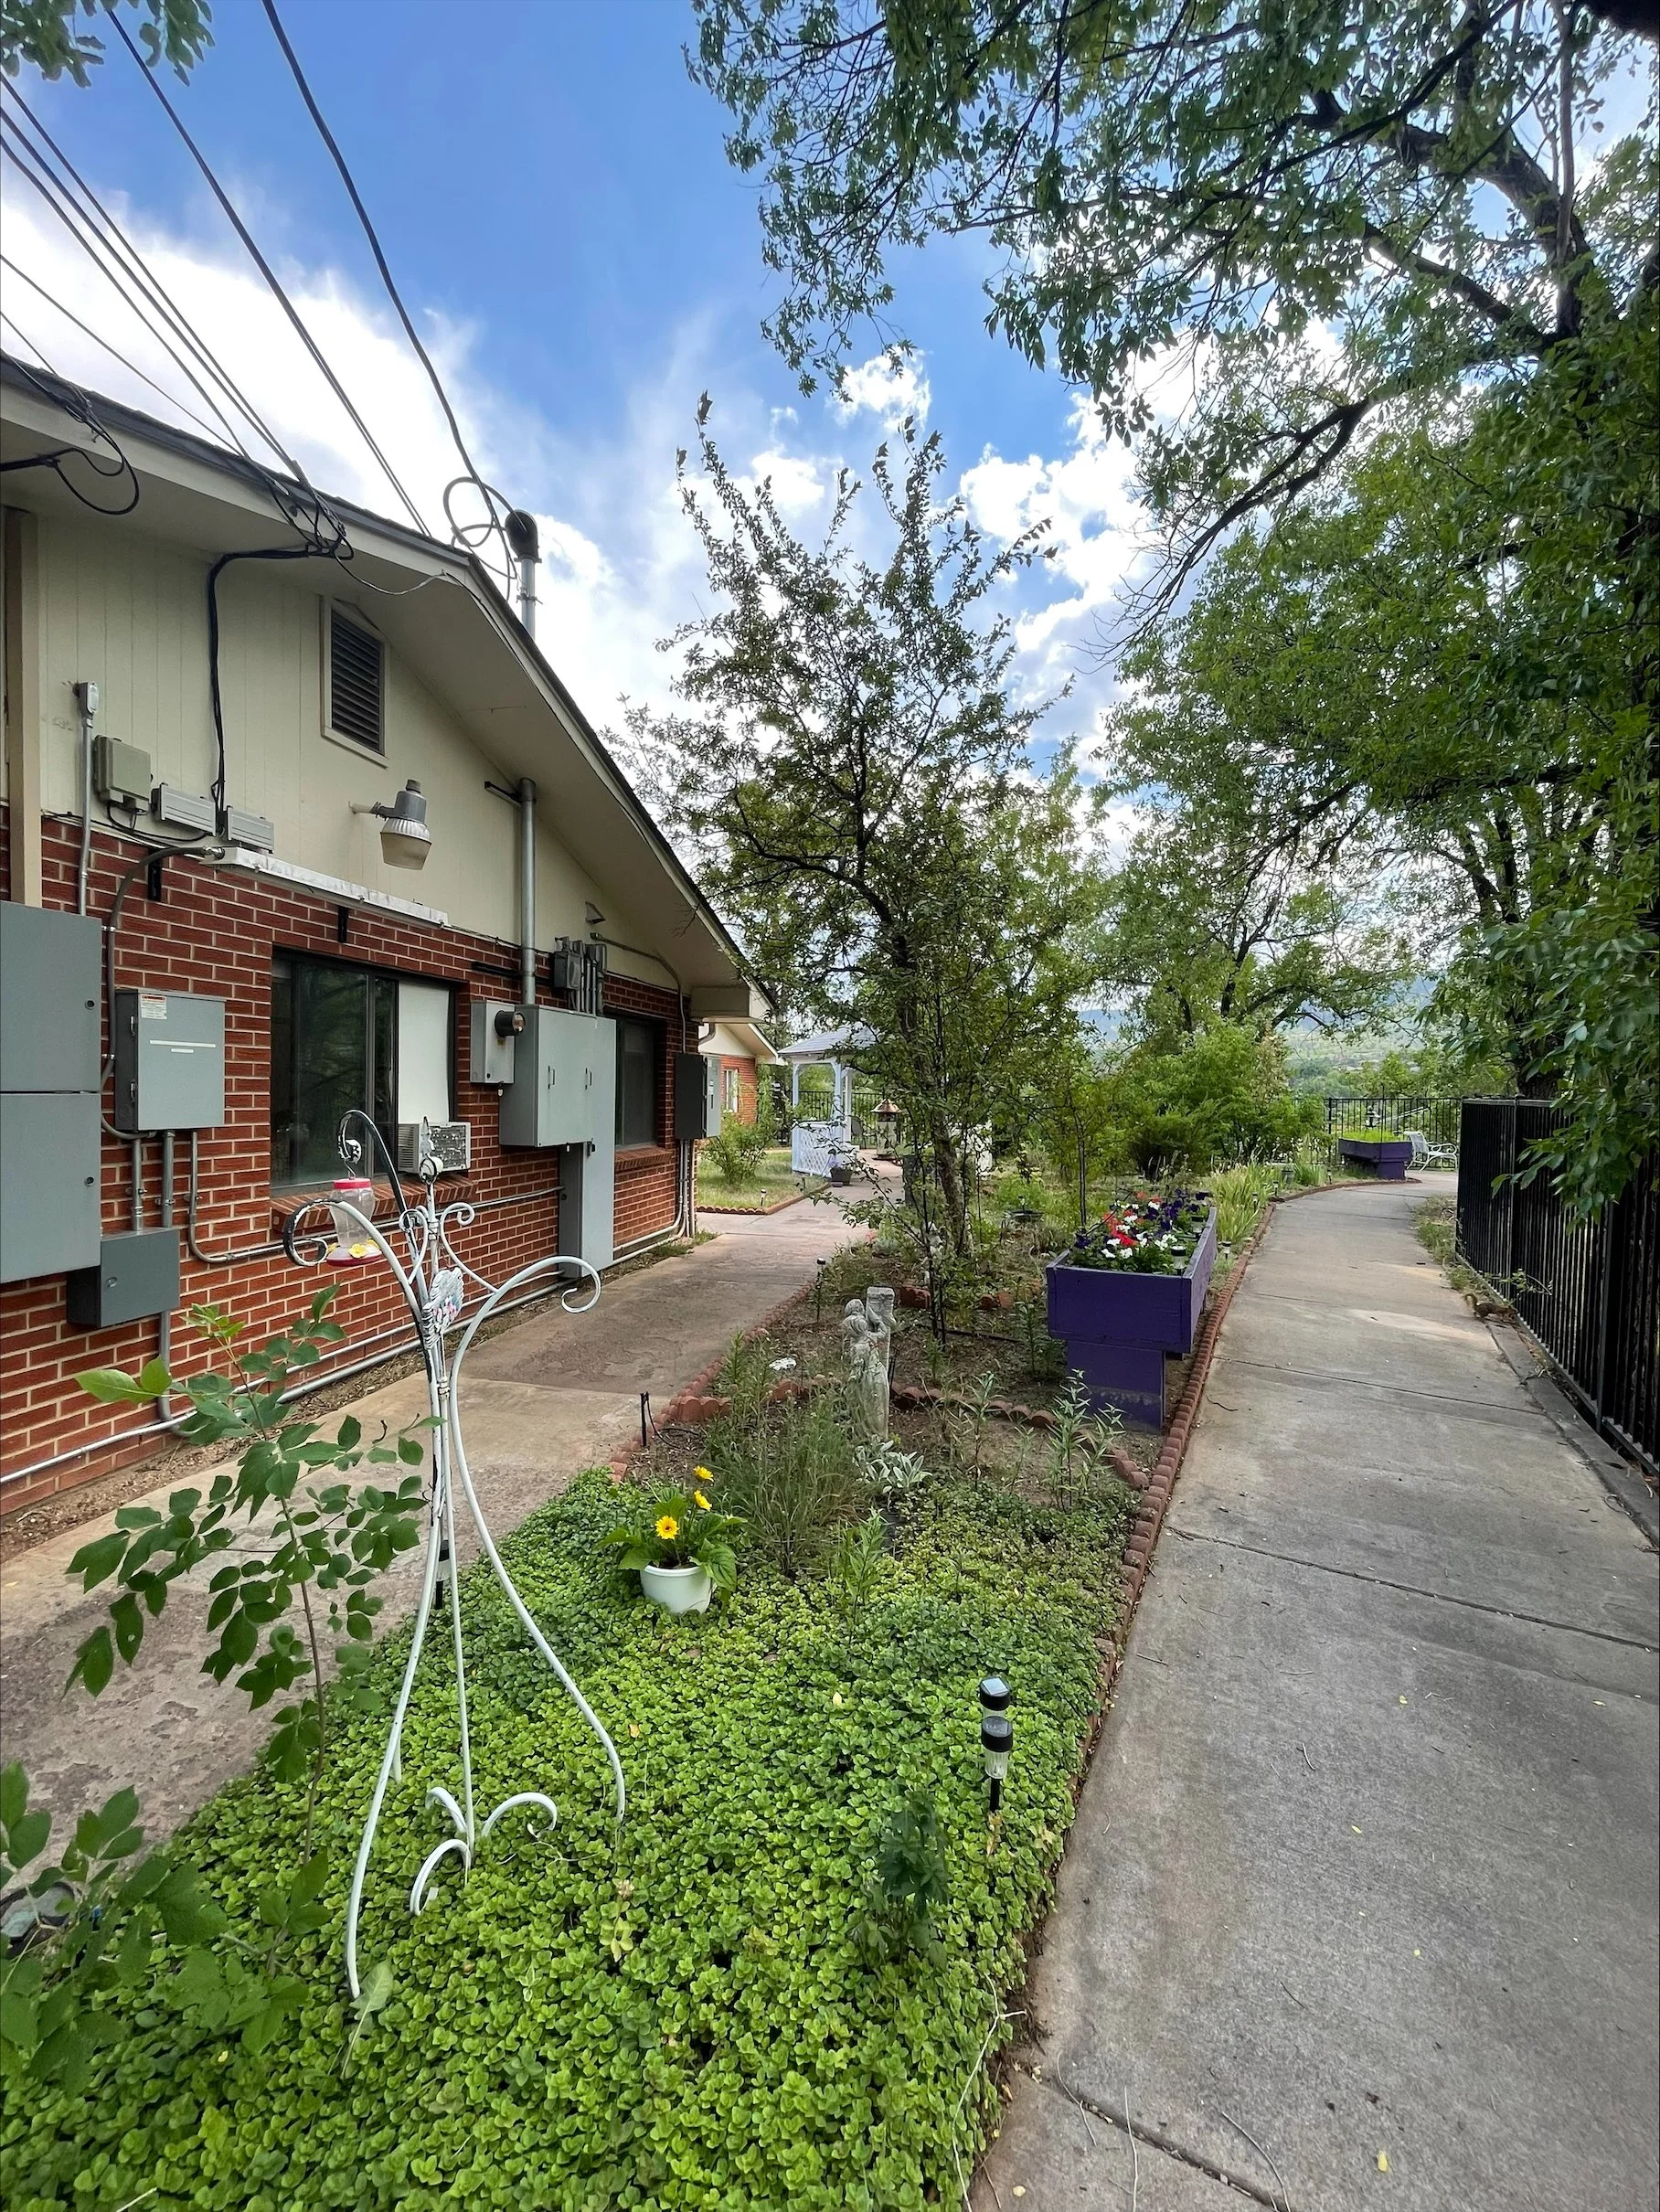
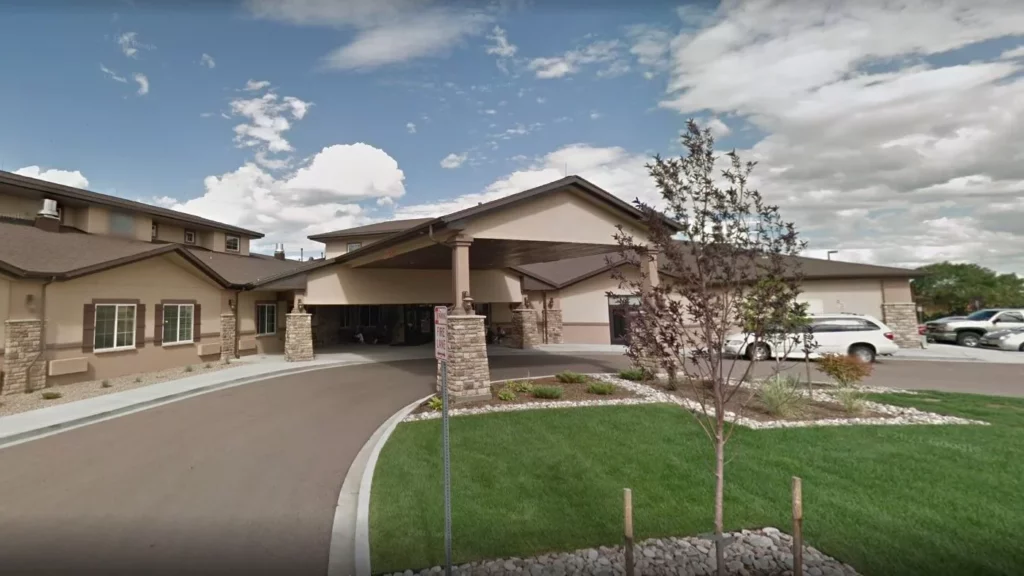
The Gardens Skilled Nursing and Rehabilitation Center in Colorado Springs boasts 45 Medicare-certified beds where every resident is valued and cared for compassionately and professionally. The presence of 24-hour licensed nurses is a testament to their commitment to providing exceptional care. They ensure the recovery of the residents, giving them a chance to lead fulfilling and active lives. 
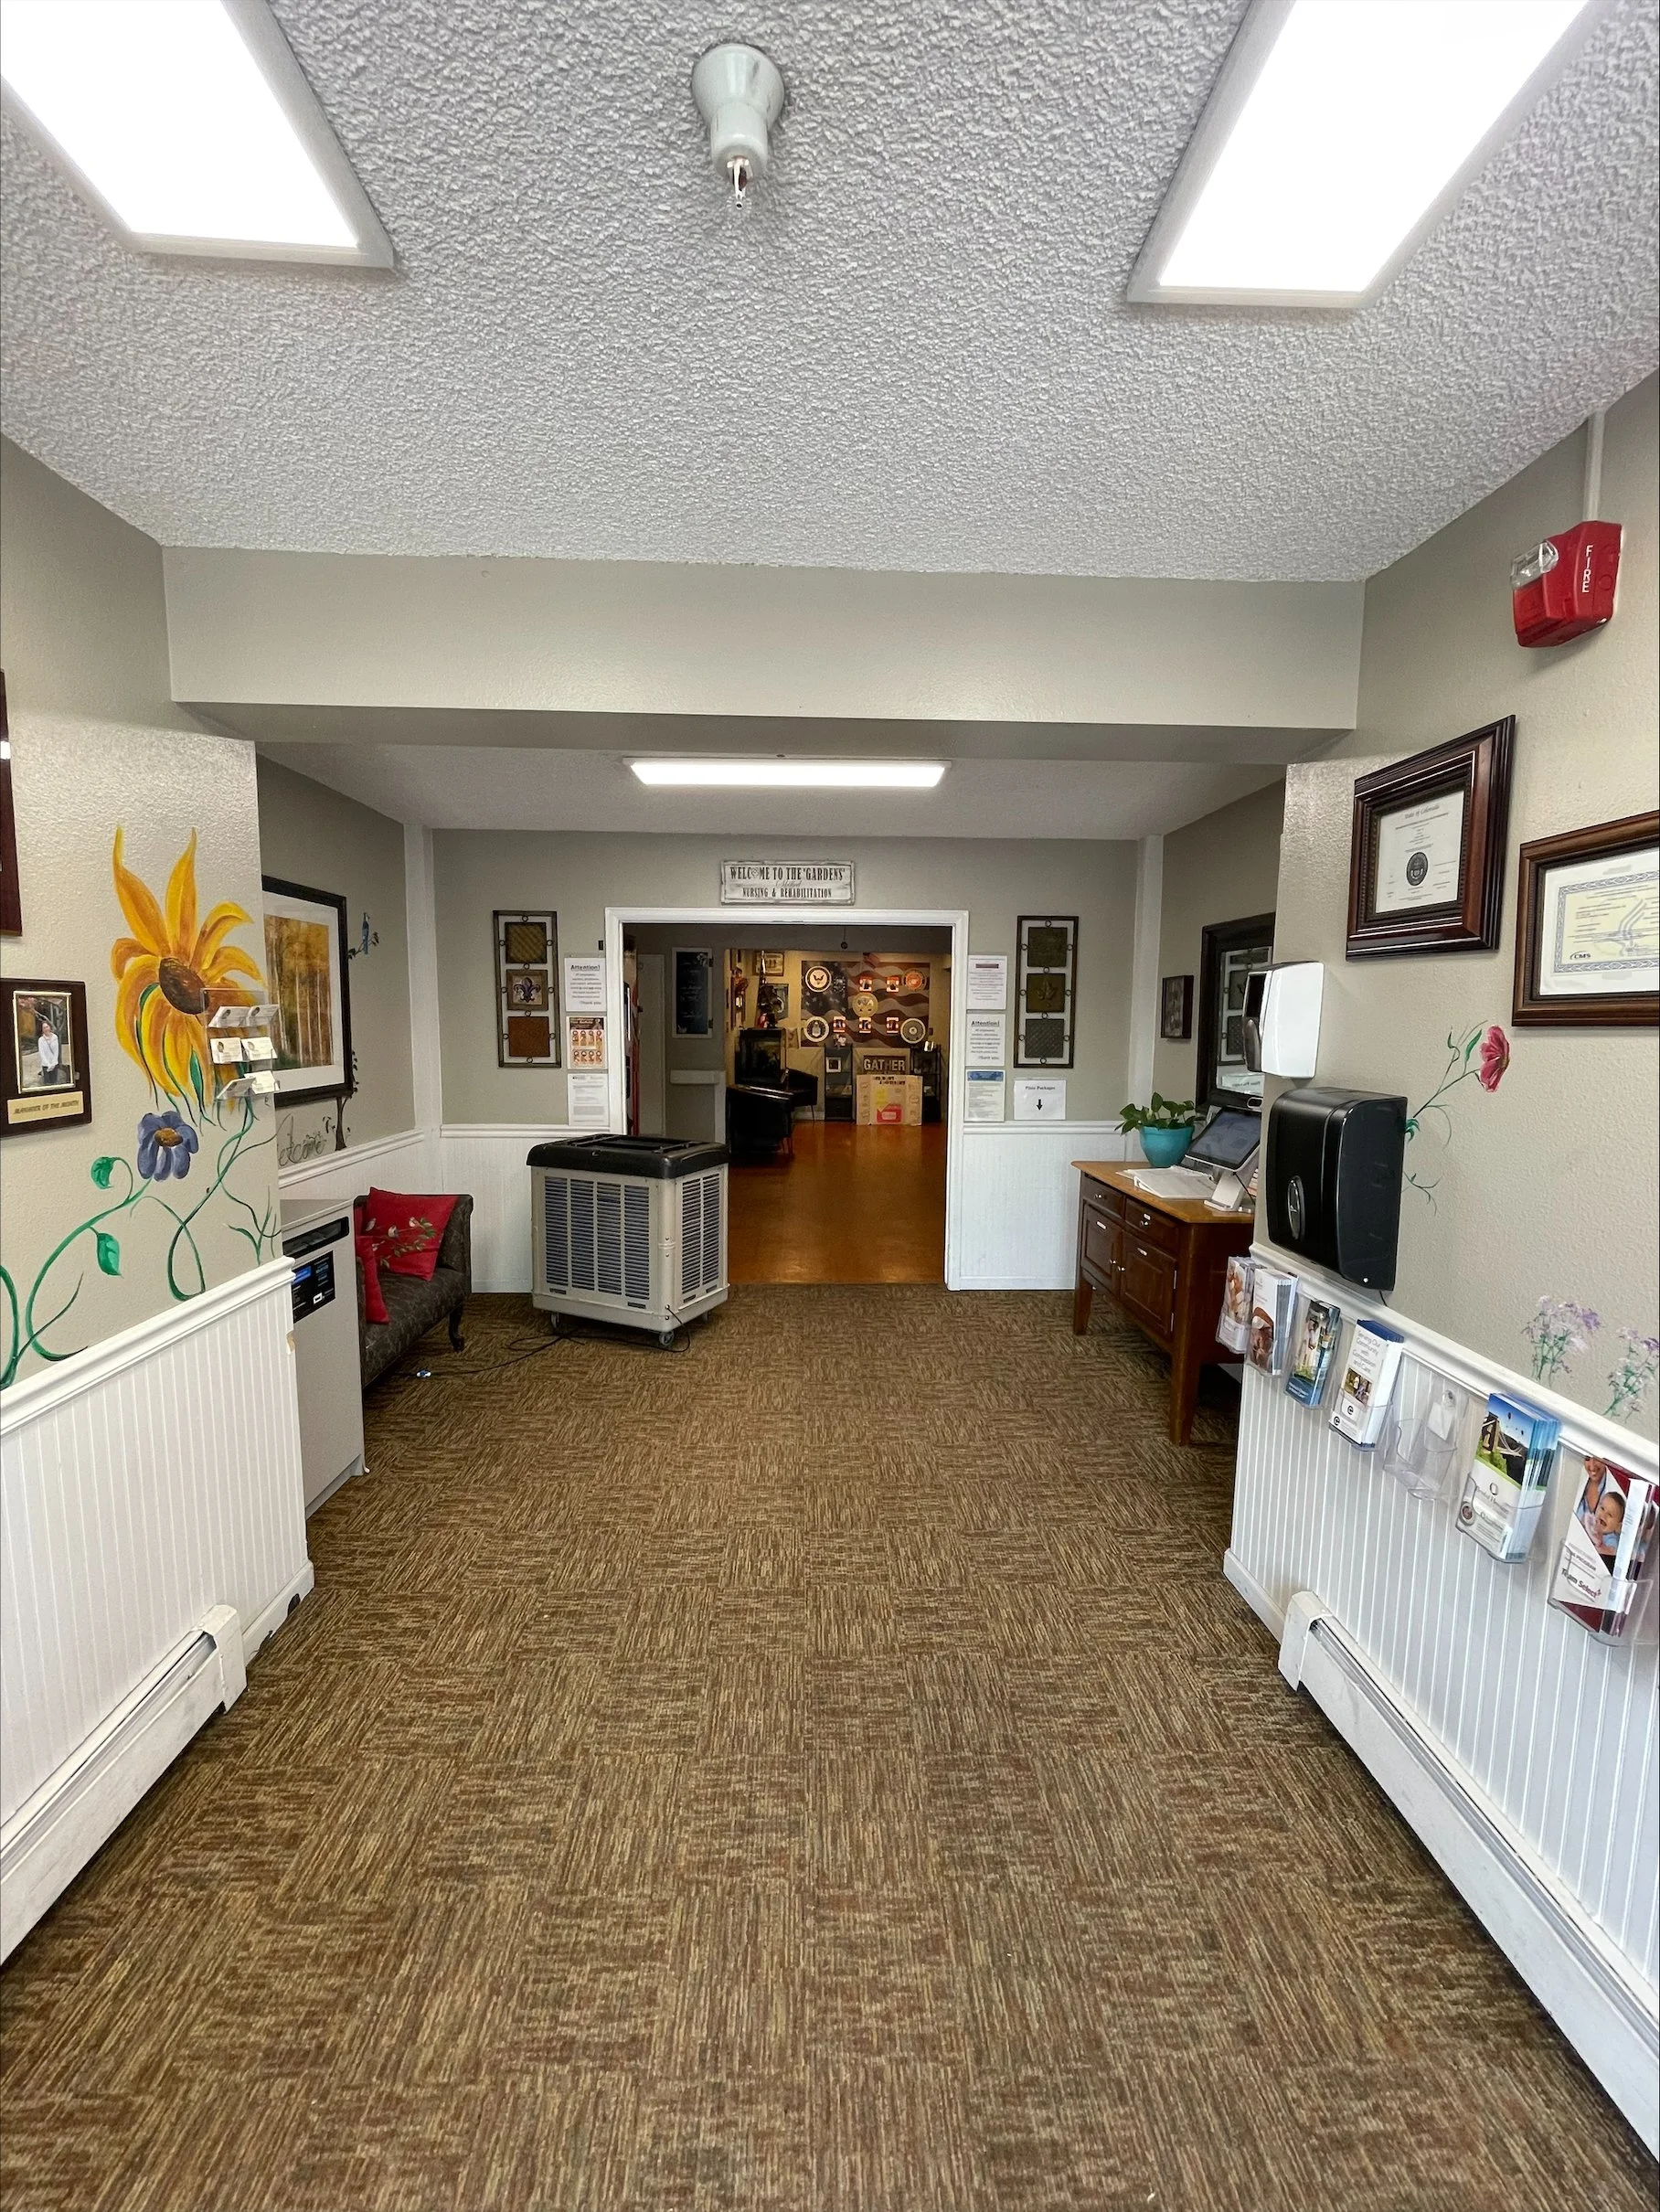
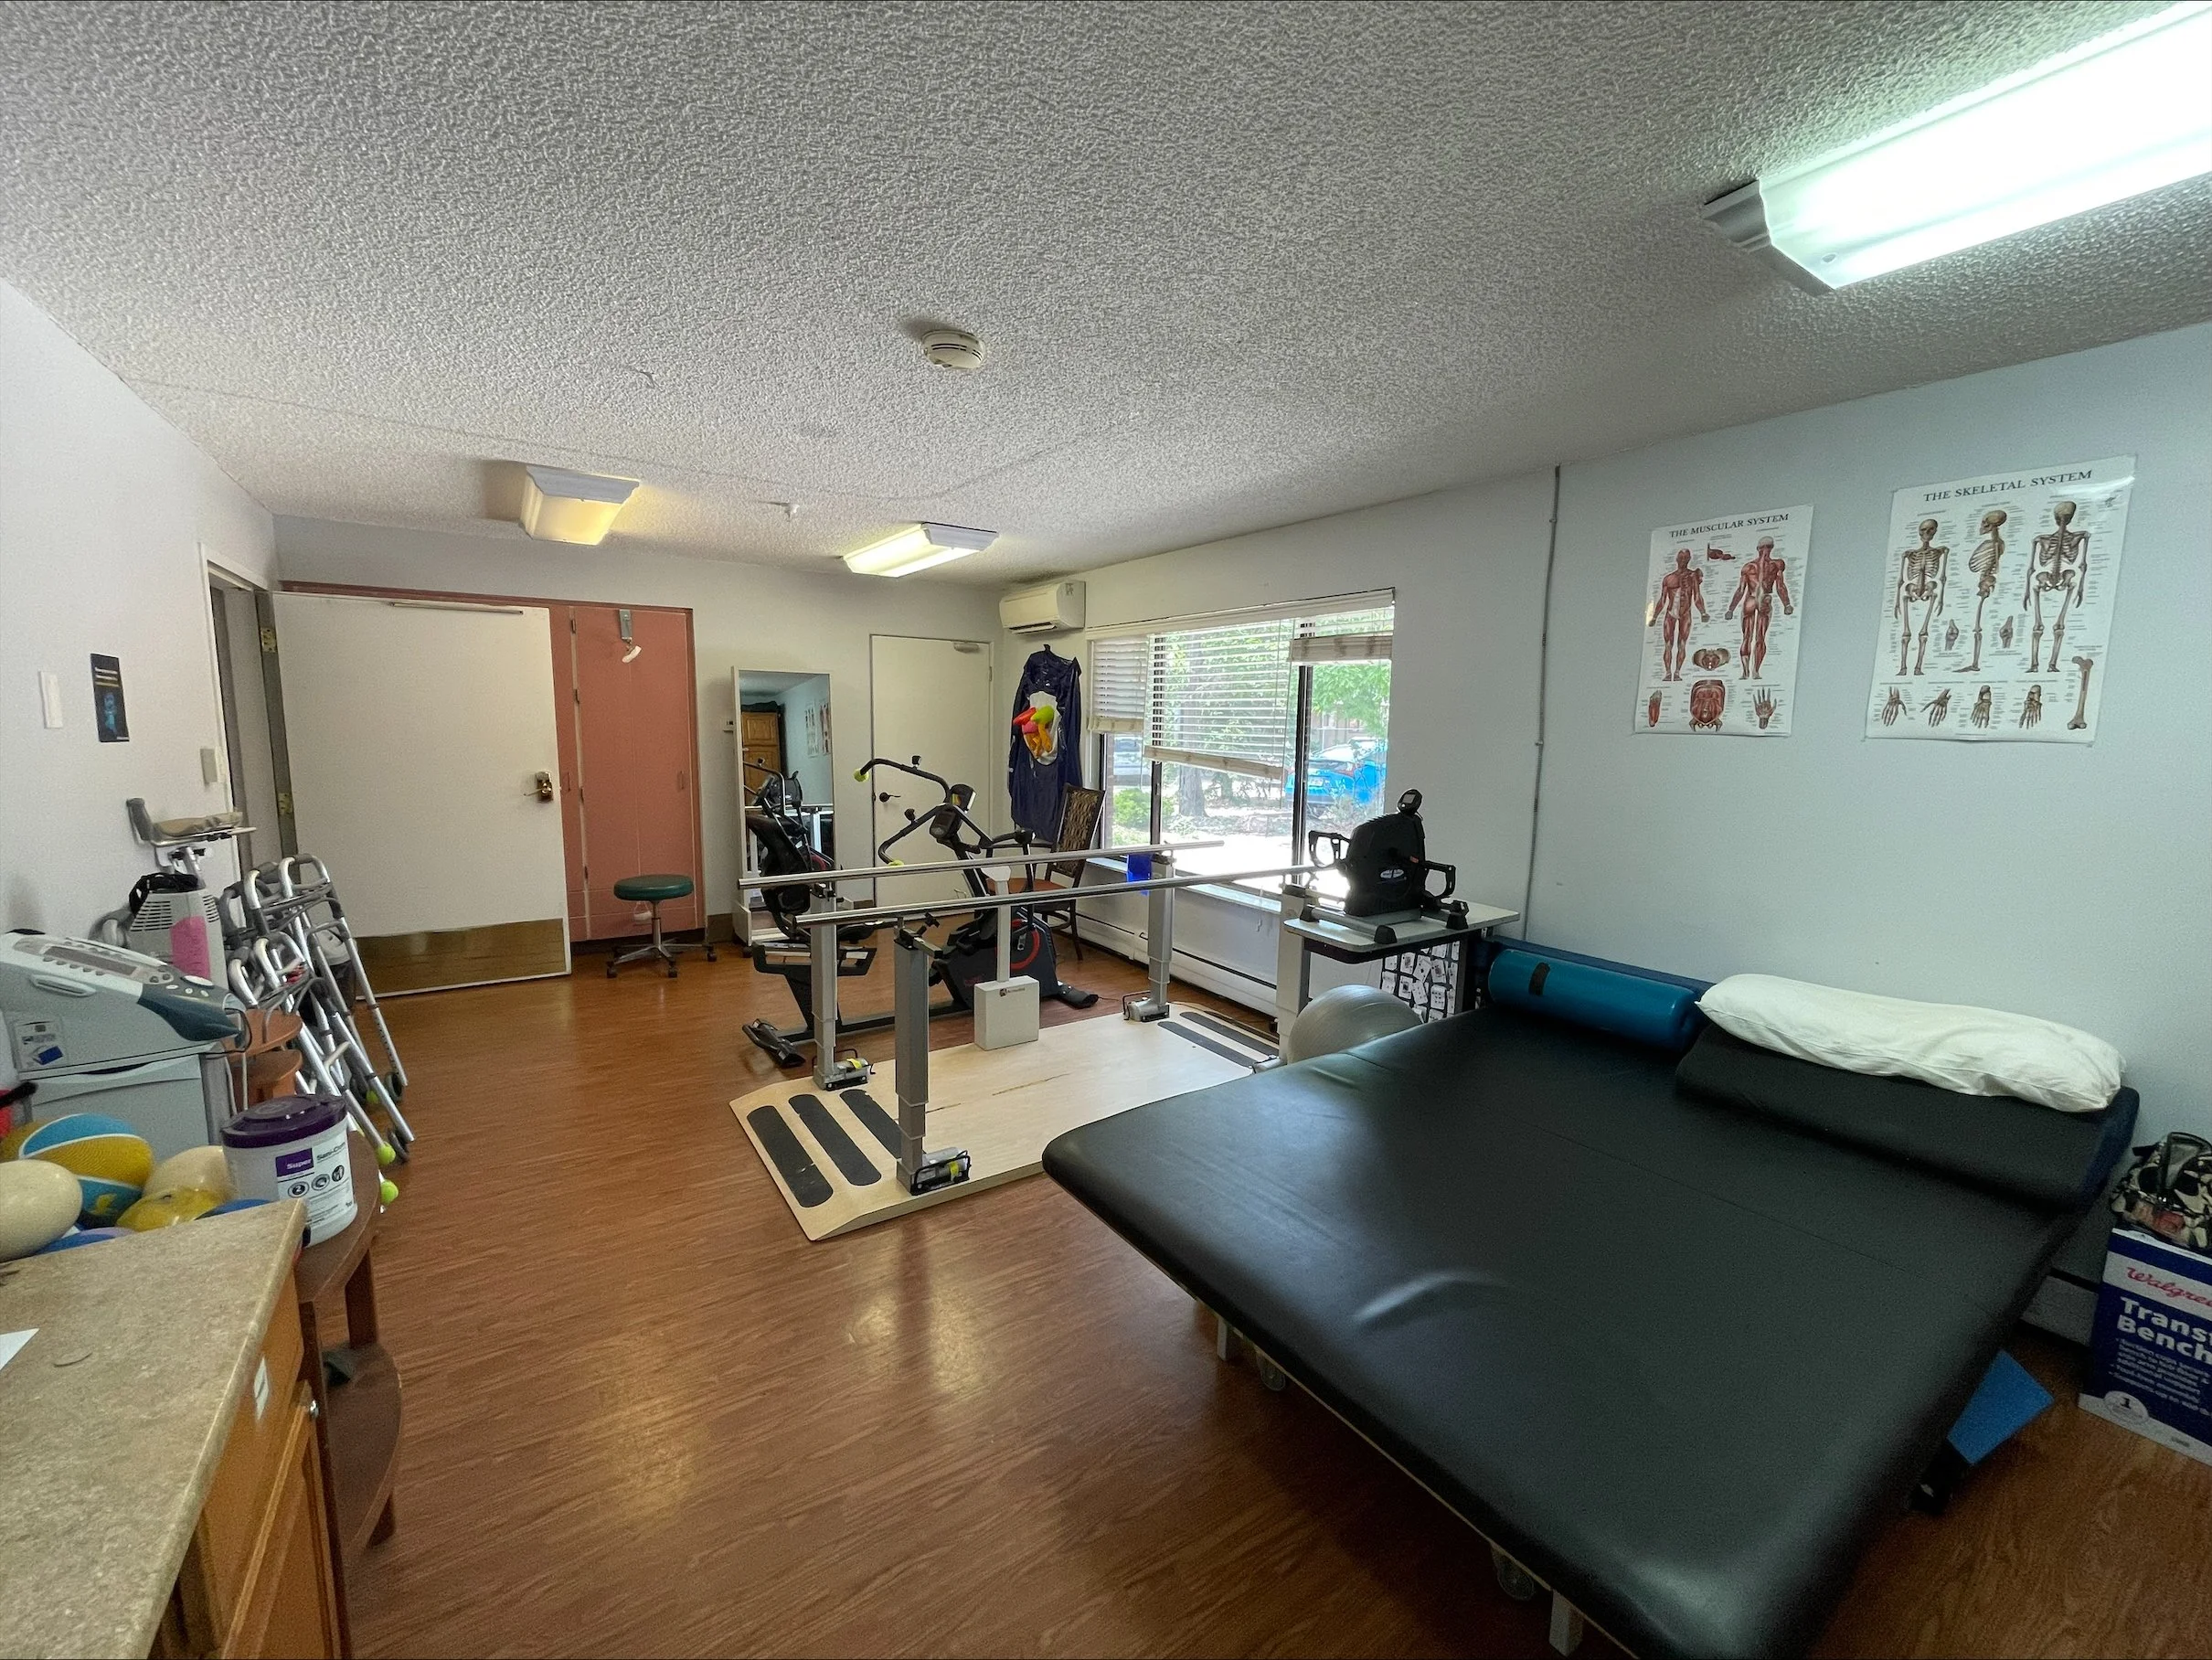
The facility’s provision of physical, occupational, and speech therapy makes it possible for seniors to overcome any challenges and lead a life of independence. It’s the genuine human connection that allows the home to bring satisfaction and meaning to its residents’ lives. The facility focuses on more than just the medical aspect of care but also every person’s emotional well-being. It is a home where seniors are not just another number but are regarded as family. 

Managed by Dillon West

Administrator

Dillon West serves as the Administrator at The Gardens Skilled Nursing and Rehabilitation. He leads a dedicated team passionate about providing quality care and support to residents, ensuring a warm and professional environment throughout the community.

Quality ratings

Measured by Centers for Medicare & Medicaid Services (CMS)

Overall rating Info The Overall CMS Rating combines results from health inspections, staffing levels and quality measures. Health inspections carry the most weight. Staffing and quality scores can increase or decrease the final rating based on performance compared to state and national standards.
5/5
Colorado average: 3.1/5
Health Inspection Info Based on the results of the facility's three most recent standard inspections and any complaint investigations. CMS reviews the number, scope, and severity of deficiencies, with more recent findings weighted more heavily.
5/5
Colorado average: 2.8/5
Staffing Info Measures average nursing staff hours per resident per day, including Registered Nurses (RNs) and total nursing staff. Ratings are adjusted based on the level of care residents require and are compared to state and national benchmarks.
3/5
Colorado average: 3.0/5
Quality Measures Info Based on clinical and physical health indicators reported to CMS, such as hospital readmissions, falls, pressure ulcers, and improvements in mobility. These measures reflect how well residents' health needs are being managed.
4/5
Colorado average: 4.1/5

Nursing care per resident

Info This shows how many total hours of nursing staff time are available per resident each day. Higher numbers usually mean more staff support.
3h 58m per day

This home provides 3% more nursing time per resident than the Colorado average.

Colorado average: 3h 52m per day

Staffing hours breakdown

Info Hours of care per resident per day, broken down by staff type. Data from CMS Medicare.
Staff type Facility State avg National avg
Registered Nurse (RN) Info Registered nurse hours per resident per day. 47m per day 50m per day 41m per day
Nurse Aide Info Nurse aide hours per resident per day. 1h 49m per day 2h 13m per day 2h 21m per day
Total Nursing (Weekend) Info Total number of nurse staff hours per resident per day on weekends. 2h 30m per day 3h 17m per day 3h 26m per day
Physical Therapist Info Physical therapist staff hours per resident per day. 6m per day 5m per day 4m per day
RN (Weekend) Info Registered nurse hours per resident per day on weekends. 34m per day 36m per day 29m per day

Capacity and availability

Smaller home

May offer a more intimate, personalized care environment.

Total beds 45

This home usually has limited availability

Occupancy is moderate, suggesting balanced demand.

Similar demand to the Colorado average
Occupancy rate 91.5%
Residents per day (avg) 44
Occupancy rate
91.5%
Residents per day (avg)
44

Finances and operations

Privately-owned community
Home revenue
$6.0M
Profit
$595.9K
Privately-owned community
Home revenue
$5,990,925.00
Profit
$595,853.00
Payroll costs Info The portion of the home's budget spent on staff, including nurses, caregivers, and other employees who support care and operations.
$2.2M
37.5% of revenue
Other operating costs Info All remaining costs needed to run the home, such as food, utilities, building maintenance, supplies and administrative expenses.
$3.1M
Total costs $5.4M
Walk Score
Walk Score: 46 / 100
Somewhat walkable. A few nearby services may be reachable on foot, but most trips require transportation.

About this community

Additional licensing details

Accreditations: 5-star CMS-rated facility

Care Services

Accepts Medicaid
Accepts Medicare
Nursing Services
Rehabilitation Services
Skilled Nursing
24-Hour Staffing

Amenities & Lifestyle

24-hour laundry
wander guard
restaurant-style dining
free wi-fi access
private rehab rooms
beauty salon
smoking patio

Programs & Activities

Specific Programs
Rehabilitation, Physical Therapy, Occupational Therapy, Speech Therapy, Respiratory Therapy, Mental Health Services, Recreational Therapy, Outpatient Therapy
Operating Hours
Open 24 hours

Dining & Nutrition

Food Description
Restaurant-style dining available.
Meal Schedule
Open 24 hours
Contact The Gardens Skilled Nursing and Rehabilitation

Health Inspection History

Inspections
Total health inspections 3

Colorado average 4.8


Last Health inspection on Nov 2023

Total health citations 5

Colorado average 24.8

Citations per inspection
1.67

Colorado average 5.2


Health citations are formal notices following inspections when they fail to comply with safety and care standards.

All 5 citations resulted from standard inspections.

Breakdown of citation severity (last 3 years)
Critical Health citations More info 0
100% better than Colorado average

Colorado average: 0.4


Serious Health citations More info 0
100% better than Colorado average

Colorado average: 2.1

0 critical citations More info Colorado average: 0.4

0 serious citations More info Colorado average: 2.1

5 moderate citations More info Colorado average: 22.2

0 minor citations More info Colorado average: 0.2
Citations history (last 3 years)
Quality of Care moderate citation Info Issues related to how well residents receive appropriate treatment and support for their medical and daily care needs. Nov 30, 2023
Corrected

Abuse/Neglect moderate citation Info Issues related to protecting resident's from harm, including abuse, neglect, or mistreatment. Aug 17, 2022
Corrected

Infection Control moderate citation Info Issues related to preventing and controlling infections, including hygiene practices and safety protocols. Oct 11, 2019
Corrected

Quality of Care moderate citation Info Issues related to how well residents receive appropriate treatment and support for their medical and daily care needs. Oct 11, 2019
Corrected

Compare Nursing Homes around Colorado Springs The information below is reported by the Colorado Department of Public Health and Environment, Health Facilities Division.

5 facilities compared · CMS & CO Dept. of Health data · Updated Mar 2026

Advanced Health Care of Colorado Springs
NH

Nursing Home Licensed facility providing 24/7 skilled nursing care for residents with complex, ongoing medical needs. Staffed by RNs, LPNs, and CNAs. Inspected and star-rated annually by CMS. Accepts Medicare (short-term rehab) and Medicaid (long-term care).

AL

Assisted Living A licensed, long-term care setting for seniors or individuals with disabilities who need help with daily activities — like bathing, dressing, and medication management — but not 24-hour skilled nursing. Offers housing, meals, and around-the-clock support while aiming to maximize resident independence.

Colorado Springs (Southeast Colorado Springs)
34
91.7%
+20%
5.50
-24%
+43%
0
5
0
27
A+
66
Beckman, Robert
$10,3M
$3,1M
29.9%
65407
-
The Gardens Skilled Nursing and Rehabilitation
NH

Nursing Home Licensed facility providing 24/7 skilled nursing care for residents with complex, ongoing medical needs. Staffed by RNs, LPNs, and CNAs. Inspected and star-rated annually by CMS. Accepts Medicare (short-term rehab) and Medicaid (long-term care).

AL

Assisted Living A licensed, long-term care setting for seniors or individuals with disabilities who need help with daily activities — like bathing, dressing, and medication management — but not 24-hour skilled nursing. Offers housing, meals, and around-the-clock support while aiming to maximize resident independence.

Colorado Springs (West Colorado Springs)
45
91.5%
+20%
3.96
-7%
+3%
0
5
0
44
-
46
Madison Partners Inc
$6,0M
$2,2M
37.5%
65198
-
Bear Creek Senior Living
NH

Nursing Home Licensed facility providing 24/7 skilled nursing care for residents with complex, ongoing medical needs. Staffed by RNs, LPNs, and CNAs. Inspected and star-rated annually by CMS. Accepts Medicare (short-term rehab) and Medicaid (long-term care).

AL

Assisted Living A licensed, long-term care setting for seniors or individuals with disabilities who need help with daily activities — like bathing, dressing, and medication management — but not 24-hour skilled nursing. Offers housing, meals, and around-the-clock support while aiming to maximize resident independence.

COLORADO SPRINGS
45
240.5%
+214%
3.14
+41%
-19%
2
13
2
41
A+
-
S-H Forty-Nine Opco Ventures Llc
$12,8M
$5,6M
43.6%
65373
-
Liberty Heights
AL

Assisted Living A licensed, long-term care setting for seniors or individuals with disabilities who need help with daily activities — like bathing, dressing, and medication management — but not 24-hour skilled nursing. Offers housing, meals, and around-the-clock support while aiming to maximize resident independence.

IL

Independent Living Lifestyle-focused communities for older adults offering dining, activities, and transportation with minimal personal care. Best for active, independent seniors who want community without medical support.

MC

Memory Care Secured, specialized care for people living with Alzheimer's or dementia. Staff trained in cognitive impairment, with higher staff-to-resident ratios and an environment designed to reduce confusion and wandering risk.

NH

Nursing Home Licensed facility providing 24/7 skilled nursing care for residents with complex, ongoing medical needs. Staffed by RNs, LPNs, and CNAs. Inspected and star-rated annually by CMS. Accepts Medicare (short-term rehab) and Medicaid (long-term care).

Colorado Springs (Northgate)
92
95.2%
+24%
4.51
+11%
+17%
0
13
0
38
-
40
Ccrc Ops Mb1-T Llc
$18,8M
$7,5M
39.8%
65305
Studio / 1 Bed / 2 Bed
Colonial Health and Rehab Center
NH

Nursing Home Licensed facility providing 24/7 skilled nursing care for residents with complex, ongoing medical needs. Staffed by RNs, LPNs, and CNAs. Inspected and star-rated annually by CMS. Accepts Medicare (short-term rehab) and Medicaid (long-term care).

AL

Assisted Living A licensed, long-term care setting for seniors or individuals with disabilities who need help with daily activities — like bathing, dressing, and medication management — but not 24-hour skilled nursing. Offers housing, meals, and around-the-clock support while aiming to maximize resident independence.

Colorado Springs (Northeast Colorado Springs)
80
86.8%
+14%
3.19
-43%
-17%
1
36
3
74
A+
65
-
$11,6M
$4,1M
35.6%
65225
-

Places of interest near The Gardens Skilled Nursing and Rehabilitation

Address 3.7 miles from city center — 1.78 miles to nearest hospital (Living Rose Wellness)
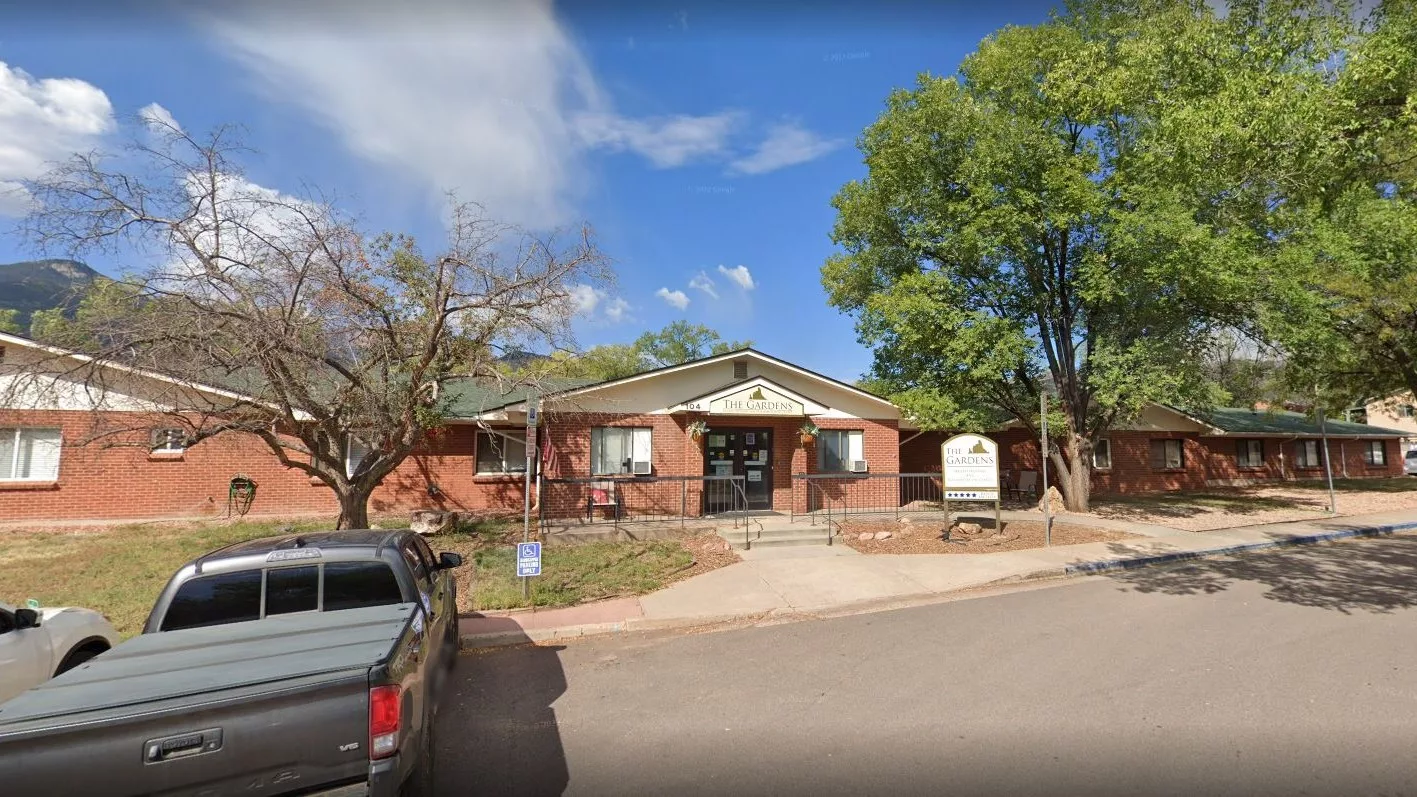
Address 104 Lois Ln, Colorado Springs, CO 80904

Calculate Travel Distance to The Gardens Skilled Nursing and Rehabilitation

Add your location

Address

Staffing Data (Q2 2025)

This data corresponds to Q2 2025 and is based on CMS Payroll-Based Journal.

Total staff 95
Employees 67
Contractors 28
Staff to resident ratio 2.38:1
25% better than Colorado average

Colorado average ratio: 1.91:1

Avg staff/day 22
Average shift 7.8 hours
6% worse than Colorado average

Colorado average: 8.3 hours

Total staff hours (quarter) 15,569
Nursing staff breakdown
Registered Nurse

Manages medical care and health needs.

Total count 12
Average shift length Info Average shift length. Calculated as total hours divided by days worked and average staff per day. 10.1 hours

This role is partially covered by contractors.

Licensed Practical Nurse

Assists with medical care and medications.

Total count 6
Average shift length Info Average shift length. Calculated as total hours divided by days worked and average staff per day. 11.5 hours

No contractors work on this role.

Certified Nursing Assistant

Helps with daily care and mobility.

Total count 53
Average shift length Info Average shift length. Calculated as total hours divided by days worked and average staff per day. 7.7 hours

This role is partially covered by contractors.

Contractor staffing

Total hours from contractors

3.8%

592 contractor hours this quarter

Certified Nursing Assistant: 24 Registered Nurse: 4
Staff by category
Certified Nursing Assistant2924537,14191100%7.7
Registered Nurse84122,36391100%10.1
Licensed Practical Nurse6061,0247582%11.5
Physical Therapy Assistant5055987380%6.6
Qualified Activities Professional2025827481%7.8
Administrator1015206571%8
Nurse Practitioner1015206571%8
Dietitian1014966268%8
Respiratory Therapy Technician4044656470%7.1
RN Director of Nursing1014045055%8.1
Other Dietary Services Staff1013305560%6
Mental Health Service Worker2023123943%8
Qualified Social Worker2023015156%4.4
Speech Language Pathologist1012693943%6.9
Physical Therapy Aide2021483235%4.4
Therapeutic Recreation Specialist101961011%9.6
53 Certified Nursing Assistant
% of Days 100%
12 Registered Nurse
% of Days 100%
6 Licensed Practical Nurse
% of Days 82%
5 Physical Therapy Assistant
% of Days 80%
2 Qualified Activities Professional
% of Days 81%
1 Administrator
% of Days 71%
1 Nurse Practitioner
% of Days 71%
1 Dietitian
% of Days 68%
4 Respiratory Therapy Technician
% of Days 70%
1 RN Director of Nursing
% of Days 55%
1 Other Dietary Services Staff
% of Days 60%
2 Mental Health Service Worker
% of Days 43%
2 Qualified Social Worker
% of Days 56%
1 Speech Language Pathologist
% of Days 43%
2 Physical Therapy Aide
% of Days 35%
1 Therapeutic Recreation Specialist
% of Days 11%

Facility Characteristics

Source: CMS Long-Term Care Facility Characteristics (Data as of Jan 2026)

Total census
40 residents
Residents by payment source
Medicare
5 residents (12.5%)
Medicaid
35 residents (87.5%)
Programs & Services
Residents' Group

Residents meet regularly to discuss policies, care quality, and activities

Family Member Group

Family members meet regularly to discuss policies, care quality, and activities

Nurse Aide Training

State-approved Nurse Aide Training and Competency Evaluation Program on-site

Active Family Council

Organized group of family members that meets regularly to discuss facility policies, resident care, and activities.

Active Resident Council

Organized group of residents that meets regularly to discuss facility policies, quality of life, and activities.

Quality of care over time

These measures show how residents usually do over time at this home, based on health outcomes and preventive care.

High-risk clinical events score Info A composite score based on pressure ulcers, falls with injury, weight loss, walking ability decline, and activities of daily living decline. 10.9
20% worse than Colorado average

Colorado average: 9.0

Functional decline score Info A composite score based on activities of daily living decline, walking ability decline, and incontinence. 19.7
In line with Colorado average

Colorado average: 18.8

Long-stay resident measures
Significantly above average Colorado avg: 3.8 Info CMS star rating based on long-stay quality measure performance. 5 stars = significantly above average, 1 star = significantly below average.
Need for Help with Daily Activities Increased Info Percent of long-stay residents whose need for help with daily activities has increased 17.9%
12% worse than Colorado average

Colorado average: 16.0%

Walking Ability Worsened Info Percent of long-stay residents whose ability to move independently worsened 22.0%
29% worse than Colorado average

Colorado average: 17.0%

Low Risk Residents with Bowel/Bladder Incontinence Info Percent of low risk long-stay residents who lose control of their bowels or bladder 19.2%
17% better than Colorado average

Colorado average: 23.2%

Falls with Major Injury Info Percent of long-stay residents experiencing one or more falls with major injury 1.9%
42% better than Colorado average

Colorado average: 3.3%

High Risk Residents with Pressure Ulcers Info Percent of long-stay high risk residents with pressure ulcers 1.2%
68% better than Colorado average

Colorado average: 3.9%

Urinary Tract Infection Info Percent of long-stay residents with a urinary tract infection 0.0%
100% better than Colorado average

Colorado average: 1.4%

Lost Too Much Weight Info Percent of long-stay residents who lose too much weight 11.2%
115% worse than Colorado average

Colorado average: 5.2%

Depressive Symptoms Info Percent of long-stay residents who have depressive symptoms 0.0%
100% better than Colorado average

Colorado average: 7.2%

Antipsychotic Use Info Percent of long-stay residents who received an antipsychotic medication 10.1%
46% better than Colorado average

Colorado average: 18.8%

Pneumococcal Vaccine Info Percent of long-stay residents assessed and appropriately given the pneumococcal vaccine 100.0%
7% better than Colorado average

Colorado average: 93.3%

Influenza Vaccine Info Percent of long-stay residents assessed and appropriately given the seasonal influenza vaccine 100.0%
6% better than Colorado average

Colorado average: 94.7%

Hospitalizations per 1,000 days Info Number of hospitalizations per 1,000 long-stay resident days. 1.43
10% worse than Colorado average

Colorado average: 1.30

ED visits per 1,000 days Info Number of outpatient emergency department visits per 1,000 long-stay resident days. 3.74
124% worse than Colorado average

Colorado average: 1.67

Short-stay resident measures
Average Colorado avg: 2.9 Info CMS star rating based on short-stay quality measure performance. 5 stars = much above average, 1 star = much below average.
Pneumococcal Vaccine Info Percent of short-stay residents assessed and appropriately given the pneumococcal vaccine 99.0%
29% better than Colorado average

Colorado average: 76.6%

Antipsychotic medication increase Info Percent of short-stay residents who newly received an antipsychotic medication 8.3%
492% worse than Colorado average

Colorado average: 1.4%

Influenza Vaccine Info Percent of short-stay residents assessed and appropriately given the seasonal influenza vaccine 85.2%
13% better than Colorado average

Colorado average: 75.6%

Re-hospitalized after SNF stay Info Percentage of short-stay residents who were re-hospitalized after their nursing home admission. 19.0%
6% better than Colorado average

Colorado average: 20.3%

Emergency department visits Info Percentage of short-stay residents who had an outpatient emergency department visit. 7.0%
45% better than Colorado average

Colorado average: 12.8%

Falls with major injury Info Percentage of SNF residents who experience falls with major injury during their stay. 5.3%
583% worse than Colorado average

Colorado average: 0.8%

Ability to care for self at discharge Info Percentage of residents at or above expected ability to care for themselves at discharge. 37.5%
30% worse than Colorado average

Colorado average: 53.7%

Successful return to home or community Info Rate of successful return to home or community from a skilled nursing facility. 51.4%
In line with Colorado average

Colorado average: 50.6%

Guides for Better Senior Living

Care Cost Calculator: See Prices in Your Area

Nursing Home Data Explorer

Don’t Wait Too Long: 7 Red Flag Signs Your Parent Needs Assisted Living Now

The True Cost of Assisted Living in 2025 – And How Families Are Paying For It

Understanding Senior Living Costs: Pricing Models, Discounts & Financial Assistance

Financial Aid for Colorado Seniors

Get financial aid guidance

Elderly, Blind, and Disabled Waiver

Colorado Medicaid EBD Waiver

Age 65+ or disabled, Colorado resident, Medicaid- eligible, nursing home-level care need.

~$2,829/month (300% FBR, individual).

$2,000 (individual), $3,000 (couple).

Requires level-of-care assessment by case manager.

Old Age Pension (OAP) Health Care Program

Colorado OAP

Age 60+, Colorado resident.

~$1,215/month (individual).

$2,000 (individual).

Supplements SSI; limited medical coverage.

Program of All-Inclusive Care for the Elderly (PACE)

Colorado Medicaid PACE

Age 55+, Colorado resident, nursing home-level care need, safe with PACE support.

~$2,829/month (300% FBR).

$2,000 (individual), $3,000 (couple).

Limited to specific regions (e.g., Denver, Pueblo).

Home Care Allowance (HCA)

Colorado Home Care Allowance (HCA)

Seniors typically 65+, Age 5+ with disability, Colorado resident, financial/functional need.

~$1,004/month (individual, stricter than waivers).

$2,000 (individual), $3,000 (couple).

Must need help with ADLs; not Medicaid-waiver eligible.

Senior Community Service Employment Program (SCSEP)

Colorado SCSEP (federally funded, state-administered)

Age 55+, unemployed, low-income, Colorado resident.

~$1,983/month (125% FPL, individual).

Not specified; income-focused.

Priority for veterans, rural residents.