Total health inspections
3
Florida average 4.3
Last Health inspection on Feb 2024

We arrange tours, appointments, and even moving support so you don’t have to
Thank you for your interest!
Our team will be in touch shortly to help with next steps.

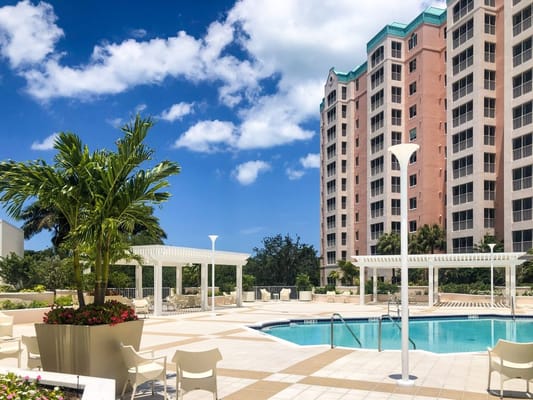

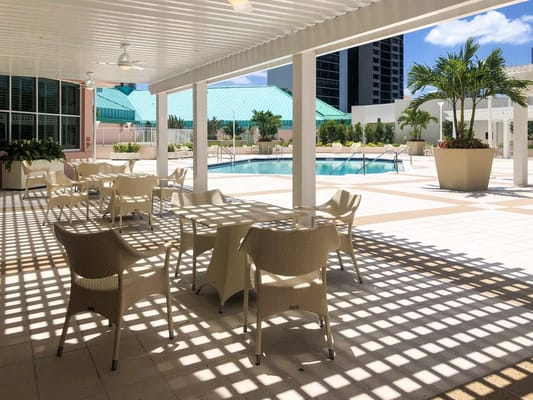
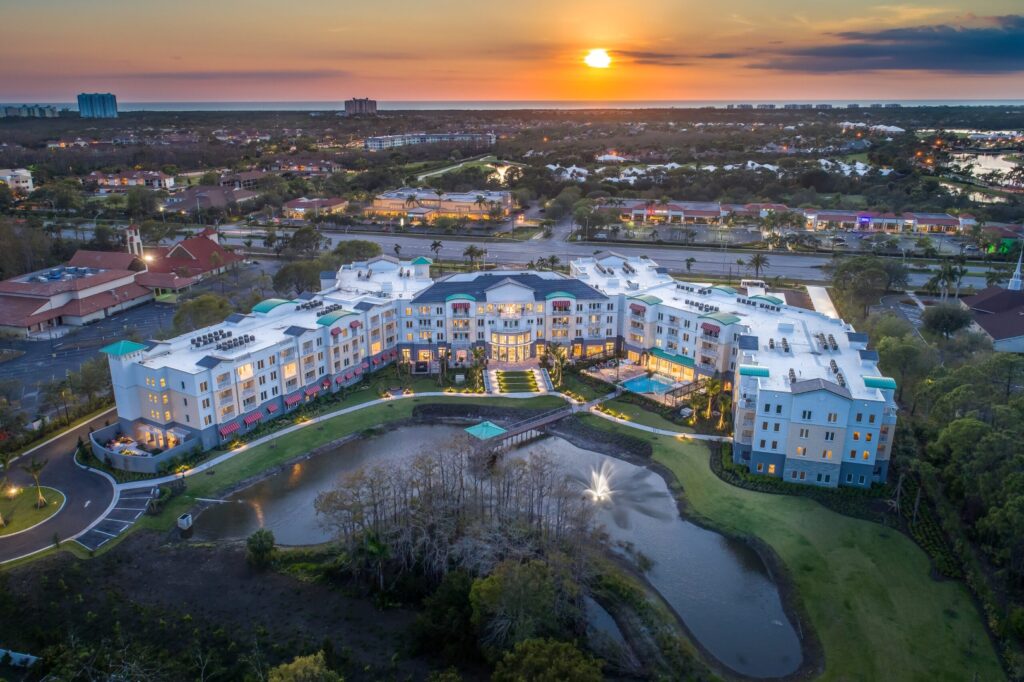
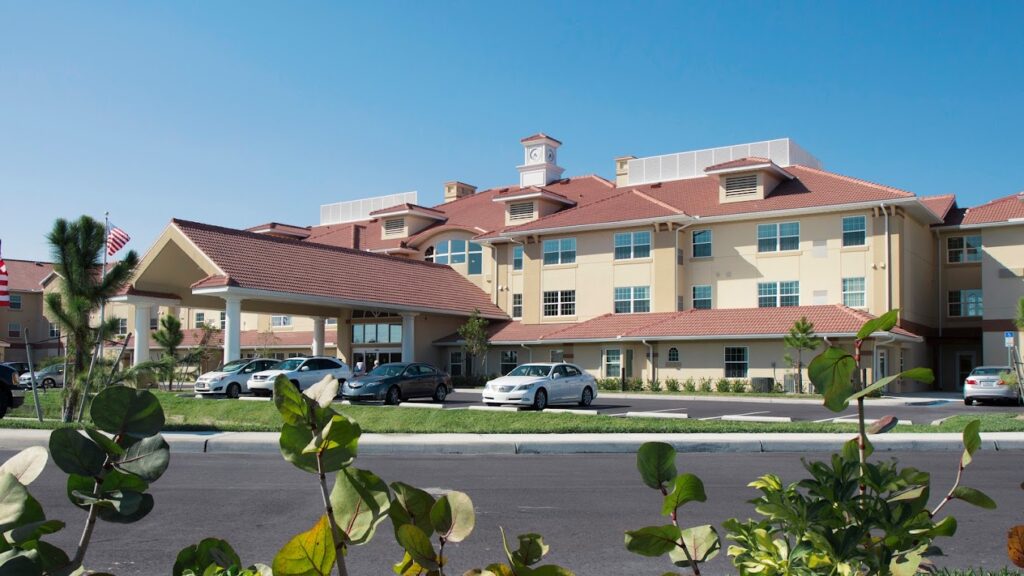
The Glenview at Pelican Bay is one of the trusted luxury independent living homes. Management and staff strive to create a sense of community and belonging where everyone is welcome and included. The multi-awarded community offers professional and compassionate service for its residents and top-notch quality. The Glenview cultivates the holistic needs of its residents in a resort-style setting.
A residential lifestyle is focused on active and fulfilled holistic wellness while creating memorable treasuries. Seniors are offered an array of services, such as restaurant-style dining, walking paths, and independent living apartments designed to meet the needs of every individual.
May offer a more intimate, personalized care environment.
Occupancy is moderate, suggesting balanced demand.
Most residents typically stay for a few weeks or months before returning home or moving on.
73% of new residents, usually for short-term rehab.
27% of new residents, often for short stays.
Pets Allowed: Yes, Pets Allowed
Housing Options: 1 Bed / 2 Bed
Building Type: High-rise
Transportation Services
Fitness and Recreation
Florida average 4.3
Last Health inspection on Feb 2024
Florida average 19.7
Florida average 4.48
Health citations are formal notices following inspections when they fail to comply with safety and care standards.
All 6 citations resulted from standard inspections.
Florida average: 0.8
Florida average: 0.4
Data sourced from CMS Health Deficiencies reports. Citation severity codes range from A (least serious) to L (most serious). Immediate Jeopardy (J-L) citations indicate situations where the facility's noncompliance has placed residents at risk of death or serious harm.
Assisted Living A licensed, long-term care setting for seniors or individuals with disabilities who need help with daily activities — like bathing, dressing, and medication management — but not 24-hour skilled nursing. Offers housing, meals, and around-the-clock support while aiming to maximize resident independence.
Independent Living Lifestyle-focused communities for older adults offering dining, activities, and transportation with minimal personal care. Best for active, independent seniors who want community without medical support.
Memory Care Secured, specialized care for people living with Alzheimer's or dementia. Staff trained in cognitive impairment, with higher staff-to-resident ratios and an environment designed to reduce confusion and wandering risk.
Respite Care Short-term temporary care — days to weeks — to give family caregivers a break. Full care provided during the stay. Often used after hospitalization or to trial a facility before a permanent placement decision.
Home Care Professional care delivered in the person's own home — from companionship and errands to skilled nursing and therapy. Allows seniors to age in place. Medicare covers skilled home health when medically necessary.
Independent Living Lifestyle-focused communities for older adults offering dining, activities, and transportation with minimal personal care. Best for active, independent seniors who want community without medical support.
Nursing Home Licensed facility providing 24/7 skilled nursing care for residents with complex, ongoing medical needs. Staffed by RNs, LPNs, and CNAs. Inspected and star-rated annually by CMS. Accepts Medicare (short-term rehab) and Medicaid (long-term care).
Assisted Living A licensed, long-term care setting for seniors or individuals with disabilities who need help with daily activities — like bathing, dressing, and medication management — but not 24-hour skilled nursing. Offers housing, meals, and around-the-clock support while aiming to maximize resident independence.
Independent Living Lifestyle-focused communities for older adults offering dining, activities, and transportation with minimal personal care. Best for active, independent seniors who want community without medical support.
Memory Care Secured, specialized care for people living with Alzheimer's or dementia. Staff trained in cognitive impairment, with higher staff-to-resident ratios and an environment designed to reduce confusion and wandering risk.
Independent Living Lifestyle-focused communities for older adults offering dining, activities, and transportation with minimal personal care. Best for active, independent seniors who want community without medical support.
Independent Living Lifestyle-focused communities for older adults offering dining, activities, and transportation with minimal personal care. Best for active, independent seniors who want community without medical support.
![]() 6.1 miles from city center — 1.79 miles to nearest hospital (Bascom Palmer Eye Institute at Naples)
6.1 miles from city center — 1.79 miles to nearest hospital (Bascom Palmer Eye Institute at Naples)
Add your location
This data corresponds to Q2 2025 and is based on CMS Payroll-Based Journal.
Florida average ratio: 1.52:1
Florida average: 7.9 hours
Manages medical care and health needs.
No contractors work on this role.
Assists with medical care and medications.
No contractors work on this role.
Helps with daily care and mobility.
No contractors work on this role.
Total hours from contractors
4,949 contractor hours this quarter
| Certified Nursing Assistant | 37 | 0 | 37 | 9,932 | 91 | 100% | 7.3 |
| Registered Nurse | 16 | 0 | 16 | 3,900 | 91 | 100% | 10.5 |
| Speech Language Pathologist | 0 | 10 | 10 | 2,084 | 84 | 92% | 6.3 |
| Licensed Practical Nurse | 7 | 0 | 7 | 2,029 | 86 | 95% | 9.7 |
| Clinical Nurse Specialist | 3 | 0 | 3 | 1,221 | 66 | 73% | 7.6 |
| Physical Therapy Aide | 0 | 4 | 4 | 964 | 74 | 81% | 7.2 |
| Physical Therapy Assistant | 0 | 4 | 4 | 544 | 76 | 84% | 6.2 |
| Administrator | 1 | 0 | 1 | 520 | 65 | 71% | 8 |
| Nurse Practitioner | 1 | 0 | 1 | 520 | 65 | 71% | 8 |
| Other Dietary Services Staff | 1 | 0 | 1 | 492 | 64 | 70% | 7.7 |
| Therapeutic Recreation Specialist | 0 | 2 | 2 | 406 | 55 | 60% | 6.4 |
| Respiratory Therapy Technician | 0 | 4 | 4 | 403 | 75 | 82% | 5.2 |
| Qualified Social Worker | 0 | 3 | 3 | 146 | 54 | 59% | 2.6 |
| Other Physician | 0 | 4 | 4 | 146 | 51 | 56% | 2.1 |
| Occupational Therapy Aide | 0 | 1 | 1 | 129 | 46 | 51% | 2.8 |
| Feeding Assistant | 0 | 1 | 1 | 102 | 37 | 41% | 2.8 |
| Occupational Therapy Assistant | 0 | 1 | 1 | 24 | 3 | 3% | 8 |
| Medical Director | 0 | 1 | 1 | 3 | 3 | 3% | 1 |
Source: CMS Long-Term Care Facility Characteristics (Data as of Jan 2026)
Part of a Continuing Care Retirement Community offering multiple care levels
Data sourced from CMS Long-Term Care Facility Characteristics quarterly report. Payer mix reflects the current resident census by primary payment source.
These measures show how residents usually do over time at this home, based on health outcomes and preventive care.
Florida average: 7.4
Florida average: 12.4
Florida average: 10.5%
Florida average: 13.5%
Florida average: 2.6%
Florida average: 5.4%
Florida average: 0.9%
Florida average: 6.0%
Florida average: 3.3%
Florida average: 8.0%
Florida average: 97.7%
Florida average: 94.0%
Florida average: 1.5%
Florida average: 94.7%
Quality measures are calculated from Minimum Data Set (MDS) assessments. For most measures, lower percentages indicate better care quality.
Historical financial and operational data for The Glenview at Pelican Bay based on CMS SNF Cost Reports.
Loading trend charts...
Care Cost Calculator: See Prices in Your Area
Nursing Home Data Explorer
Don’t Wait Too Long: 7 Red Flag Signs Your Parent Needs Assisted Living Now
The True Cost of Assisted Living in 2025 – And How Families Are Paying For It
Understanding Senior Living Costs: Pricing Models, Discounts & Financial Assistance
Touring a community? Use this expert-backed checklist to stay organized, ask the right questions, and find the perfect fit.
We'll send you a PDF version of the touring checklist.