• Home
  • Nursing Home in Florida
Moorings Park Grande Lake
Nursing Home, Assisted Living, Independent Living & Memory Care · Naples, FL
CMS overall rating Info CMS (the Centers for Medicare & Medicaid Services) is the federal agency that rates nursing home quality. Its Overall Rating runs from 1 to 5 stars, combining health inspections, staffing, and quality measures, with inspections weighted most heavily.

Moorings Park Grande Lake

Nursing Home, Assisted Living, Independent Living & Memory Care · Naples, FL
CMS overall rating Info CMS (the Centers for Medicare & Medicaid Services) is the federal agency that rates nursing home quality. Its Overall Rating runs from 1 to 5 stars, combining health inspections, staffing, and quality measures, with inspections weighted most heavily.
Calculator: See prices in your area
Moorings Park Grande Lake accepts Medicare and private pay.

Overview of Moorings Park Grande Lake

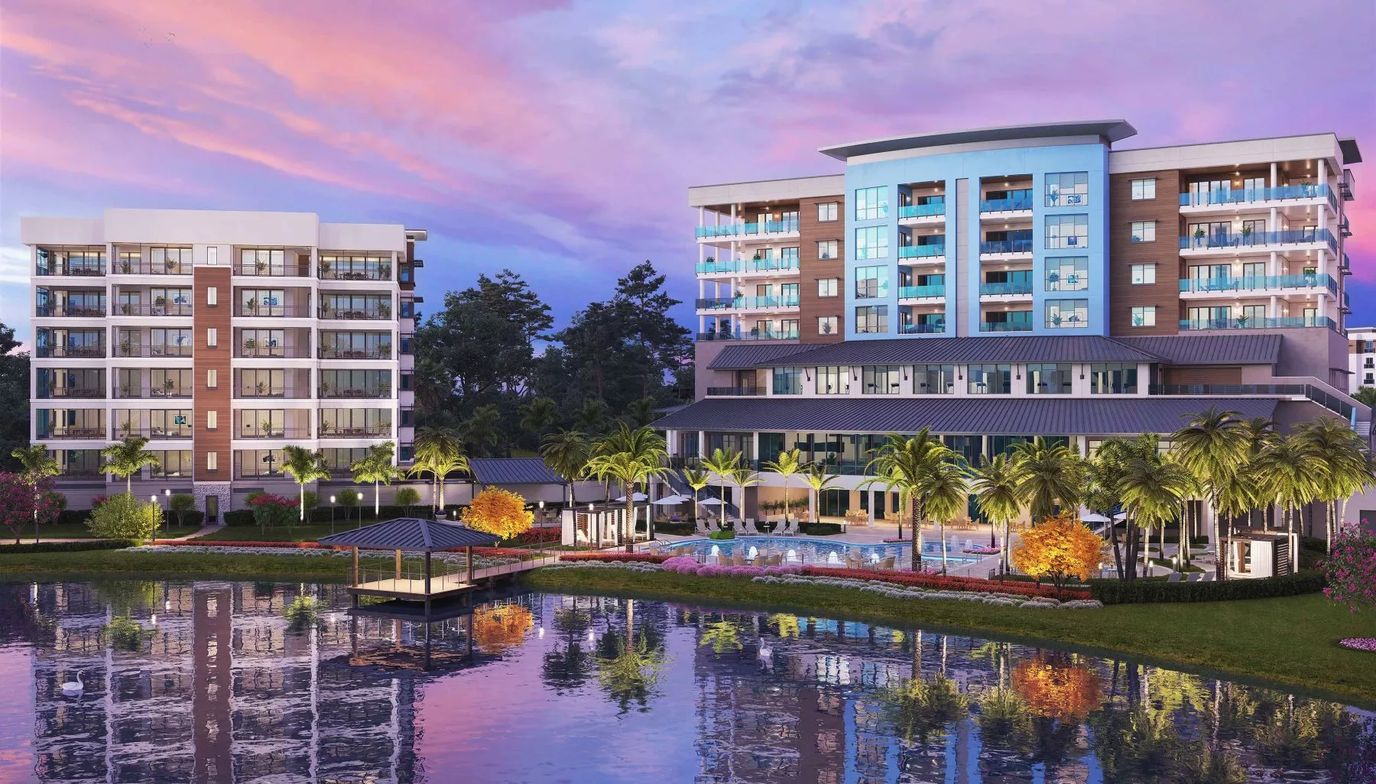
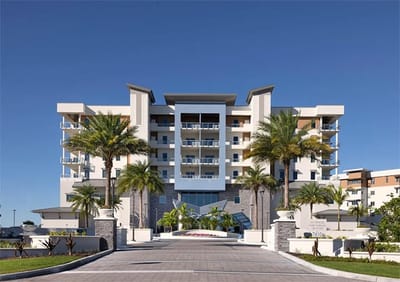
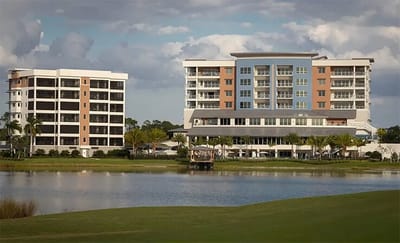
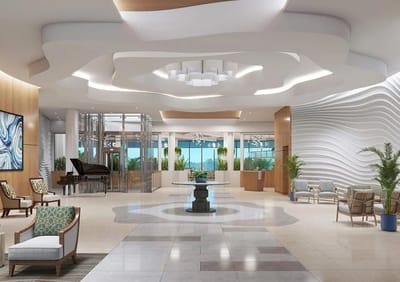
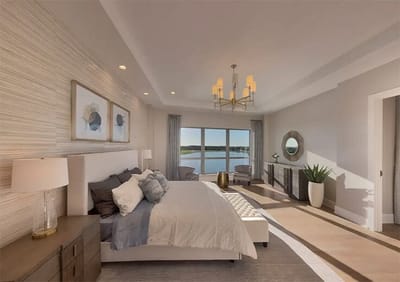
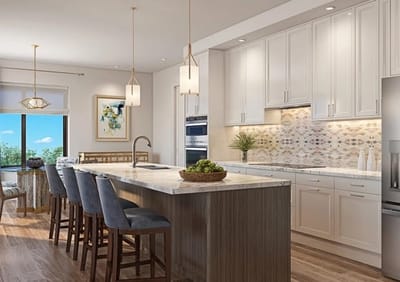
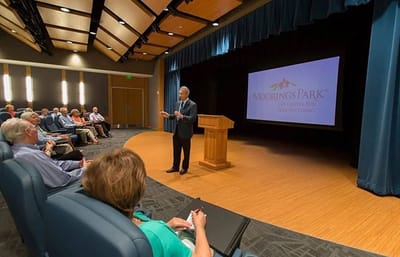
Moorings Park at Grande Lake celebrates purposeful living in a pristine acre of land. They ensure that residents are satisfied with the care and compassion they receive with assisted living, memory care, and skilled nursing services, the senior living home boasts a tropical-style ambiance that creates a beautiful experience for the next home for you or your loved one, making sure residents feel like they belong. They encourage independence in their residents, which is why they provide a lifestyle based on your terms.

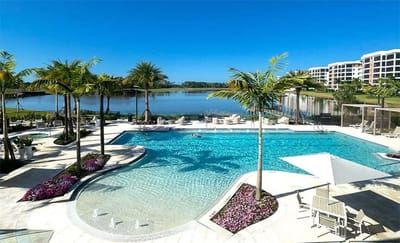
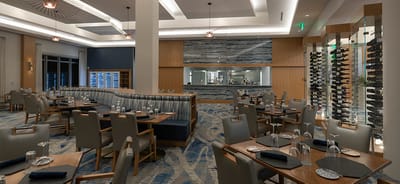
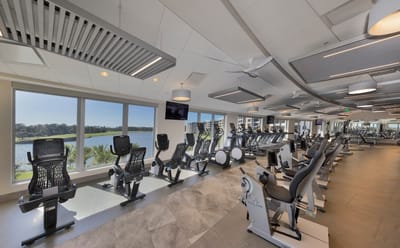
Moorings Park offers comprehensive and exclusive programs for an excellent residential living experience. These include the Simply the Best™ programs centered on amenities designed to live independently with additional support.  The lifelong enrichment program encourages residents to pursue intellectual curiosity and growth by offering specialized courses with their partner university, Florida Gulf. Other amenities include a swimming pool, a fitness center, a hair salon, and an art studio.

Quality ratings

Measured by Centers for Medicare & Medicaid Services (CMS)

Overall rating Info The Overall CMS Rating combines results from health inspections, staffing levels and quality measures. Health inspections carry the most weight. Staffing and quality scores can increase or decrease the final rating based on performance compared to state and national standards.
Health Inspection Info Based on the results of the facility's three most recent standard inspections and any complaint investigations. CMS reviews the number, scope, and severity of deficiencies, with more recent findings weighted more heavily.
Staffing Info Measures average nursing staff hours per resident per day, including Registered Nurses (RNs) and total nursing staff. Ratings are adjusted based on the level of care residents require and are compared to state and national benchmarks.
Quality Measures Info Based on clinical and physical health indicators reported to CMS, such as hospital readmissions, falls, pressure ulcers, and improvements in mobility. These measures reflect how well residents' health needs are being managed.

Staffing hours breakdown

Info Daily nursing hours per resident by staff type, reported to CMS. Higher is generally better — compare this facility to state and national averages to see where staffing stands.

Hours per resident per day — compared to state averages

Total nursing care / resident Info Total adjusted nursing hours per resident per day, combining RN, LPN, and aide time. CMS adjusts this for case-mix so facilities can be fairly compared.
5h 37m per day
Rank #18 / 253Nurse hours — State benchmarkedThis home is ranked 18th out of 253 homes in Florida. Shows adjusted nurse hours per resident per day benchmarked to the Florida average, with a ranking across 253 Florida facilities. More hours mean more direct care. The national average is about 3.5 hrs; below 3.0 is a red flag.Rankings are based only on facilities in Florida that report data for that category. Facilities without available data are excluded from the ranking.Click the rank badge to see the full State ranking.Click here to see the full State ranking.
vs avg
Staff typeHours / Day / Residentvs state avg
Registered Nurse (RN) Info RNs hold the highest nursing license and can assess residents, interpret test results, and direct care plans. More RN hours per day often signals stronger clinical oversight and faster response to health changes. 1h 34m per day
LPN / LVN Info Licensed Practical Nurses (LPNs) or Licensed Vocational Nurses (LVNs) deliver routine hands-on care — medication administration, wound dressing, and monitoring vital signs. They work under RN supervision and make up a large share of daily bedside care. 50m per day
Nurse Aide Info Certified Nurse Aides (CNAs) provide the most direct day-to-day assistance: bathing, dressing, feeding, and mobility. Nurse aide hours are typically the largest staffing category and directly affect residents' quality of life. 3h 20m per day
Weekend Total Nursing Info Combined nursing hours (RN + LPN + Nurse Aide) per resident per day on weekends. Staffing often drops on weekends — this figure reveals whether the facility maintains adequate coverage outside of weekday hours. 5h 3m per day
Physical Therapist Info Hours per resident per day provided by licensed Physical Therapists (PTs) or PT Assistants. PT services help residents recover mobility after injury or illness and are especially important for post-acute (short-stay) rehabilitation. 15m per day
Weekend RN Info Registered nurse hours specifically on weekends. Facilities sometimes reduce RN presence on Saturdays and Sundays — a low weekend RN figure compared to weekday hours can indicate reduced clinical oversight when most administrative staff are absent. 56m per day

Capacity and availability

This home usually has availability

Lower occupancy than the state average
Occupancy rate
82.6% Rank #179 / 258Occupancy rate — State benchmarkedThis home is ranked 179th out of 258 homes in Florida. Shows this facility's occupancy rate versus the Florida average, with its Statewide rank out of 258. Higher occupancy signals strong local demand and financial stability.Rankings are based only on facilities in Florida that report data for that category. Facilities without available data are excluded from the ranking.Click the rank badge to see the full State ranking.Click here to see the full State ranking.
Avg. Length of Stay
49 days
Bed community size
106-bed community Rank #406 / 1074Bed count — State benchmarkedThis home is ranked 406th out of 1074 homes in Florida. Shows this facility's certified or reported bed count compared to other Florida facilities. Larger communities may offer more amenities, programs, and on-site services for residents and families.Rankings are based only on facilities in Florida that report data for that category. Facilities without available data are excluded from the ranking.Click the rank badge to see the full State ranking.Click here to see the full State ranking.
A larger shared setting that may offer more common spaces and organized community services.
Walk Score
Walk Score: 9 / 100 Rank #1282 / 1486Walk Score — State benchmarkedThis home is ranked 1282nd out of 1486 homes in Florida. Shows how walkable this facility's neighborhood is compared to the average Walk Score across Florida facilities. Higher scores benefit residents, families, and staff.Rankings are based only on facilities in Florida that report data for that category. Facilities without available data are excluded from the ranking.Click the rank badge to see the full State ranking.Click here to see the full State ranking.
Car-dependent. Most errands require a car, with limited nearby walkable options.
BBB Rating
BBB Rating: A+ (Not Accredited)
An independent rating from the Better Business Bureau based on factors such as complaint history, transparency, and business practices.
How BBB ratings work

Safety & Compliance

Safety Features24-hour security personnel

Therapy & Rehabilitation

2 services
Rehabilitation Services
Respite Care

Staffing & Medical

1 service
24-Hour Staffing

Amenities & Lifestyle

Resort-Style Pool & Spa
Five-Star Casual & Fine-Dining Restaurants
State-Of-The-Art Fitness Center
Lakefront Boardwalk
Walking Trails
Bocce Ball Court
Putting Greens
Yoga Pavilion
Full Calendar Of Social Events
Aqua Fitness Classes
Wine Tastings
Yoga Instruction
Personal Trainers
Lectures & Seminars
ActivitiesFull calendar of social, recreational, and spiritual activities including chaplaincy service
Specific ProgramsAssisted Living with Memory Support, Outpatient Therapy, Home Health, Physician Services, The Center for Healthy Living
Touring HoursMonday - Friday: 8:30 - 5:00 pm, Saturday: Closed, Sunday: Closed

Pricing & Financial Information

Starting Price$3.7M with 70% refundable entrance fee

Contact Moorings Park Grande Lake

Health Inspection History

Inspections since 2025
Total health inspections 3

State average N/A


Last Health inspection on Sep 2025

Total health citations
5 Rank #19 / 252Health citations — State benchmarkedThis home is ranked 19th out of 252 homes in Florida. Shows this facility's total health deficiency citations benchmarked to the Florida State average, with a ranking across all 252 FL facilities. Lower citation counts earn a better rank.Rankings are based only on facilities in Florida that report data for that category. Facilities without available data are excluded from the ranking.Click the rank badge to see the full State ranking.Click here to see the full State ranking.

State average N/A

Citations per inspection
1.67 Rank #10 / 252Citations per inspection — State benchmarkedThis home is ranked 10th out of 252 homes in Florida. Shows average deficiency citations per CMS inspection for this facility versus the Florida mean across 252 facilities with citation data. Lower is better.Rankings are based only on facilities in Florida that report data for that category. Facilities without available data are excluded from the ranking.Click the rank badge to see the full State ranking.Click here to see the full State ranking.

State average N/A


Health citations are formal notices following inspections when they fail to comply with safety and care standards.

3 of 5 citations resulted from standard inspections; and 2 of 5 resulted from complaint investigations.

Breakdown of citation severity (last 1 year)
Critical health citations
0
In line with State average

State average: N/A


Serious health citations
0
In line with State average

State average: N/A

0 critical citations State average: N/A

0 serious citations State average: N/A

5 moderate citations State average: N/A

0 minor citations State average: N/A
Citations history (last 1 year)
Abuse/Neglect moderate citation Sep 03, 2025
Corrected

Abuse/Neglect moderate citation Aug 20, 2025
Corrected

Nutrition moderate citation Jan 30, 2025
Corrected

Pharmacy moderate citation Jan 30, 2025
Corrected

Staffing Data

Reporting period: October 1 – December 31, 2025 (Q4 2025). Source: CMS Payroll-Based Journal report.

Total staff 159
Employees 155
Contractors 4
Staff to resident ratio 1.87 : 1
0% compared with State average

State average ratio: 0 : 0

Avg staff/day 73
Average shift 7.9 hours
0% compared with State average

State average: 0 hours

Total staff hours (quarter) 53,186

Nursing staff breakdown

Q4 2025 · Oct 1 – Dec 31 More info This data comes from the CMS Payroll-Based Journal report covering October 1 – December 31, 2025.
Registered Nurse

Manages medical care and health needs.

RN Staff Info All 30 RN Staff are full-time employees. No contractors work on this role. 30
Average shift length Info Average shift length. Calculated as total hours divided by days worked and average staff per day. 9 hours
Licensed Practical Nurse

Assists with medical care and medications.

LPN Staff Info All 19 LPN Staff are full-time employees. No contractors work on this role. 19
Average shift length Info Average shift length. Calculated as total hours divided by days worked and average staff per day. 8.9 hours
Certified Nursing Assistant

Helps with daily care and mobility.

CNA Staff Info All 66 CNA Staff are full-time employees. No contractors work on this role. 66
Average shift length Info Average shift length. Calculated as total hours divided by days worked and average staff per day. 7.7 hours

Contractor staffing

Q4 2025 · Oct 1 – Dec 31 More info This data comes from the CMS Payroll-Based Journal report covering October 1 – December 31, 2025.

Total hours from contractors

0.2%

99 contractor hours this quarter

Occupational Therapy Assistant: 3 Medical Director: 1

Staff by category

Q4 2025 · Oct 1 – Dec 31 More info This data comes from the CMS Payroll-Based Journal report covering October 1 – December 31, 2025.
Certified Nursing Assistant6606624,58592100%7.7
Registered Nurse300309,01192100%9
Licensed Practical Nurse190195,70892100%8.9
Clinical Nurse Specialist6062,0697177%7.8
Physical Therapy Assistant5051,9576571%6.9
Respiratory Therapy Technician4041,8137784%7.2
Other Dietary Services Staff6061,4749199%7.6
Speech Language Pathologist5051,3097683%6.8
Therapeutic Recreation Specialist2028606975%7
Physical Therapy Aide2028436773%6.9
Occupational Therapy Aide2025216672%7.2
Nurse Practitioner1014966267%8
RN Director of Nursing1014966267%8
Mental Health Service Worker1014886166%8
Other Social Services Staff1014725964%8
Administrator2024485560%8
Dental Services Staff1012883639%8
Qualified Social Worker1012505257%4.8
Occupational Therapy Assistant033812224%3.7
Medical Director0111878%2.6
66 Certified Nursing Assistant
% of Days 100%
30 Registered Nurse
% of Days 100%
19 Licensed Practical Nurse
% of Days 100%
6 Clinical Nurse Specialist
% of Days 77%
5 Physical Therapy Assistant
% of Days 71%
4 Respiratory Therapy Technician
% of Days 84%
6 Other Dietary Services Staff
% of Days 99%
5 Speech Language Pathologist
% of Days 83%
2 Therapeutic Recreation Specialist
% of Days 75%
2 Physical Therapy Aide
% of Days 73%
2 Occupational Therapy Aide
% of Days 72%
1 Nurse Practitioner
% of Days 67%
1 RN Director of Nursing
% of Days 67%
1 Mental Health Service Worker
% of Days 66%
1 Other Social Services Staff
% of Days 64%
2 Administrator
% of Days 60%
1 Dental Services Staff
% of Days 39%
1 Qualified Social Worker
% of Days 57%
3 Occupational Therapy Assistant
% of Days 24%
1 Medical Director
% of Days 8%

Penalties and fines

Federal penalties imposed by CMS for regulatory violations, including civil money penalties (fines) and denials of payment for new Medicare/Medicaid admissions.

Source: CMS Penalties Database

No penalties in the past 3 years

No civil money penalties or payment denials were reported in the last 3 years.

Quality of care over time

These measures show how residents usually do over time at this home, based on health outcomes and preventive care.

High-risk clinical events score Info A composite score based on pressure ulcers, falls with injury, weight loss, walking ability decline, and activities of daily living decline. 12.2
65% worse than State average

State average: 7.4

Functional decline score Info A composite score based on activities of daily living decline, walking ability decline, and incontinence. 23.1
87% worse than State average

State average: 12.4

Long-stay resident measures
Need for Help with Daily Activities Increased Info Percent of long-stay residents whose need for help with daily activities has increased 17.1%
62% worse than State average

State average: 10.5%

Walking Ability Worsened Info Percent of long-stay residents whose ability to move independently worsened 22.1%
70% worse than State average

State average: 12.9%

Low Risk Residents with Bowel/Bladder Incontinence Info Percent of low risk long-stay residents who lose control of their bowels or bladder 30.3%
124% worse than State average

State average: 13.5%

Falls with Major Injury Info Percent of long-stay residents experiencing one or more falls with major injury 1.3%
49% better than State average

State average: 2.6%

High Risk Residents with Pressure Ulcers Info Percent of long-stay high risk residents with pressure ulcers 14.5%
170% worse than State average

State average: 5.4%

Urinary Tract Infection Info Percent of long-stay residents with a urinary tract infection 7.7%
771% worse than State average

State average: 0.9%

Lost Too Much Weight Info Percent of long-stay residents who lose too much weight 6.3%
In line with State average

State average: 6.0%

Depressive Symptoms Info Percent of long-stay residents who have depressive symptoms 1.5%
57% better than State average

State average: 3.3%

Antipsychotic Use Info Percent of long-stay residents who received an antipsychotic medication 8.7%
9% worse than State average

State average: 8.0%

Pneumococcal Vaccine Info Percent of long-stay residents assessed and appropriately given the pneumococcal vaccine 100.0%
In line with State average

State average: 97.7%

Influenza Vaccine Info Percent of long-stay residents assessed and appropriately given the seasonal influenza vaccine 97.5%
In line with State average

State average: 99.2%

Short-stay resident measures
Pneumococcal Vaccine Info Percent of short-stay residents assessed and appropriately given the pneumococcal vaccine 99.4%
6% better than State average

State average: 94.0%

Antipsychotic medication increase Info Percent of short-stay residents who newly received an antipsychotic medication 1.0%
34% better than State average

State average: 1.5%

Influenza Vaccine Info Percent of short-stay residents assessed and appropriately given the seasonal influenza vaccine 88.1%
7% worse than State average

State average: 94.7%

Breakdown by payment type

Medicare

71% of new residents, usually for short-term rehab.

Typical stay 26 days

Private pay

29% of new residents, often for short stays.

Typical stay 3 - 4 months

Facility Characteristics

Source: CMS Long-Term Care Facility Characteristics (Data as of Jan 2026)

Total residents 85
Medicare
42
49.4% of residents
Private pay or other
43
50.6% of residents
Programs & Services
Residents Group

Residents meet regularly to discuss policies, care quality, and activities

Family Member Group

Family members meet regularly to discuss policies, care quality, and activities

CCRC

Part of a Continuing Care Retirement Community offering multiple care levels

Active Family Council

Organized group of family members that meets regularly to discuss facility policies, resident care, and activities.

Active Resident Council

Organized group of residents that meets regularly to discuss facility policies, quality of life, and activities.

Finances and operations

Based on CMS SNF Cost Report for fiscal year ending in 12/2023.

Nonprofit
Nonprofit Corporation
Net patient revenue Info Net patient revenue — what the home actually collects for resident care, after contractual allowances, bad debt and discounts are subtracted from its gross charges (CMS cost report, Worksheet G-3). It covers resident care only; money the home earns from other sources is shown separately as "Other income."
$15.3M
Net patient income Info Net patient income: net patient revenue minus the home's total operating expenses. A positive figure means it earns more from resident care than it spends to deliver it; a negative figure means the opposite. It excludes non-operating "other income."
-$1.1M
Nonprofit Nonprofit Corporation
Net patient revenue Info Net patient revenue — what the home actually collects for resident care, after contractual allowances, bad debt and discounts are subtracted from its gross charges (CMS cost report, Worksheet G-3). It covers resident care only; money the home earns from other sources is shown separately as "Other income."
$15.3M Rank #76 / 257Revenue — State benchmarkedThis home is ranked 76th out of 257 homes in Florida. Shows this facility's annual revenue compared to the Florida average. Higher revenue generally means more resources for staffing and capital — read alongside Payroll %.Rankings are based only on facilities in Florida that report data for that category. Facilities without available data are excluded from the ranking.Click the rank badge to see the full State ranking.Click here to see the full State ranking.
Net patient income Info Net patient income: net patient revenue minus the home's total operating expenses. A positive figure means it earns more from resident care than it spends to deliver it; a negative figure means the opposite. It excludes non-operating "other income."
-$1.1M
Other income Info Money the home earns outside of resident care — such as investments, grants, rentals and other non-operating sources (CMS cost report, Worksheet G-3). It is tracked separately from net patient revenue: it is not part of that figure, and it is not included in net patient income.
$26.1K
Payroll costs Info Staff salaries plus wage-related costs — benefits such as payroll taxes, health insurance and retirement — from the home's own accounting records (CMS cost report, Worksheet A). Contract or agency labor is counted separately, under other operating costs. Rank #69 / 257Payroll — State benchmarkedThis home is ranked 69th out of 257 homes in Florida. Shows total annual staff payroll benchmarked to the Florida average. Higher payroll investment relative to peers often signals better staffing and less reliance on cheaper contract labor.Rankings are based only on facilities in Florida that report data for that category. Facilities without available data are excluded from the ranking.Click the rank badge to see the full State ranking.Click here to see the full State ranking.
$10.2M 66.5% of net patient revenue Info Payroll as a share of revenue: staff salaries and wage-related benefits divided by net patient revenue. A higher figure means more of each revenue dollar goes to staff pay. Rank #144 / 257Payroll % — State benchmarkedThis home is ranked 144th out of 257 homes in Florida. Shows payroll as a percentage of revenue versus the Florida average. Well-run Florida facilities typically land around 49–56% — the top third Statewide. Below 25% may signal understaffing or heavy agency use — read with Staffing ratings.Rankings are based only on facilities in Florida that report data for that category. Facilities without available data are excluded from the ranking.Click the rank badge to see the full State ranking.Click here to see the full State ranking.
Other operating costs Info Everything it costs to run the home apart from payroll — food, utilities, supplies, maintenance, contract labor and administration. Calculated as total operating expense minus payroll (staff salaries and wage-related benefits).
$6.2M
Total costs Info The home's total operating expense for the year — all the costs of running it, salaries included (CMS cost report, Worksheet G-3).
$16.4M

What does this home offer?

Pets allowed icon
Pets allowed icon

Pets Allowed

Housing options icon

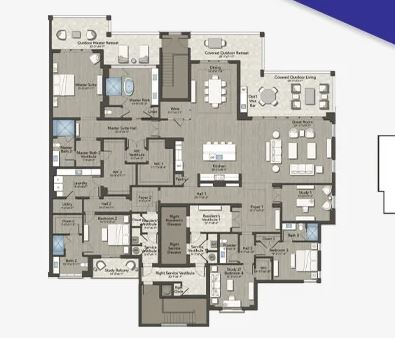
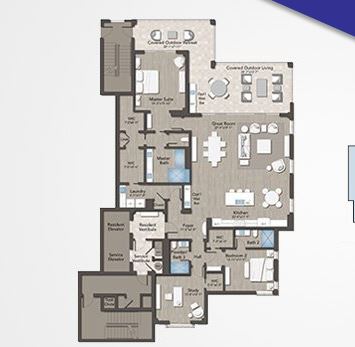
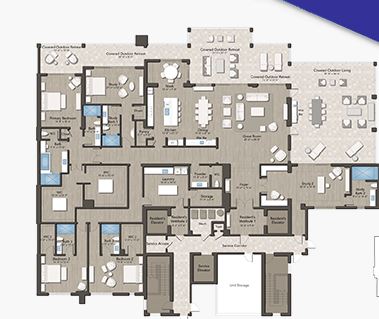
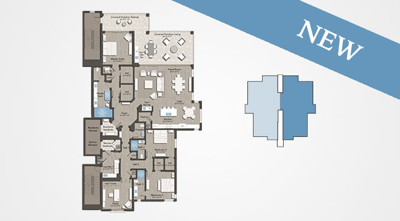
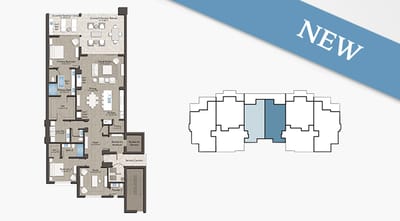
Housing Options: 2 Bed / 3 Bed / 4 Bed

Building type icon
Building type icon

Building Type: Mid-rise

Transportation services icon

Transportation Services

Fitness and recreation icon

Fitness and Recreation

Who this home usually serves

TYPE OF STAY

Mostly short-term rehab stays

Most residents typically stay for a few weeks or months before returning home or moving on.

Most new residents arrive under Medicare (71% of admissions), and a typical Medicare stay runs around 26 days.

Admissions
660 total

Coverage residents most often arrive under.

Medicare 71%
Private pay 29%
Discharges
651 total

Coverage residents most often leave under.

Medicare 72%
Private pay 28%

Living Spaces & Floor Plans for Moorings Park Grande Lake

Places of interest near Moorings Park Grande Lake

Address 3.3 miles from city center Info Estimated distance in miles from Naples's city center to Moorings Park Grande Lake's address, calculated via Google Maps.

Calculate Travel Distance to Moorings Park Grande Lake

Add your location

Address

Compare Nursing Homes around the area

The information below is reported by the Florida Agency for Health Care Administration (AHCA).

Moorings Park Grande Lake
NH
AL
IL
MC
Naples (Central Naples) -106 A+ 9 2 Bed / 3 Bed / 4 Bed
Terracina Grand
NH
AL
IL
MC
RC
Naples -200 A+ 12 Studio / 1 Bed / 2 Bed
Brookdale DeLand
NH
AL
MC
Deland (Scarlett) -89 A+ 14 Studio / Suite
The Oaks of Clearwater
NH
AL
IL
MC
Clearwater (Oak Bluffs) -175 B- 64 Studio / 1 Bed / 2 Bed
The Bridge at Ocala
NH
AL
Ocala -95 A+ 44 Studio / 1 Bed

Frequently Asked Questions about Moorings Park Grande Lake

What neighborhood is Moorings Park Grande Lake in?

Moorings Park Grande Lake is in the Central Naples neighborhood of Naples.

Is Moorings Park Grande Lake in a walkable area?

Moorings Park Grande Lake has a walk score of 9. Car-dependent. Most errands require a car, with limited nearby walkable options.

What is the occupancy rate at Moorings Park Grande Lake?

Moorings Park Grande Lake's occupancy is 82.6%.

Does Moorings Park Grande Lake operate as a for-profit or non-profit?

Moorings Park Grande Lake is registered as a non-profit in FL.

Are there photos of Moorings Park Grande Lake?

Yes — there are 16 photos of Moorings Park Grande Lake in the photo gallery on this page.

What is the address of Moorings Park Grande Lake?

Moorings Park Grande Lake is located at 7410 Little Ln, Naples, FL 34105.

What is the phone number of Moorings Park Grande Lake?

(239) 919-1620 will put you in contact with the team at Moorings Park Grande Lake.

Guides for Better Senior Living

Care Cost Calculator: See Prices in Your Area

Nursing Home Data Explorer

Don’t Wait Too Long: 7 Red Flag Signs Your Parent Needs Assisted Living Now

The True Cost of Assisted Living in 2025 – And How Families Are Paying For It

Understanding Senior Living Costs: Pricing Models, Discounts & Financial Assistance