• Home
  • Nursing Home in Florida
The Glenview at Pelican Bay
Nursing Home & Independent Living · Naples, FL
CMS overall rating Info CMS (the Centers for Medicare & Medicaid Services) is the federal agency that rates nursing home quality. Its Overall Rating runs from 1 to 5 stars, combining health inspections, staffing, and quality measures, with inspections weighted most heavily.

The Glenview at Pelican Bay

Nursing Home & Independent Living · Naples, FL
CMS overall rating Info CMS (the Centers for Medicare & Medicaid Services) is the federal agency that rates nursing home quality. Its Overall Rating runs from 1 to 5 stars, combining health inspections, staffing, and quality measures, with inspections weighted most heavily.
Calculator: See prices in your area
The Glenview at Pelican Bay accepts Medicare and private pay.

Overview of The Glenview at Pelican Bay

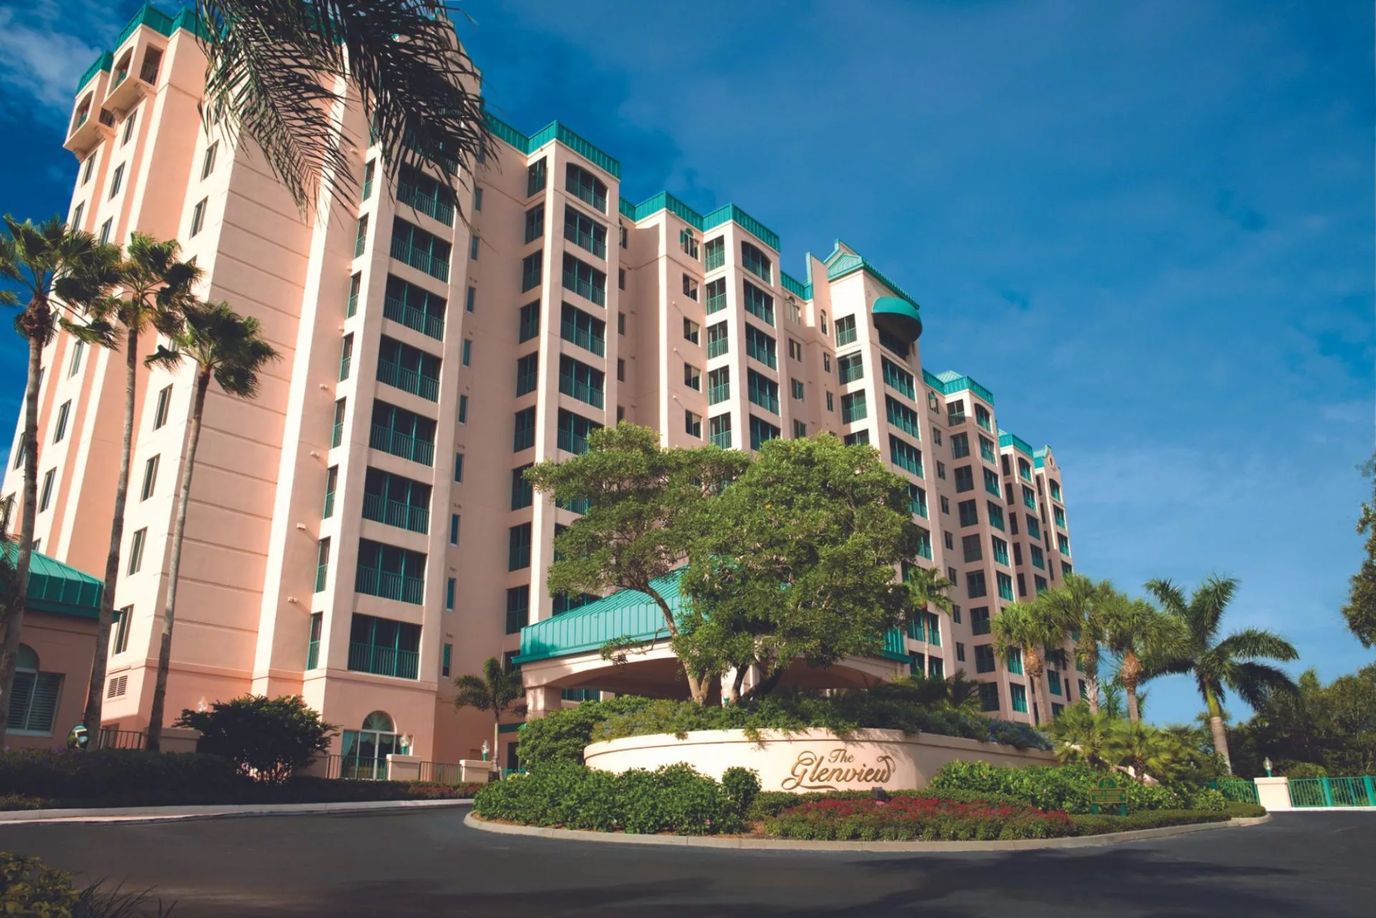
The Glenview at Pelican Bay is one of the trusted luxury independent living homes. Management and staff strive to create a sense of community and belonging where everyone is welcome and included. The multi-awarded community offers professional and compassionate service for its residents and top-notch quality. The Glenview cultivates the holistic needs of its residents in a resort-style setting.

A residential lifestyle is focused on active and fulfilled holistic wellness while creating memorable treasuries. Seniors are offered an array of services, such as restaurant-style dining, walking paths, and independent living apartments designed to meet the needs of every individual.

Quality ratings

Measured by Centers for Medicare & Medicaid Services (CMS)

Overall rating Info The Overall CMS Rating combines results from health inspections, staffing levels and quality measures. Health inspections carry the most weight. Staffing and quality scores can increase or decrease the final rating based on performance compared to state and national standards.
Health Inspection Info Based on the results of the facility's three most recent standard inspections and any complaint investigations. CMS reviews the number, scope, and severity of deficiencies, with more recent findings weighted more heavily.
Staffing Info Measures average nursing staff hours per resident per day, including Registered Nurses (RNs) and total nursing staff. Ratings are adjusted based on the level of care residents require and are compared to state and national benchmarks.
Quality Measures Info Based on clinical and physical health indicators reported to CMS, such as hospital readmissions, falls, pressure ulcers, and improvements in mobility. These measures reflect how well residents' health needs are being managed.

Staffing hours breakdown

Info Daily nursing hours per resident by staff type, reported to CMS. Higher is generally better — compare this facility to state and national averages to see where staffing stands.

Hours per resident per day — compared to state averages

Total nursing care / resident Info Total adjusted nursing hours per resident per day, combining RN, LPN, and aide time. CMS adjusts this for case-mix so facilities can be fairly compared.
4h 52m per day
Rank #32 / 253Nurse hours — State benchmarkedThis home is ranked 32nd out of 253 homes in Florida. Shows adjusted nurse hours per resident per day benchmarked to the Florida average, with a ranking across 253 Florida facilities. More hours mean more direct care. The national average is about 3.5 hrs; below 3.0 is a red flag.Rankings are based only on facilities in Florida that report data for that category. Facilities without available data are excluded from the ranking.Click the rank badge to see the full State ranking.Click here to see the full State ranking.
vs avg
Staff typeHours / Day / Residentvs state avg
Registered Nurse (RN) Info RNs hold the highest nursing license and can assess residents, interpret test results, and direct care plans. More RN hours per day often signals stronger clinical oversight and faster response to health changes. 1h 33m per day
LPN / LVN Info Licensed Practical Nurses (LPNs) or Licensed Vocational Nurses (LVNs) deliver routine hands-on care — medication administration, wound dressing, and monitoring vital signs. They work under RN supervision and make up a large share of daily bedside care. 36m per day
Nurse Aide Info Certified Nurse Aides (CNAs) provide the most direct day-to-day assistance: bathing, dressing, feeding, and mobility. Nurse aide hours are typically the largest staffing category and directly affect residents' quality of life. 2h 44m per day
Weekend Total Nursing Info Combined nursing hours (RN + LPN + Nurse Aide) per resident per day on weekends. Staffing often drops on weekends — this figure reveals whether the facility maintains adequate coverage outside of weekday hours. 4h 33m per day
Physical Therapist Info Hours per resident per day provided by licensed Physical Therapists (PTs) or PT Assistants. PT services help residents recover mobility after injury or illness and are especially important for post-acute (short-stay) rehabilitation. 6m per day
Weekend RN Info Registered nurse hours specifically on weekends. Facilities sometimes reduce RN presence on Saturdays and Sundays — a low weekend RN figure compared to weekday hours can indicate reduced clinical oversight when most administrative staff are absent. 1h 27m per day

Capacity and availability

This home usually has limited availability

Similar occupancy to the state average
Occupancy rate
87.8% Rank #151 / 258Occupancy rate — State benchmarkedThis home is ranked 151st out of 258 homes in Florida. Shows this facility's occupancy rate versus the Florida average, with its Statewide rank out of 258. Higher occupancy signals strong local demand and financial stability.Rankings are based only on facilities in Florida that report data for that category. Facilities without available data are excluded from the ranking.Click the rank badge to see the full State ranking.Click here to see the full State ranking.
Avg. Length of Stay
32 days
Bed community size
42-bed community Rank #804 / 1074Bed count — State benchmarkedThis home is ranked 804th out of 1074 homes in Florida. Shows this facility's certified or reported bed count compared to other Florida facilities. Larger communities may offer more amenities, programs, and on-site services for residents and families.Rankings are based only on facilities in Florida that report data for that category. Facilities without available data are excluded from the ranking.Click the rank badge to see the full State ranking.Click here to see the full State ranking.
A moderately sized community that may balance personal attention with shared amenities and social activities.
Years in operation
55 years in operation
A longer operating history, which may indicate experience navigating regulations and delivering ongoing care.
Walk Score
Walk Score: 27 / 100 Rank #954 / 1486Walk Score — State benchmarkedThis home is ranked 954th out of 1486 homes in Florida. Shows how walkable this facility's neighborhood is compared to the average Walk Score across Florida facilities. Higher scores benefit residents, families, and staff.Rankings are based only on facilities in Florida that report data for that category. Facilities without available data are excluded from the ranking.Click the rank badge to see the full State ranking.Click here to see the full State ranking.
Somewhat walkable. A few nearby services may be reachable on foot, but most trips require transportation.
BBB Rating
BBB Rating: A+ (Not Accredited)
An independent rating from the Better Business Bureau based on factors such as complaint history, transparency, and business practices.
How BBB ratings work

Staffing

Key information about the people who lead and staff this community.

Leadership

ContactMr. Ed Kenny, President

Contact The Glenview at Pelican Bay

Health Inspection History

Inspections since 2020
Total health inspections 3

State average N/A


Last Health inspection on Feb 2024

Total health citations
6 Rank #23 / 252Health citations — State benchmarkedThis home is ranked 23rd out of 252 homes in Florida. Shows this facility's total health deficiency citations benchmarked to the Florida State average, with a ranking across all 252 FL facilities. Lower citation counts earn a better rank.Rankings are based only on facilities in Florida that report data for that category. Facilities without available data are excluded from the ranking.Click the rank badge to see the full State ranking.Click here to see the full State ranking.

State average N/A

Citations per inspection
2 Rank #16 / 252Citations per inspection — State benchmarkedThis home is ranked 16th out of 252 homes in Florida. Shows average deficiency citations per CMS inspection for this facility versus the Florida mean across 252 facilities with citation data. Lower is better.Rankings are based only on facilities in Florida that report data for that category. Facilities without available data are excluded from the ranking.Click the rank badge to see the full State ranking.Click here to see the full State ranking.

State average N/A


Health citations are formal notices following inspections when they fail to comply with safety and care standards.

All 6 citations resulted from standard inspections.

Breakdown of citation severity (last 6 years)
Critical health citations
0
In line with State average

State average: N/A


Serious health citations
0
In line with State average

State average: N/A

0 critical citations State average: N/A

0 serious citations State average: N/A

6 moderate citations State average: N/A

0 minor citations State average: N/A
Citations history (last 6 years)
Quality of Care moderate citation Feb 29, 2024
Corrected

Quality of Care moderate citation Feb 29, 2024
Corrected

Resident Rights moderate citation Feb 29, 2024
Corrected

Pharmacy moderate citation Jun 23, 2022
Corrected

Staffing Data

Reporting period: October 1 – December 31, 2025 (Q4 2025). Source: CMS Payroll-Based Journal report.

Total staff 97
Employees 68
Contractors 29
Staff to resident ratio 2.69 : 1
0% compared with State average

State average ratio: 0 : 0

Avg staff/day 34
Average shift 7.5 hours
0% compared with State average

State average: 0 hours

Total staff hours (quarter) 23,312

Nursing staff breakdown

Q4 2025 · Oct 1 – Dec 31 More info This data comes from the CMS Payroll-Based Journal report covering October 1 – December 31, 2025.
Registered Nurse

Manages medical care and health needs.

RN Staff Info All 15 RN Staff are full-time employees. No contractors work on this role. 15
Average shift length Info Average shift length. Calculated as total hours divided by days worked and average staff per day. 10 hours
Licensed Practical Nurse

Assists with medical care and medications.

LPN Staff Info All 5 LPN Staff are full-time employees. No contractors work on this role. 5
Average shift length Info Average shift length. Calculated as total hours divided by days worked and average staff per day. 10.1 hours
Certified Nursing Assistant

Helps with daily care and mobility.

CNA Staff Info All 40 CNA Staff are full-time employees. No contractors work on this role. 40
Average shift length Info Average shift length. Calculated as total hours divided by days worked and average staff per day. 7.5 hours

Contractor staffing

Q4 2025 · Oct 1 – Dec 31 More info This data comes from the CMS Payroll-Based Journal report covering October 1 – December 31, 2025.

Total hours from contractors

19.2%

4,475 contractor hours this quarter

Speech Language Pathologist: 9 Physical Therapy Assistant: 5 Respiratory Therapy Technician: 4 Qualified Social Worker: 3 Physical Therapy Aide: 2 Medical Director: 1 Occupational Therapy Aide: 1 Therapeutic Recreation Specialist: 1 Feeding Assistant: 1 Other Physician: 1 Occupational Therapy Assistant: 1

Staff by category

Q4 2025 · Oct 1 – Dec 31 More info This data comes from the CMS Payroll-Based Journal report covering October 1 – December 31, 2025.
Certified Nursing Assistant400409,72592100%7.5
Registered Nurse150153,5749199%10
Licensed Practical Nurse5052,1218491%10.1
Speech Language Pathologist0991,7298188%5.9
Clinical Nurse Specialist4041,5207582%8.7
Administrator2029846672%8
Physical Therapy Aide0229357582%7.8
Physical Therapy Assistant0556698289%6.5
Other Dietary Services Staff1014656065%7.7
Nurse Practitioner1014495762%7.9
Respiratory Therapy Technician0443438491%3.6
Therapeutic Recreation Specialist0112203841%5.8
Qualified Social Worker0331656975%2.1
Occupational Therapy Aide0111374751%2.9
Medical Director0111275155%2.5
Feeding Assistant0111234043%3.1
Occupational Therapy Assistant0112433%8
Other Physician011544%1.1
40 Certified Nursing Assistant
% of Days 100%
15 Registered Nurse
% of Days 99%
5 Licensed Practical Nurse
% of Days 91%
9 Speech Language Pathologist
% of Days 88%
4 Clinical Nurse Specialist
% of Days 82%
2 Administrator
% of Days 72%
2 Physical Therapy Aide
% of Days 82%
5 Physical Therapy Assistant
% of Days 89%
1 Other Dietary Services Staff
% of Days 65%
1 Nurse Practitioner
% of Days 62%
4 Respiratory Therapy Technician
% of Days 91%
1 Therapeutic Recreation Specialist
% of Days 41%
3 Qualified Social Worker
% of Days 75%
1 Occupational Therapy Aide
% of Days 51%
1 Medical Director
% of Days 55%
1 Feeding Assistant
% of Days 43%
1 Occupational Therapy Assistant
% of Days 3%
1 Other Physician
% of Days 4%

Penalties and fines

Federal penalties imposed by CMS for regulatory violations, including civil money penalties (fines) and denials of payment for new Medicare/Medicaid admissions.

Source: CMS Penalties Database

No penalties in the past 3 years

No civil money penalties or payment denials were reported in the last 3 years.

Quality of care over time

These measures show how residents usually do over time at this home, based on health outcomes and preventive care.

High-risk clinical events score Info A composite score based on pressure ulcers, falls with injury, weight loss, walking ability decline, and activities of daily living decline. 3.9
48% better than State average

State average: 7.4

Functional decline score Info A composite score based on activities of daily living decline, walking ability decline, and incontinence. 12.2
In line with State average

State average: 12.4

Long-stay resident measures
Need for Help with Daily Activities Increased Info Percent of long-stay residents whose need for help with daily activities has increased 4.2%
60% better than State average

State average: 10.5%

Low Risk Residents with Bowel/Bladder Incontinence Info Percent of low risk long-stay residents who lose control of their bowels or bladder 20.2%
49% worse than State average

State average: 13.5%

Falls with Major Injury Info Percent of long-stay residents experiencing one or more falls with major injury 7.7%
191% worse than State average

State average: 2.6%

High Risk Residents with Pressure Ulcers Info Percent of long-stay high risk residents with pressure ulcers 3.7%
31% better than State average

State average: 5.4%

Urinary Tract Infection Info Percent of long-stay residents with a urinary tract infection 0.0%
100% better than State average

State average: 0.9%

Lost Too Much Weight Info Percent of long-stay residents who lose too much weight 0.0%
100% better than State average

State average: 6.0%

Depressive Symptoms Info Percent of long-stay residents who have depressive symptoms 0.0%
100% better than State average

State average: 3.3%

Antipsychotic Use Info Percent of long-stay residents who received an antipsychotic medication 3.9%
52% better than State average

State average: 8.0%

Pneumococcal Vaccine Info Percent of long-stay residents assessed and appropriately given the pneumococcal vaccine 96.2%
In line with State average

State average: 97.7%

Short-stay resident measures
Pneumococcal Vaccine Info Percent of short-stay residents assessed and appropriately given the pneumococcal vaccine 98.1%
In line with State average

State average: 94.0%

Antipsychotic medication increase Info Percent of short-stay residents who newly received an antipsychotic medication 0.4%
71% better than State average

State average: 1.5%

Influenza Vaccine Info Percent of short-stay residents assessed and appropriately given the seasonal influenza vaccine 98.0%
In line with State average

State average: 94.7%

Breakdown by payment type

Medicare

73% of new residents, usually for short-term rehab.

Typical stay 25 days

Private pay

27% of new residents, often for short stays.

Typical stay 1 - 2 months

Facility Characteristics

Source: CMS Long-Term Care Facility Characteristics (Data as of Jan 2026)

Total residents 36
Medicare
24
66.7% of residents
Private pay or other
12
33.3% of residents
Programs & Services
CCRC

Part of a Continuing Care Retirement Community offering multiple care levels

Finances and operations

Based on CMS SNF Cost Report for fiscal year ending in 12/2023.

For-profit
Corporation
Net patient revenue Info Net patient revenue — what the home actually collects for resident care, after contractual allowances, bad debt and discounts are subtracted from its gross charges (CMS cost report, Worksheet G-3). It covers resident care only; money the home earns from other sources is shown separately as "Other income."
$7.4M
Net patient income Info Net patient income: net patient revenue minus the home's total operating expenses. A positive figure means it earns more from resident care than it spends to deliver it; a negative figure means the opposite. It excludes non-operating "other income."
-$15.1M
For-profit Corporation
Net patient revenue Info Net patient revenue — what the home actually collects for resident care, after contractual allowances, bad debt and discounts are subtracted from its gross charges (CMS cost report, Worksheet G-3). It covers resident care only; money the home earns from other sources is shown separately as "Other income."
$7.4M Rank #64 / 257Revenue — State benchmarkedThis home is ranked 64th out of 257 homes in Florida. Shows this facility's annual revenue compared to the Florida average. Higher revenue generally means more resources for staffing and capital — read alongside Payroll %.Rankings are based only on facilities in Florida that report data for that category. Facilities without available data are excluded from the ranking.Click the rank badge to see the full State ranking.Click here to see the full State ranking.
Net patient income Info Net patient income: net patient revenue minus the home's total operating expenses. A positive figure means it earns more from resident care than it spends to deliver it; a negative figure means the opposite. It excludes non-operating "other income."
-$15.1M
Other income Info Money the home earns outside of resident care — such as investments, grants, rentals and other non-operating sources (CMS cost report, Worksheet G-3). It is tracked separately from net patient revenue: it is not part of that figure, and it is not included in net patient income.
$14.4M
Payroll costs Info Staff salaries plus wage-related costs — benefits such as payroll taxes, health insurance and retirement — from the home's own accounting records (CMS cost report, Worksheet A). Contract or agency labor is counted separately, under other operating costs. Rank #45 / 257Payroll — State benchmarkedThis home is ranked 45th out of 257 homes in Florida. Shows total annual staff payroll benchmarked to the Florida average. Higher payroll investment relative to peers often signals better staffing and less reliance on cheaper contract labor.Rankings are based only on facilities in Florida that report data for that category. Facilities without available data are excluded from the ranking.Click the rank badge to see the full State ranking.Click here to see the full State ranking.
$10.8M 147.2% of net patient revenue Info Payroll as a share of revenue: staff salaries and wage-related benefits divided by net patient revenue. A higher figure means more of each revenue dollar goes to staff pay. Rank #100 / 257Payroll % — State benchmarkedThis home is ranked 100th out of 257 homes in Florida. Shows payroll as a percentage of revenue versus the Florida average. Well-run Florida facilities typically land around 49–56% — the top third Statewide. Below 25% may signal understaffing or heavy agency use — read with Staffing ratings.Rankings are based only on facilities in Florida that report data for that category. Facilities without available data are excluded from the ranking.Click the rank badge to see the full State ranking.Click here to see the full State ranking.
Other operating costs Info Everything it costs to run the home apart from payroll — food, utilities, supplies, maintenance, contract labor and administration. Calculated as total operating expense minus payroll (staff salaries and wage-related benefits).
$11.6M
Total costs Info The home's total operating expense for the year — all the costs of running it, salaries included (CMS cost report, Worksheet G-3).
$22.4M

What does this home offer?

Pets allowed icon
Pets allowed icon

Pets Allowed

Housing options icon

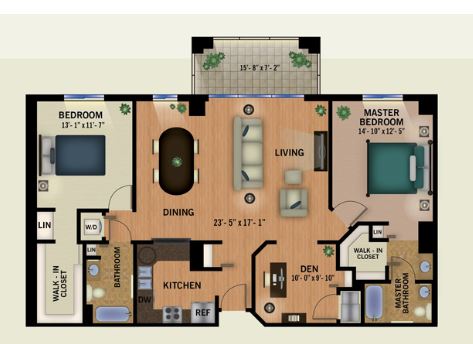
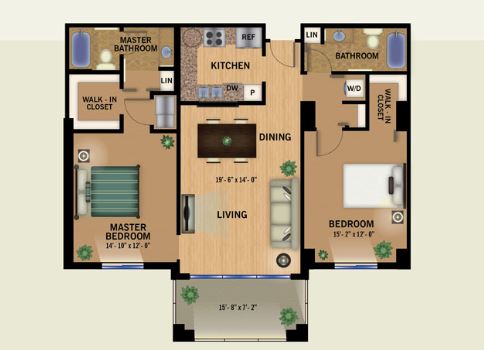
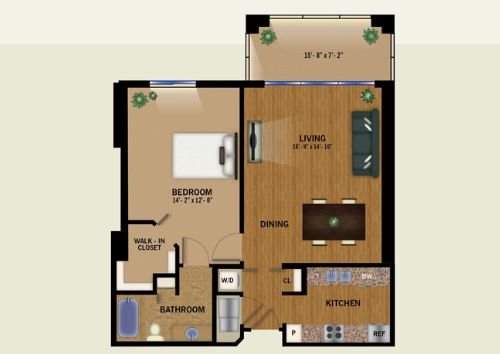
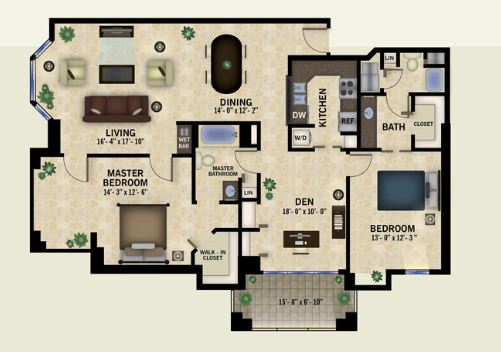
Housing Options: 1 Bed / 2 Bed

Building type icon
Building type icon

Building Type: High-rise

Transportation services icon

Transportation Services

Fitness and recreation icon

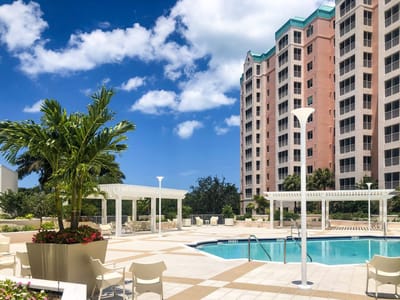
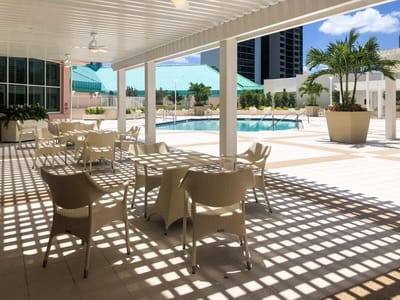
Fitness and Recreation

Who this home usually serves

TYPE OF STAY

Mostly short-term rehab stays

Most residents typically stay for a few weeks or months before returning home or moving on.

Most new residents arrive under Medicare (73% of admissions), and a typical Medicare stay runs around 25 days.

Admissions
431 total

Coverage residents most often arrive under.

Medicare 73%
Private pay 27%
Discharges
416 total

Coverage residents most often leave under.

Medicare 69%
Private pay 31%

Living Spaces & Floor Plans for The Glenview at Pelican Bay

Places of interest near The Glenview at Pelican Bay

Address 6.1 miles from city center Info Estimated distance in miles from Naples's city center to The Glenview at Pelican Bay's address, calculated via Google Maps.

Calculate Travel Distance to The Glenview at Pelican Bay

Add your location

Address

Compare Nursing Homes around the area

The information below is reported by the Florida Agency for Health Care Administration (AHCA).

The Glenview at Pelican Bay
NH
IL
Naples (North Naples) -42 A+ 27 1 Bed / 2 Bed / 3 Bed
Terracina Grand
NH
AL
IL
MC
RC
Naples -200 A+ 12 Studio / 1 Bed / 2 Bed
The Oaks of Clearwater
NH
AL
IL
MC
Clearwater (Oak Bluffs) -175 B- 64 Studio / 1 Bed / 2 Bed
Brookdale Palmer Ranch
NH
AL
IL
MC
Sarasota (Bee Ridge) -118 A+ 3 Studio / 1 Bed / 2 Bed
Brookdale Palm Beach Gardens
NH
AL
IL
MC
Palm Beach Gardens (North Palm Beach) -155 A+ 34 Suite / 1 Bed / 2 Bed

Frequently Asked Questions about The Glenview at Pelican Bay

What neighborhood is The Glenview at Pelican Bay in?

The Glenview at Pelican Bay is in the North Naples neighborhood of Naples.

Is The Glenview at Pelican Bay in a walkable area?

The Glenview at Pelican Bay has a walk score of 27. Somewhat walkable. A few nearby services may be reachable on foot, but most trips require transportation.

What is the occupancy rate at The Glenview at Pelican Bay?

The Glenview at Pelican Bay's occupancy is 87.8%.

Does The Glenview at Pelican Bay operate as a for-profit or non-profit?

The Glenview at Pelican Bay is registered as a for-profit in FL.

Are there photos of The Glenview at Pelican Bay?

Yes — there are 4 photos of The Glenview at Pelican Bay in the photo gallery on this page.

What is the address of The Glenview at Pelican Bay?

The Glenview at Pelican Bay is located at 100 Glenview Pl, Naples, FL 34108.

What is the phone number of The Glenview at Pelican Bay?

(239) 591-0011 will put you in contact with the team at The Glenview at Pelican Bay.

Guides for Better Senior Living

Care Cost Calculator: See Prices in Your Area

Nursing Home Data Explorer

Don’t Wait Too Long: 7 Red Flag Signs Your Parent Needs Assisted Living Now

The True Cost of Assisted Living in 2025 – And How Families Are Paying For It

Understanding Senior Living Costs: Pricing Models, Discounts & Financial Assistance