The Grove La Grange Park
Nursing Home, Memory Care & Palliative Care · La Grange Park, IL
CMS overall rating Info CMS (the Centers for Medicare & Medicaid Services) is the federal agency that rates nursing home quality. Its Overall Rating runs from 1 to 5 stars, combining health inspections, staffing, and quality measures, with inspections weighted most heavily.

The Grove La Grange Park

Nursing Home, Memory Care & Palliative Care · La Grange Park, IL
CMS overall rating Info CMS (the Centers for Medicare & Medicaid Services) is the federal agency that rates nursing home quality. Its Overall Rating runs from 1 to 5 stars, combining health inspections, staffing, and quality measures, with inspections weighted most heavily.
Calculator: See prices in your area
The Grove La Grange Park accepts Medicare, Medicaid, and private pay.

Overview of The Grove La Grange Park

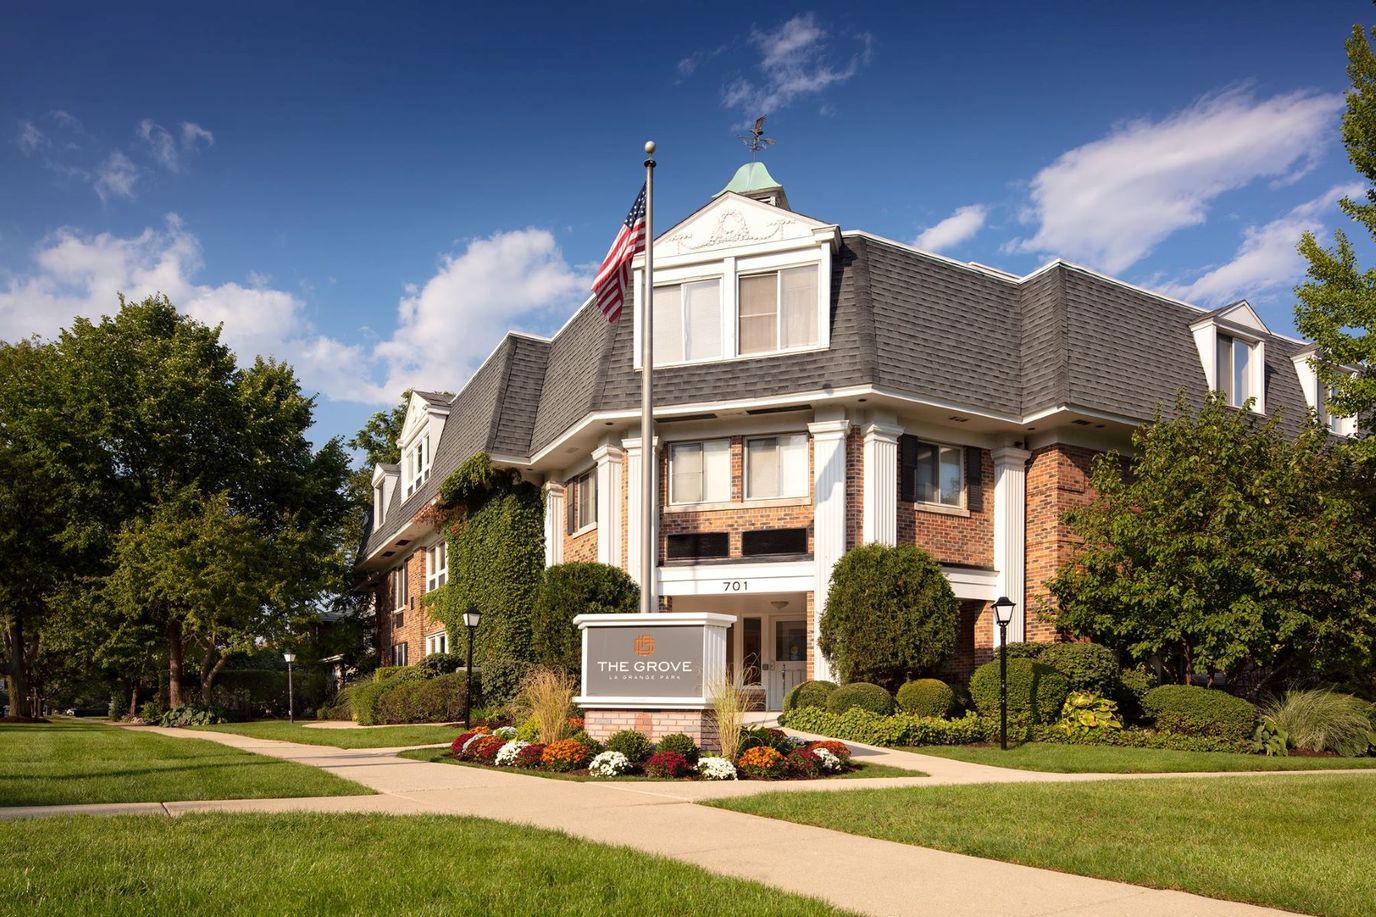
Situated at 701 North La Grange Road in La Grange Park, Illinois, The Grove operates as a 131-bed skilled nursing home under the ownership of Marie Derzsy. The facility serves Medicare, Medicaid, and private-pay residents and maintains 85.8% occupancy, substantially exceeding the Illinois average of 69.3%. Residents typically stay 81 days on average.

The facility carries a 3-star overall CMS rating (19.0% above state), with 3-star health inspection (8.1% above state) and 3-star staffing ratings (40.4% above state).

Staffing strengths concentrate in registered nurse coverage: 1 hour 3 minutes daily per resident exceeds state average by 43%, while weekend RN coverage at 53 minutes daily runs 56% above state norms. Conversely, licensed practical nurse hours total 16 minutes daily; 58% below state benchmark, and total adjusted nursing hours (2 hours 40 minutes) fall 14% below state average. Staff-to-resident ratio of 1.24:1 underperforms the state standard of 1.80:1 by 31%.

Payroll consumes 35.3% of revenue, well below the 54–67% range of well-managed facilities.

Quality Measures rate 3 stars, 6.6% above state average.

Functional decline scores outperform state benchmarks by 42%. Urinary tract infection rates run 69% below state levels, and falls with major injury show 17% improvement over peers.

Conversely, long-stay residents report depressive symptoms at 99.1%; more than double the state average of 48.1%. Long-stay hospitalization rates of 3.67 per 1,000 resident days exceed state norms by 79%. Short-stay pneumococcal vaccination lags state rates at 45.7% versus 68.3% state average.

Federal penalties total zero dollars with no fines in three years. The facility recorded one payment denial.

Financial operations show an operating loss of $1.4 million with profit margin declining to negative 6.5%.

Located 16.4 miles from Chicago and 2.93 miles from Maguire Center Hospital, the facility sits in a moderately walkable area with a walk score of 67.

The Grove maintains high-performing regulatory ratings and selected clinical strengths alongside critical mental health outcome deficiencies and significant financial strain despite strong occupancy performance.

Quality ratings

Measured by Centers for Medicare & Medicaid Services (CMS)

Overall rating Info The Overall CMS Rating combines results from health inspections, staffing levels and quality measures. Health inspections carry the most weight. Staffing and quality scores can increase or decrease the final rating based on performance compared to state and national standards.
▲ 19.0% Above IL avg. ▲ 19.0% Above IL avg.IL average: 2.5Click the badge to see the full State ranking.Click here to see the full State ranking.
Health Inspection Info Based on the results of the facility's three most recent standard inspections and any complaint investigations. CMS reviews the number, scope, and severity of deficiencies, with more recent findings weighted more heavily.
▲ 8.1% Above IL avg. ▲ 8.1% Above IL avg.IL average: 2.8Click the badge to see the full State ranking.Click here to see the full State ranking.
Staffing Info Measures average nursing staff hours per resident per day, including Registered Nurses (RNs) and total nursing staff. Ratings are adjusted based on the level of care residents require and are compared to state and national benchmarks.
▲ 40.4% Above IL avg. ▲ 40.4% Above IL avg.IL average: 2.1Click the badge to see the full State ranking.Click here to see the full State ranking.
Quality Measures Info Based on clinical and physical health indicators reported to CMS, such as hospital readmissions, falls, pressure ulcers, and improvements in mobility. These measures reflect how well residents' health needs are being managed.
▲ 42.1% Above IL avg. ▲ 42.1% Above IL avg.IL average: 2.8Click the badge to see the full State ranking.Click here to see the full State ranking.

Staffing hours breakdown

Info Daily nursing hours per resident by staff type, reported to CMS. Higher is generally better — compare this facility to state and national averages to see where staffing stands.

Hours per resident per day — compared to Illinois state averages

Total nursing care / resident Info This home is ranked 103rd out of 172 homes in Illinois for nurse hours. Total adjusted nursing hours per resident per day, combining RN, LPN, and aide time. CMS adjusts this for case-mix so facilities can be fairly compared.
2h 40m per day
Rank #103 / 172Nurse hours — State benchmarkedThis home is ranked 103rd out of 172 homes in Illinois. Shows adjusted nurse hours per resident per day benchmarked to the Illinois average, with a ranking across 172 Illinois facilities. More hours mean more direct care. The national average is about 3.5 hrs; below 3.0 is a red flag.Rankings are based only on facilities in Illinois that report data for that category. Facilities without available data are excluded from the ranking.Click the rank badge to see the full State ranking.Click here to see the full State ranking.
This facility Illinois avg (3h 6m per day)
vs Illinois avg
-14%

4 of 6 metrics below state avg

Standout metric Weekend RN is +57% above state avg
Staff typeHours / Day / Residentvs state avg
Registered Nurse (RN) Info RNs hold the highest nursing license and can assess residents, interpret test results, and direct care plans. More RN hours per day often signals stronger clinical oversight and faster response to health changes. 59m per day ▲ 35% State avg: 44m per day · National avg: 41m per day
LPN / LVN Info Licensed Practical Nurses (LPNs) or Licensed Vocational Nurses (LVNs) deliver routine hands-on care — medication administration, wound dressing, and monitoring vital signs. They work under RN supervision and make up a large share of daily bedside care. 17m per day ▼ 55% State avg: 38m per day · National avg: 52m per day
Nurse Aide Info Certified Nurse Aides (CNAs) provide the most direct day-to-day assistance: bathing, dressing, feeding, and mobility. Nurse aide hours are typically the largest staffing category and directly affect residents' quality of life. 1h 48m per day ▼ 15% State avg: 2h 8m per day · National avg: 2h 21m per day
Weekend Total Nursing Info Combined nursing hours (RN + LPN + Nurse Aide) per resident per day on weekends. Staffing often drops on weekends — this figure reveals whether the facility maintains adequate coverage outside of weekday hours. 2h 57m per day ▼ 4% State avg: 3h 5m per day · National avg: 3h 26m per day
Physical Therapist Info Hours per resident per day provided by licensed Physical Therapists (PTs) or PT Assistants. PT services help residents recover mobility after injury or illness and are especially important for post-acute (short-stay) rehabilitation. 2m per day ▼ 18% State avg: 3m per day · National avg: 4m per day
Weekend RN Info Registered nurse hours specifically on weekends. Facilities sometimes reduce RN presence on Saturdays and Sundays — a low weekend RN figure compared to weekday hours can indicate reduced clinical oversight when most administrative staff are absent. 53m per day ▲ 57% State avg: 34m per day · National avg: 29m per day

Capacity and availability

This home usually has limited availability

Higher occupancy than the Illinois average: 69.3%
Occupancy rate
85.8% Rank #52 / 204Occupancy rate — State benchmarkedThis home is ranked 52nd out of 204 homes in Illinois. Shows this facility's occupancy rate versus the Illinois average, with its Statewide rank out of 204. Higher occupancy signals strong local demand and financial stability.Rankings are based only on facilities in Illinois that report data for that category. Facilities without available data are excluded from the ranking.Click the rank badge to see the full State ranking.Click here to see the full State ranking.
Avg. Length of Stay
81 days
Bed community size
131-bed community Rank #70 / 426Bed count — State benchmarkedThis home is ranked 70th out of 426 homes in Illinois. Shows this facility's certified or reported bed count compared to other Illinois facilities. Larger communities may offer more amenities, programs, and on-site services for residents and families.Rankings are based only on facilities in Illinois that report data for that category. Facilities without available data are excluded from the ranking.Click the rank badge to see the full State ranking.Click here to see the full State ranking.
A larger shared setting that may offer more common spaces and organized community services.
Walk Score
Walk Score: 67 / 100 Rank #177 / 648Walk Score — State benchmarkedThis home is ranked 177th out of 648 homes in Illinois. Shows how walkable this facility's neighborhood is compared to the average Walk Score across Illinois facilities. Higher scores benefit residents, families, and staff.Rankings are based only on facilities in Illinois that report data for that category. Facilities without available data are excluded from the ranking.Click the rank badge to see the full State ranking.Click here to see the full State ranking.
Moderately walkable. Some errands can be accomplished on foot, with a mix of nearby amenities.

Contact The Grove La Grange Park

Staffing Data

Reporting period: October 1 – December 31, 2025 (Q4 2025). Source: CMS Payroll-Based Journal report.

Total staff 144
Employees 99
Contractors 45
Staff to resident ratio 1.24 : 1
31% fewer staff per resident than Illinois average
Illinois average ratio: 1.80 : 1 Illinois average ratio: 1.80 : 1See full Illinois ranking
Avg staff/day 57
Average shift 7.5 hours
0% compared with Illinois average
Illinois average: 7.6 hours Illinois average shift: 7.6 hoursSee full Illinois ranking
Total staff hours (quarter) 39,357

Nursing staff breakdown

Q4 2025 · Oct 1 – Dec 31 More info This data comes from the CMS Payroll-Based Journal report covering October 1 – December 31, 2025.
Registered Nurse

Manages medical care and health needs.

RN Staff Info All 20 RN Staff are full-time employees. No contractors work on this role. 20
Average shift length Info Average shift length. Calculated as total hours divided by days worked and average staff per day. 8.8 hours
Licensed Practical Nurse

Assists with medical care and medications.

LPN Staff Info All 5 LPN Staff are full-time employees. No contractors work on this role. 5
Average shift length Info Average shift length. Calculated as total hours divided by days worked and average staff per day. 7.9 hours
Certified Nursing Assistant

Helps with daily care and mobility.

CNA Staff Info 80 total: 59 full-time employees and 21 contractors. 80
Average shift length Info Average shift length. Calculated as total hours divided by days worked and average staff per day. 7.7 hours

Contractor staffing

Q4 2025 · Oct 1 – Dec 31 More info This data comes from the CMS Payroll-Based Journal report covering October 1 – December 31, 2025.

Total hours from contractors

8%

3,129 contractor hours this quarter

Certified Nursing Assistant: 21 Respiratory Therapy Technician: 9 Speech Language Pathologist: 5 Qualified Social Worker: 4 Physical Therapy Assistant: 3 Physical Therapy Aide: 3

Staff by category

Q4 2025 · Oct 1 – Dec 31 More info This data comes from the CMS Payroll-Based Journal report covering October 1 – December 31, 2025.
Certified Nursing Assistant59218019,44692100%7.7
Registered Nurse200208,76892100%8.8
Licensed Practical Nurse5052,08292100%7.9
Clinical Nurse Specialist3031,3609098%6.2
Other Dietary Services Staff3031,22992100%7.2
RN Director of Nursing2021,0009098%5.7
Physical Therapy Aide0339807480%7.8
Speech Language Pathologist0558228390%6.8
Physical Therapy Assistant0336088289%7.4
Nurse Practitioner3035118795%5.7
Administrator1015089098%5.6
Dental Services Staff1015089098%5.6
Mental Health Service Worker1014928896%5.6
Dietitian1014688592%5.5
Respiratory Therapy Technician0994446773%6.1
Qualified Social Worker0441343538%3.8
80 Certified Nursing Assistant
% of Days 100%
20 Registered Nurse
% of Days 100%
5 Licensed Practical Nurse
% of Days 100%
3 Clinical Nurse Specialist
% of Days 98%
3 Other Dietary Services Staff
% of Days 100%
2 RN Director of Nursing
% of Days 98%
3 Physical Therapy Aide
% of Days 80%
5 Speech Language Pathologist
% of Days 90%
3 Physical Therapy Assistant
% of Days 89%
3 Nurse Practitioner
% of Days 95%
1 Administrator
% of Days 98%
1 Dental Services Staff
% of Days 98%
1 Mental Health Service Worker
% of Days 96%
1 Dietitian
% of Days 92%
9 Respiratory Therapy Technician
% of Days 73%
4 Qualified Social Worker
% of Days 38%

Penalties and fines

Federal penalties imposed by CMS for regulatory violations, including civil money penalties (fines) and denials of payment for new Medicare/Medicaid admissions.

Source: CMS Penalties Database (Data as of Jan 2026)

Total fines amount $0 Rank #1 / 173Federal fines — State benchmarkedThis home is ranked 1st out of 173 homes in Illinois. Shows this facility's cumulative CMS federal fine dollars versus the Illinois average among facilities with fines, and where it ranks among 173 facilities in the pool. Lower total dollars mean a better rank.Rankings are based only on facilities in Illinois that report data for that category. Facilities without available data are excluded from the ranking.Click the rank badge to see the full State ranking.Click here to see the full State ranking.
100% lower than Illinois average

Illinois average: $143K

Number of fines 0
100% fewer fines than Illinois average

Illinois average: 3.0

Payment Denials Info Serious action where Medicare and/or Medicaid temporarily stops payments for new residents until issues are fixed. 1
6% fewer payment denials than Illinois average

Illinois average: 1.1

Fines amount comparison
This facility $0
Illinois average $143K

No penalties in the past 3 years

No civil money penalties or payment denials were reported in the last 3 years.

Quality of care over time

These measures show how residents usually do over time at this home, based on health outcomes and preventive care.

High-risk clinical events score Info A composite score based on pressure ulcers, falls with injury, weight loss, walking ability decline, and activities of daily living decline. 8.5
12% better than Illinois average

Illinois average: 9.7

Functional decline score Info A composite score based on activities of daily living decline, walking ability decline, and incontinence. 10.8
42% better than Illinois average

Illinois average: 18.6

Long-stay resident measures
Above average Illinois avg: 3.6 Info CMS star rating based on long-stay quality measure performance. 5 stars = significantly above average, 1 star = significantly below average.
Need for Help with Daily Activities Increased Info Percent of long-stay residents whose need for help with daily activities has increased 11.6%
25% better than Illinois average

Illinois average: 15.5%

Walking Ability Worsened Info Percent of long-stay residents whose ability to move independently worsened 14.5%
21% better than Illinois average

Illinois average: 18.4%

Low Risk Residents with Bowel/Bladder Incontinence Info Percent of low risk long-stay residents who lose control of their bowels or bladder 6.4%
70% better than Illinois average

Illinois average: 21.6%

Falls with Major Injury Info Percent of long-stay residents experiencing one or more falls with major injury 2.8%
17% better than Illinois average

Illinois average: 3.4%

High Risk Residents with Pressure Ulcers Info Percent of long-stay high risk residents with pressure ulcers 5.1%
In line with Illinois average

Illinois average: 5.3%

Urinary Tract Infection Info Percent of long-stay residents with a urinary tract infection 0.6%
69% better than Illinois average

Illinois average: 1.8%

Lost Too Much Weight Info Percent of long-stay residents who lose too much weight 8.8%
35% worse than Illinois average

Illinois average: 6.5%

Depressive Symptoms Info Percent of long-stay residents who have depressive symptoms 99.1%
106% worse than Illinois average

Illinois average: 48.1%

Antipsychotic Use Info Percent of long-stay residents who received an antipsychotic medication 13.4%
34% better than Illinois average

Illinois average: 20.2%

Pneumococcal Vaccine Info Percent of long-stay residents assessed and appropriately given the pneumococcal vaccine 91.4%
In line with Illinois average

Illinois average: 89.2%

Influenza Vaccine Info Percent of long-stay residents assessed and appropriately given the seasonal influenza vaccine 88.1%
In line with Illinois average

Illinois average: 91.6%

Hospitalizations per 1,000 days Info Number of hospitalizations per 1,000 long-stay resident days. 3.67
79% worse than Illinois average

Illinois average: 2.05

ED visits per 1,000 days Info Number of outpatient emergency department visits per 1,000 long-stay resident days. 0.88
61% better than Illinois average

Illinois average: 2.25

Short-stay resident measures
Above average Illinois avg: 2.3 Info CMS star rating based on short-stay quality measure performance. 5 stars = much above average, 1 star = much below average.
Pneumococcal Vaccine Info Percent of short-stay residents assessed and appropriately given the pneumococcal vaccine 45.7%
33% worse than Illinois average

Illinois average: 68.3%

Antipsychotic medication increase Info Percent of short-stay residents who newly received an antipsychotic medication 1.2%
48% better than Illinois average

Illinois average: 2.3%

Influenza Vaccine Info Percent of short-stay residents assessed and appropriately given the seasonal influenza vaccine 57.1%
9% worse than Illinois average

Illinois average: 63.0%

Re-hospitalized after SNF stay Info Percentage of short-stay residents who were re-hospitalized after their nursing home admission. 20.2%
23% better than Illinois average

Illinois average: 26.2%

Emergency department visits Info Percentage of short-stay residents who had an outpatient emergency department visit. 4.6%
67% better than Illinois average

Illinois average: 14.0%

Falls with major injury Info Percentage of SNF residents who experience falls with major injury during their stay. 0.8%
5% worse than Illinois average

Illinois average: 0.8%

Ability to care for self at discharge Info Percentage of residents at or above expected ability to care for themselves at discharge. 46.5%
13% worse than Illinois average

Illinois average: 53.7%

Successful return to home or community Info Rate of successful return to home or community from a skilled nursing facility. 51.0%
In line with Illinois average

Illinois average: 50.6%

Breakdown by payment type

Medicare

28% of new residents, usually for short-term rehab.

Typical stay 1 - 2 months

Private pay

60% of new residents, often for short stays.

Typical stay 3 months

Medicaid

12% of new residents, often for long-term daily care.

Typical stay 5 - 6 months

Facility Characteristics

Source: CMS Long-Term Care Facility Characteristics (Data as of Jan 2026)

Total residents 116
Medicare
15
12.9% of residents
Medicaid
63
54.3% of residents
Private pay or other
38
32.8% of residents
Programs & Services
Residents Group

Residents meet regularly to discuss policies, care quality, and activities

Active Resident Council

Organized group of residents that meets regularly to discuss facility policies, quality of life, and activities.

Finances and operations

Based on CMS SNF Cost Report for fiscal year ending in 12/2023.

For-profit
Corporation
Net patient revenue Info Net patient revenue — what the home actually collects for resident care, after contractual allowances, bad debt and discounts are subtracted from its gross charges (CMS cost report, Worksheet G-3). It covers resident care only; money the home earns from other sources is shown separately as "Other income."
$13.0M
Net patient income Info Net patient income: net patient revenue minus the home's total operating expenses. A positive figure means it earns more from resident care than it spends to deliver it; a negative figure means the opposite. It excludes non-operating "other income."
-$1.8M
For-profit Corporation
Net patient revenue Info Net patient revenue — what the home actually collects for resident care, after contractual allowances, bad debt and discounts are subtracted from its gross charges (CMS cost report, Worksheet G-3). It covers resident care only; money the home earns from other sources is shown separately as "Other income."
$13.0M Rank #52 / 171Revenue — State benchmarkedThis home is ranked 52nd out of 171 homes in Illinois. Shows this facility's annual revenue compared to the Illinois average. Higher revenue generally means more resources for staffing and capital — read alongside Payroll %.Rankings are based only on facilities in Illinois that report data for that category. Facilities without available data are excluded from the ranking.Click the rank badge to see the full State ranking.Click here to see the full State ranking.
Net patient income Info Net patient income: net patient revenue minus the home's total operating expenses. A positive figure means it earns more from resident care than it spends to deliver it; a negative figure means the opposite. It excludes non-operating "other income."
-$1.8M
Other income Info Money the home earns outside of resident care — such as investments, grants, rentals and other non-operating sources (CMS cost report, Worksheet G-3). It is tracked separately from net patient revenue: it is not part of that figure, and it is not included in net patient income.
$407.5K
Payroll costs Info Staff salaries plus wage-related costs — benefits such as payroll taxes, health insurance and retirement — from the home's own accounting records (CMS cost report, Worksheet A). Contract or agency labor is counted separately, under other operating costs. Rank #79 / 171Payroll — State benchmarkedThis home is ranked 79th out of 171 homes in Illinois. Shows total annual staff payroll benchmarked to the Illinois average. Higher payroll investment relative to peers often signals better staffing and less reliance on cheaper contract labor.Rankings are based only on facilities in Illinois that report data for that category. Facilities without available data are excluded from the ranking.Click the rank badge to see the full State ranking.Click here to see the full State ranking.
$6.0M 46.6% of net patient revenue Info Payroll as a share of revenue: staff salaries and wage-related benefits divided by net patient revenue. A higher figure means more of each revenue dollar goes to staff pay. Rank #144 / 171Payroll % — State benchmarkedThis home is ranked 144th out of 171 homes in Illinois. Shows payroll as a percentage of revenue versus the Illinois average. Well-run Illinois facilities typically land around 54–67% — the top third Statewide. Below 25% may signal understaffing or heavy agency use — read with Staffing ratings.Rankings are based only on facilities in Illinois that report data for that category. Facilities without available data are excluded from the ranking.Click the rank badge to see the full State ranking.Click here to see the full State ranking.
Other operating costs Info Everything it costs to run the home apart from payroll — food, utilities, supplies, maintenance, contract labor and administration. Calculated as total operating expense minus payroll (staff salaries and wage-related benefits).
$8.7M
Total costs Info The home's total operating expense for the year — all the costs of running it, salaries included (CMS cost report, Worksheet G-3).
$14.7M

Who this home usually serves

TYPE OF STAY

Primarily short stays

Residents typically stay for brief periods, with frequent admissions and discharges throughout the year.

Most new residents arrive under private pay (60% of admissions), and a typical private pay stay runs around 3 months.

Admissions
480 total

Coverage residents most often arrive under.

Medicare 28%
Private pay 60%
Medicaid 12%
Discharges
504 total

Coverage residents most often leave under.

Medicare 21%
Private pay 59%
Medicaid 20%

Places of interest near The Grove La Grange Park

Address 16.4 miles from city center Info Estimated distance in miles from La Grange Park's city center to The Grove La Grange Park's address, calculated via Google Maps.

Calculate Travel Distance to The Grove La Grange Park

Add your location

Address

Compare Nursing Homes around Chicago

The information below is reported by the Illinois Department of Public Health, Office of Health Care Regulation.

5 facilities compared · CMS & IL Dept. of Health data

The Selfhelp Home Senior Living Community
NH
AL
IL
RC
Chicago (Uptown)
72
Facility 72
IL AVG 86
Rank #209 / 426
81.9%
Facility 81.9%
IL AVG 69.3%
Rank #74 / 204
+18%
5.56
Facility 5.56
IL AVG 3.10
Rank #8 / 172
+44%+79%
$0
Facility $0
IL AVG $151.3k
Rank #1 / 173
21
Facility 21
IL AVG 36.8
Rank #45 / 172
5.3
Facility 5.3
IL AVG 3.7
Rank #154 / 172
155A+
92
Facility 92
IL AVG 51
Rank #28 / 648
Marvin Rubin
$9.3M
Facility $9.3M
IL AVG $12.2M
Rank #78 / 171
$7.0M
Facility $7.0M
IL AVG $4.8M
Rank #73 / 171
75.3%
Facility 75.3%
IL AVG 44.3%
Rank #70 / 171
146009
Encore Village of Schaumburg
NH
AL
IL
MC
Schaumburg
109
Facility 109
IL AVG 86
Rank #108 / 426
55.4%
Facility 55.4%
IL AVG 69.3%
Rank #169 / 204
-20%
3.46
Facility 3.46
IL AVG 3.10
Rank #54 / 172
+8%+12%
$25.5k
Facility $25.5k
IL AVG $151.3k
Rank #94 / 173
28
Facility 28
IL AVG 36.8
Rank #69 / 172
2.6
Facility 2.6
IL AVG 3.7
Rank #28 / 172
2105A+
58
Facility 58
IL AVG 51
Rank #253 / 648
Il Ccrc, LLC
$16.2M
Facility $16.2M
IL AVG $12.2M
Rank #1 / 171
$15.9M
Facility $15.9M
IL AVG $4.8M
Rank #4 / 171
98.3%
Facility 98.3%
IL AVG 44.3%
Rank #171 / 171
145341
The Grove La Grange Park
NH
MC
PC
La Grange Park
131
Facility 131
IL AVG 86
Rank #70 / 426
85.8%
Facility 85.8%
IL AVG 69.3%
Rank #52 / 204
+24%
2.66
Facility 2.66
IL AVG 3.10
Rank #103 / 172
-2%-14%
$0
Facility $0
IL AVG $151.3k
Rank #1 / 173
29
Facility 29
IL AVG 36.8
Rank #73 / 172
3.2
Facility 3.2
IL AVG 3.7
Rank #64 / 172
1117-
67
Facility 67
IL AVG 51
Rank #177 / 648
Marie Derzsy
$13.0M
Facility $13.0M
IL AVG $12.2M
Rank #52 / 171
$6.0M
Facility $6.0M
IL AVG $4.8M
Rank #79 / 171
46.6%
Facility 46.6%
IL AVG 44.3%
Rank #144 / 171
145307
Smith Village
NH
AL
IL
MC
Chicago (South Side)
82
Facility 82
IL AVG 86
Rank #171 / 426
85.4%
Facility 85.4%
IL AVG 69.3%
Rank #57 / 204
+23%
5.28
Facility 5.28
IL AVG 3.10
Rank #10 / 172
+4%+70%
$0
Facility $0
IL AVG $151.3k
Rank #1 / 173
20
Facility 20
IL AVG 36.8
Rank #42 / 172
3.3
Facility 3.3
IL AVG 3.7
Rank #69 / 172
466A+
71
Facility 71
IL AVG 51
Rank #147 / 648
The Washington And Jane Smith Home
$11.0M
Facility $11.0M
IL AVG $12.2M
Rank #31 / 171
$8.0M
Facility $8.0M
IL AVG $4.8M
Rank #24 / 171
72.5%
Facility 72.5%
IL AVG 44.3%
Rank #108 / 171
145904
Montgomery Place
NH
AL
IL
MC
Chicago (East Hyde Park)
40
Facility 40
IL AVG 86
Rank #350 / 426
35.0%
Facility 35.0%
IL AVG 69.3%
Rank #189 / 204
-49%
4.00
Facility 4.00
IL AVG 3.10
Rank #42 / 172
+31%+29%
$51.6k
Facility $51.6k
IL AVG $151.3k
Rank #107 / 173
30
Facility 30
IL AVG 36.8
Rank #79 / 172
4.3
Facility 4.3
IL AVG 3.7
Rank #132 / 172
114A+
82
Facility 82
IL AVG 51
Rank #98 / 648
Margo Brooks Pugh
$13.8M
Facility $13.8M
IL AVG $12.2M
Rank #70 / 171
$6.9M
Facility $6.9M
IL AVG $4.8M
Rank #69 / 171
49.7%
Facility 49.7%
IL AVG 44.3%
Rank #86 / 171
145748

Financial Assistance for
Nursing Home in Illinois

The Grove La Grange Park is located in La Grange Park, Illinois.
Here are the financial assistance programs available to residents in Illinois.

Get Financial aid guidance

Community Care Program

Illinois CCP

Age 60+
General Illinois resident, at risk of nursing home placement.
Income Limits (2025) ~$1,215/month individual
Asset Limits $17,500 individual, excludes home, car
IL

High demand in urban areas; waitlists possible.

Benefits
In-home care (3-5 hours/day) Adult day services ($65/day) Emergency home response systems ($30/month)

Illinois Respite Program

IL Respite (via NFCSP)

Age Caregiver of someone 60+ (or with dementia)
General Illinois resident.
Income Limits No strict limit; prioritizes low-income.
Asset Limits Not applicable.
IL

Limited slots; urban/rural balance.

Benefits
In-home respite (4-6 hours/day) Adult day care (~$65/day) Short-term facility care (up to 5 days)

Supportive Living Program (SLP)

Illinois Medicaid Supportive Living Program

Age 65+ or 22-64 with disability
General Illinois resident, Medicaid-eligible, needs moderate assistance (not nursing home-level).
Income Limits (2025) ~$2,829/month (300% FBR, individual); QIT allowed.
Asset Limits $2,000 (individual), $3,000 (couple) (excludes home, car).
IL

~200 SLP sites statewide; room/board not covered.

Benefits
Personal care (5-7 hours/day, e.g., bathing, mobility) Meals Housekeeping Medication management Respite (~240 hours/year)

Persons Who Are Elderly Waiver

Illinois Medicaid Elderly Waiver

Age 65+
General Illinois resident, Medicaid-eligible, nursing home-level care need.
Income Limits (2025) ~$2,829/month 300% FBR, individual
Asset Limits $2,000 (individual), $3,000 (couple).
IL

Part of HealthChoice Illinois; consumer-directed options available.

Benefits
Personal care (5-7 hours/day, e.g., dressing, eating) Homemaker Adult day care (~$60/day) Respite (240 hours/year) Home mods ($1,000 avg.)

Medicare Savings Program (MSP)

Illinois Medicare Savings Program

Age 65+ or disabled
General Illinois resident, Medicare Part A/B.
Income Limits (2025) ~$2,510/month (QMB), ~$3,380/month (SLMB), ~$3,598/month (QI)—individual.
Asset Limits $9,430 (individual), $14,130 (couple).
IL

Three tiers; no waitlist.

Benefits
Covers Part B premiums ($174.70/month) Deductibles ($240/year) Copays (~20%)

Optional State Supplementation (OSS)

Illinois Optional State Supplementation

Age 65+ or disabled
General Illinois resident, in approved facility, SSI recipient or low-income.
Income Limits (2025) ~$1,004/month including SSI
Asset Limits $2,000 (individual), $3,000 (couple).
IL

~$50-$500/month based on facility type.

Benefits
Cash (~$50-$500/month) for room/board in personal care homes or SLFs

VA Aid and Attendance (A&A) and Housebound Benefits

Illinois VA Aid and Attendance/Housebound

Age 65+ or disabled veteran/spouse
General Illinois resident, wartime service, need for ADL help (A&A) or homebound.
Income Limits (2025) Net income < ~$1,984/month (veteran with dependent, A&A); pension offsets income.
Asset Limits ~$155,356 net worth limit
IL

High veteran demand in urban/rural areas.

Benefits
Cash (~$1,433-$2,642/month veteran, ~$951-$1,318 spouse) for care costs (e.g., in-home, assisted living)

Frequently Asked Questions about The Grove La Grange Park

What neighborhood is The Grove La Grange Park in?

The Grove La Grange Park is in the La Grange Park neighborhood.

Is The Grove La Grange Park in a walkable area?

The Grove La Grange Park has a walk score of 67. Moderately walkable. Some errands can be accomplished on foot, with a mix of nearby amenities.

What is the occupancy rate at The Grove La Grange Park?

The Grove La Grange Park's occupancy is 85.8%.

Does The Grove La Grange Park operate as a for-profit or non-profit?

The Grove La Grange Park is registered as a for-profit.

Are there photos of The Grove La Grange Park?

Yes — there are 4 photos of The Grove La Grange Park in the photo gallery on this page.

What is the address of The Grove La Grange Park?

The Grove La Grange Park is located at 701 N La Grange Rd, La Grange Park, IL 60526.

What is the phone number of The Grove La Grange Park?

(708) 354-7300 will put you in contact with the team at The Grove La Grange Park.

Guides for Better Senior Living

Care Cost Calculator: See Prices in Your Area

Nursing Home Data Explorer

Don’t Wait Too Long: 7 Red Flag Signs Your Parent Needs Assisted Living Now

The True Cost of Assisted Living in 2025 – And How Families Are Paying For It

Understanding Senior Living Costs: Pricing Models, Discounts & Financial Assistance