Explore Open Rooms

1 Contact details
2 What type of senior care service are you looking for?
3 What budget do you have in mind for senior care?
4 How soon do you need to find care?
5 Additional details

Thank you for your interest!

Our team will be in touch shortly to help with next steps.

Nursing Home in East Setauket

CMS overall rating Info The Overall CMS Rating combines results from health inspections, staffing levels and quality measures. Health inspections carry the most weight. Staffing and quality scores can increase or decrease the final rating based on performance compared to state and national standards.

The Hamlet Rehabilitation and Healthcare Center at Nesconset

100 Southern Blvd, Nesconset, NY 11767 View map
Overview of The Hamlet Rehabilitation and Healthcare Center at Nesconset

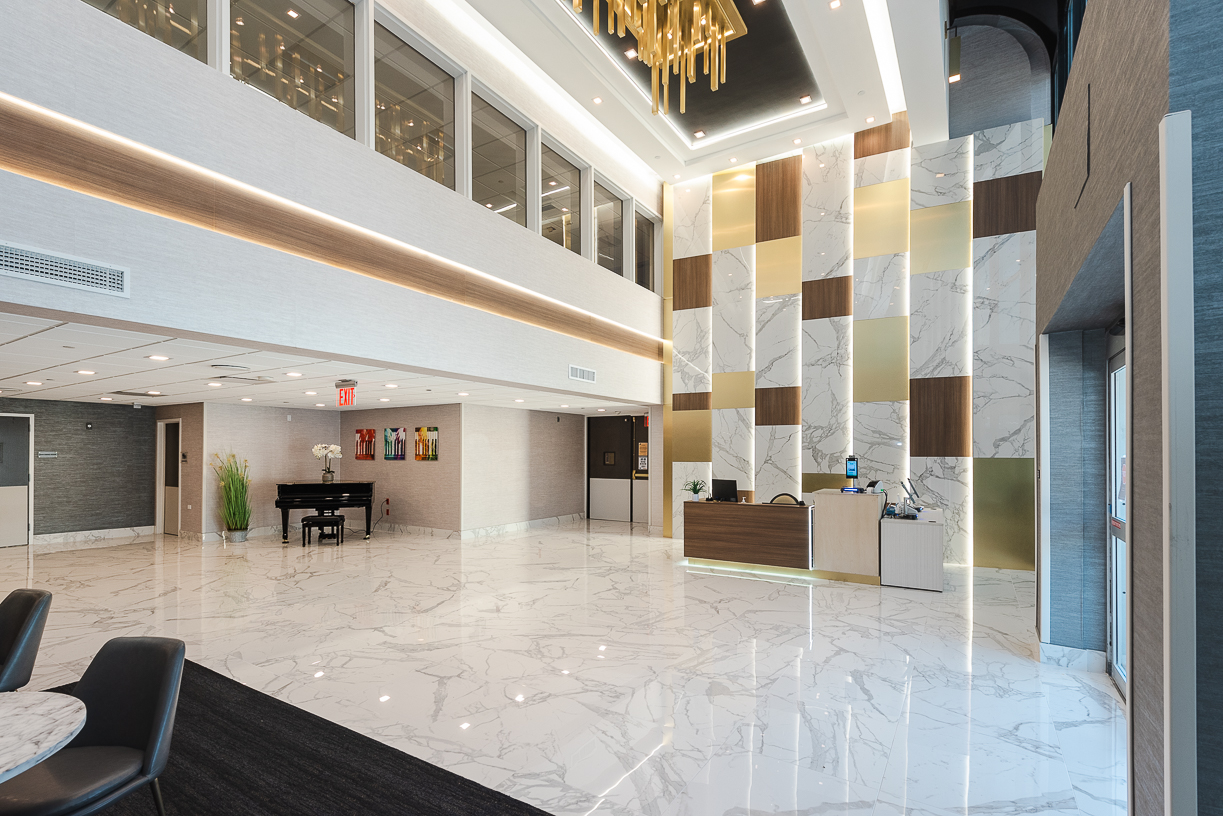
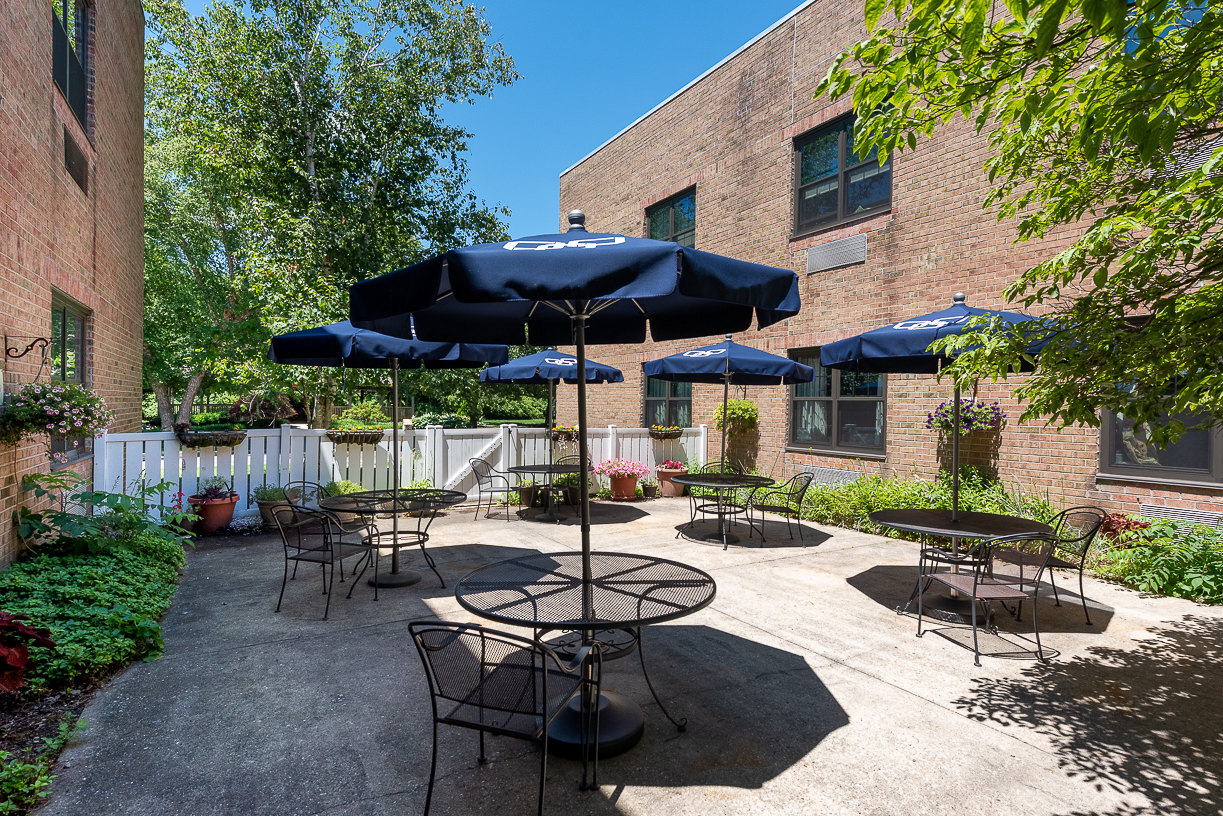
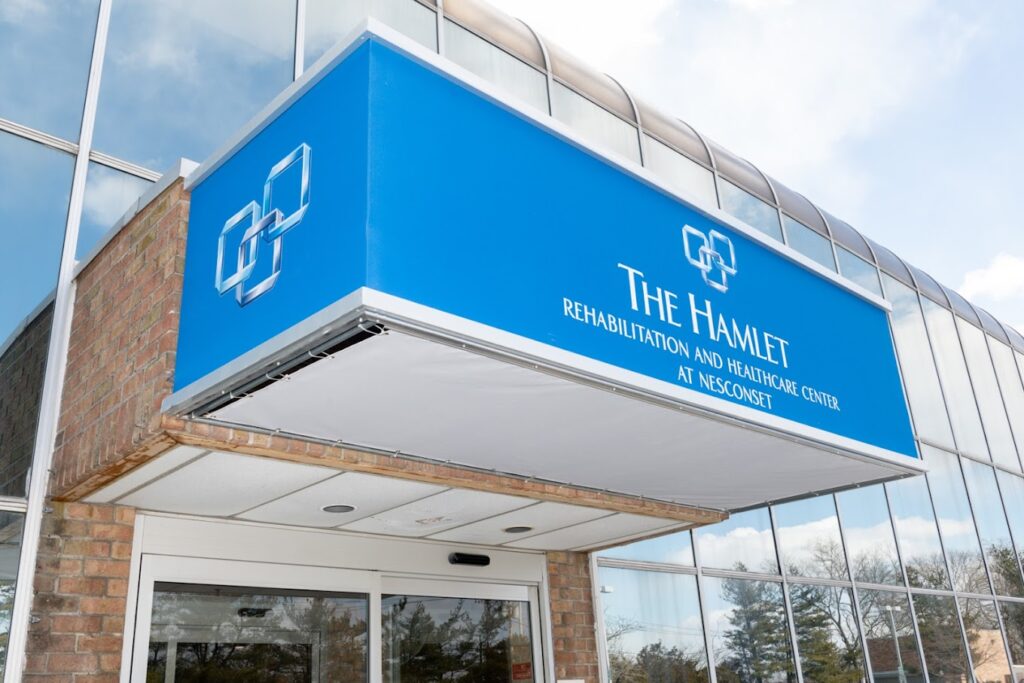
Conveniently located in Nesconset, NY, The Hamlet Rehabilitation and Healthcare Center at Nesconset is a premiere senior care provider that offers skilled nursing and rehabilitation services. The community ensures residents receive unmatched care and support with their daily living activities or recovery process by providing an exceptional team of care professionals trained to deliver an array of services. Bright and modern accommodations are offered to provide residents a comfortable healing environment that fosters quick recovery.

Dedicated to helping residents focus solely on their recovery, the community also handles the housekeeping and laundry. Fine dining with delicious and nutritious meals are offered with coffee and snacks available throughout the day to make sure residents are always full. Here, residents are guaranteed to receive all the support and services they need to recover quickly and successfully.

(631) 361-8800

Managed by Stephanie Malone, MA, LNHA

Administrator

Stephanie Malone, MA, LNHA, serves as the Administrator at The Hamlet Rehabilitation and Healthcare Center at Nesconset. She leads a dedicated team focused on compassionate care, ensuring patients’ well-being and fostering a positive environment that supports healing through kindness and professionalism.

Quality ratings

Measured by Centers for Medicare & Medicaid Services (CMS)

Overall rating Info The Overall CMS Rating combines results from health inspections, staffing levels and quality measures. Health inspections carry the most weight. Staffing and quality scores can increase or decrease the final rating based on performance compared to state and national standards.
5/5
New York average: 3.1/5
Health Inspection Info Based on the results of the facility's three most recent standard inspections and any complaint investigations. CMS reviews the number, scope, and severity of deficiencies, with more recent findings weighted more heavily.
4/5
New York average: 2.8/5
Staffing Info Measures average nursing staff hours per resident per day, including Registered Nurses (RNs) and total nursing staff. Ratings are adjusted based on the level of care residents require and are compared to state and national benchmarks.
2/5
New York average: 2.7/5
Quality Measures Info Based on clinical and physical health indicators reported to CMS, such as hospital readmissions, falls, pressure ulcers, and improvements in mobility. These measures reflect how well residents' health needs are being managed.
5/5
New York average: 4.0/5

Nursing care per resident

Info This shows how many total hours of nursing staff time are available per resident each day. Higher numbers usually mean more staff support.
2h 50m per day

This home provides 19% less nursing time per resident than the New York average.

New York average: 3h 29m per day

Staffing hours breakdown

Info Hours of care per resident per day, broken down by staff type. Data from CMS Medicare.
Staff type Facility State avg National avg
Registered Nurse (RN) Info Registered nurse hours per resident per day. 32m per day 42m per day 41m per day
Nurse Aide Info Nurse aide hours per resident per day. 1h 59m per day 2h 11m per day 2h 21m per day
Total Nursing (Weekend) Info Total number of nurse staff hours per resident per day on weekends. 2h 46m per day 3h 10m per day 3h 26m per day
Physical Therapist Info Physical therapist staff hours per resident per day. 10m per day 7m per day 4m per day
RN (Weekend) Info Registered nurse hours per resident per day on weekends. 17m per day 28m per day 29m per day

Capacity and availability

High-capacity home

May provide extensive amenities, services and programs.

Total beds 240

This home usually has limited availability

Occupancy is moderate, suggesting balanced demand.

Similar demand to the New York average
Occupancy rate 92.1%
Residents per day (avg) 235
Occupancy rate
92.1%
Residents per day (avg)
235

Who this home usually serves

TYPE OF STAY

Mostly short-term rehab stays

Most residents typically stay for a few weeks or months before returning home or moving on.

Might be optimal for
Short stays Recovery Medicare-covered care

Breakdown by payment type

Medicare

69% of new residents, usually for short-term rehab.

Typical stay 1 - 2 months

Private pay

15% of new residents, often for short stays.

Typical stay 3 - 4 months

Medicaid

16% of new residents, often for long-term daily care.

Typical stay 11 - 12 months

Finances and operations

Privately-owned community
Operated by a partnership between two or more business owners.
Home revenue
$50.0M
Profit
$566.0K
Privately-owned community Operated by a partnership between two or more business owners.
Home revenue
$50,005,718.00
Profit
$565,981.00
Payroll costs Info The portion of the home's budget spent on staff, including nurses, caregivers, and other employees who support care and operations.
$14.7M
29.5% of revenue
Other operating costs Info All remaining costs needed to run the home, such as food, utilities, building maintenance, supplies and administrative expenses.
$34.4M
Total costs $49.2M
Bed community size
240-bed community
A large-scale community that may provide a wide range of amenities, services, and structured programs.
Walk Score
Walk Score: 32 / 100
Somewhat walkable. A few nearby services may be reachable on foot, but most trips require transportation.

About this community

Occupancy

Occupancy rate
92%
In line with New York average
Occupied beds
221 / 240
Average residents 166 per day

License Details

Facility TypeNursing Home
CountySuffolk

Ownership & Operating Entity

The Hamlet Rehabilitation and Healthcare Center at Nesconset is legally operated by Nesconset Operating, LLC (For Profit).

Therapy & Rehabilitation

2 services
Rehabilitation Services
Short-Term Rehab

Staffing & Medical

1 service
Skilled Nursing

Additional Services

1 service
Subacute Rehabilitation

Amenities & Lifestyle

3 amenities
Luxurious Décor
Gourmet Meals
Diversified Programming
Specific ProgramsOrthopedic Rehabilitation, Short Term Rehabilitation, Long Term Care, Amputee Care, Cardiopulmonary Rehabilitation, Recreation, Urban Zen, Luxury Services, Concierge / Patient Experience, Dining, Events

Dining & Nutrition

Food DescriptionGourmet meals are provided.

What does this home offer?

Accepts Medicaid icon

Accept Medicaid: Yes, Accept

Total residents icon

Total Residents: 240 Residents

Building type icon
Building type icon

Building Type: Single-story

Types of Care at The Hamlet Rehabilitation and Healthcare Center at Nesconset

Nursing Home
Contact The Hamlet Rehabilitation and Healthcare Center at Nesconset

Inspection History

In New York, the Department of Health, Office of Aging and Long Term Care performs unannounced onsite inspections to monitor compliance with state and federal healthcare regulations.

13 inspections

4 with citations, 9 without citations

25 on-site complaint investigations

New York average: 9 inspections (5 with citations), 15 on-site complaint investigations

91 complaints

39 complaints per 100 occupied beds

New York average: 49.9 complaints per 100 occupied beds

Formal expressions of dissatisfaction or concern made by residents, or their families regarding various aspects of the care, services, and environment provided.

New York average: 79 complaints

Latest inspection

Date February 20, 2025
Annual Inspection

34 total citations

30 health citations 4 life safety citations

Citations indicate regulatory violations. A higher number implies the facility had several areas requiring improvement.

New York average: 29 citations

New York average: 20 health citations

New York average: 4 life safety citations

34 deficiencies

Deficiencies indicate regulatory issues. A higher number implies the facility had several areas requiring improvement.

New York average: 22 deficiencies

Health Inspection History

Inspections
Total health inspections 4

New York average 3.6


Last Health inspection on Feb 2025

Total health citations 12

New York average 18.5

Citations per inspection
3

New York average 5.05


Health citations are formal notices following inspections when they fail to comply with safety and care standards.

9 of 12 citations resulted from standard inspections; 1 of 12 resulted from complaint investigations; and 2 of 12 came from combined inspections (standard and complaint).

Breakdown of citation severity (last 3 years)
Critical Health citations More info 1
400% worse than New York average

New York average: 0.2


Serious Health citations More info 0
100% better than New York average

New York average: 0.2

1 critical citation More info New York average: 0.2

0 serious citations More info New York average: 0.2

11 moderate citations More info New York average: 17.4

0 minor citations More info New York average: 0.7
Citations history (last 3 years)
Quality of Care moderate citation Info Issues related to how well residents receive appropriate treatment and support for their medical and daily care needs. Feb 20, 2025
Corrected

Quality of Care moderate citation Info Issues related to how well residents receive appropriate treatment and support for their medical and daily care needs. Feb 20, 2025
Corrected

Quality of Care moderate citation Info Issues related to how well residents receive appropriate treatment and support for their medical and daily care needs. Feb 20, 2025
Corrected

Nursing Services moderate citation Info Issues related to the availability and quality of nursing staff and the care they provide. Nov 22, 2023
Corrected

Compare Nursing Homes around East Setauket The information below is reported by the New York State Department of Health.

3 facilities compared · CMS & NY Dept. of Health data · Updated Apr 2026

Filter by care type
Long Island State Veterans Home
NH

Nursing Home Licensed facility providing 24/7 skilled nursing care for residents with complex, ongoing medical needs. Staffed by RNs, LPNs, and CNAs. Inspected and star-rated annually by CMS. Accepts Medicare (short-term rehab) and Medicaid (long-term care).

Escondido
-
89.4%
+6%
4.19
-
-1%
0
0
0.0
0
310
-
Rocco, Pat
$33.4M
$33.8M
101.2%
335758
-
The Hamlet Rehabilitation and Healthcare Center at Nesconset
AL

Assisted Living A licensed, long-term care setting for seniors or individuals with disabilities who need help with daily activities — like bathing, dressing, and medication management — but not 24-hour skilled nursing. Offers housing, meals, and around-the-clock support while aiming to maximize resident independence.

IL

Independent Living Lifestyle-focused communities for older adults offering dining, activities, and transportation with minimal personal care. Best for active, independent seniors who want community without medical support.

MC

Memory Care Secured, specialized care for people living with Alzheimer's or dementia. Staff trained in cognitive impairment, with higher staff-to-resident ratios and an environment designed to reduce confusion and wandering risk.

NH

Nursing Home Licensed facility providing 24/7 skilled nursing care for residents with complex, ongoing medical needs. Staffed by RNs, LPNs, and CNAs. Inspected and star-rated annually by CMS. Accepts Medicare (short-term rehab) and Medicaid (long-term care).

Nesconset
240
94.9%
+7%
2.83
-19%
-21%
2
12
3.0
1
235
32
Nesconset Operating, Llc (For Profit)
$49.7M
$14.7M
29.6%
335674
-
Water’s Edge Rehab and Nursing Center at Port Jefferson
-
NH

Nursing Home Licensed facility providing 24/7 skilled nursing care for residents with complex, ongoing medical needs. Staffed by RNs, LPNs, and CNAs. Inspected and star-rated annually by CMS. Accepts Medicare (short-term rehab) and Medicaid (long-term care).

Escondido
-
-
-
-
-
-
-
-
-
0
0
0.0
0
-
-
-
-
-
-
-
Private / Semi-Private Rooms

Places of interest near The Hamlet Rehabilitation and Healthcare Center at Nesconset

Address 0.4 miles from city center
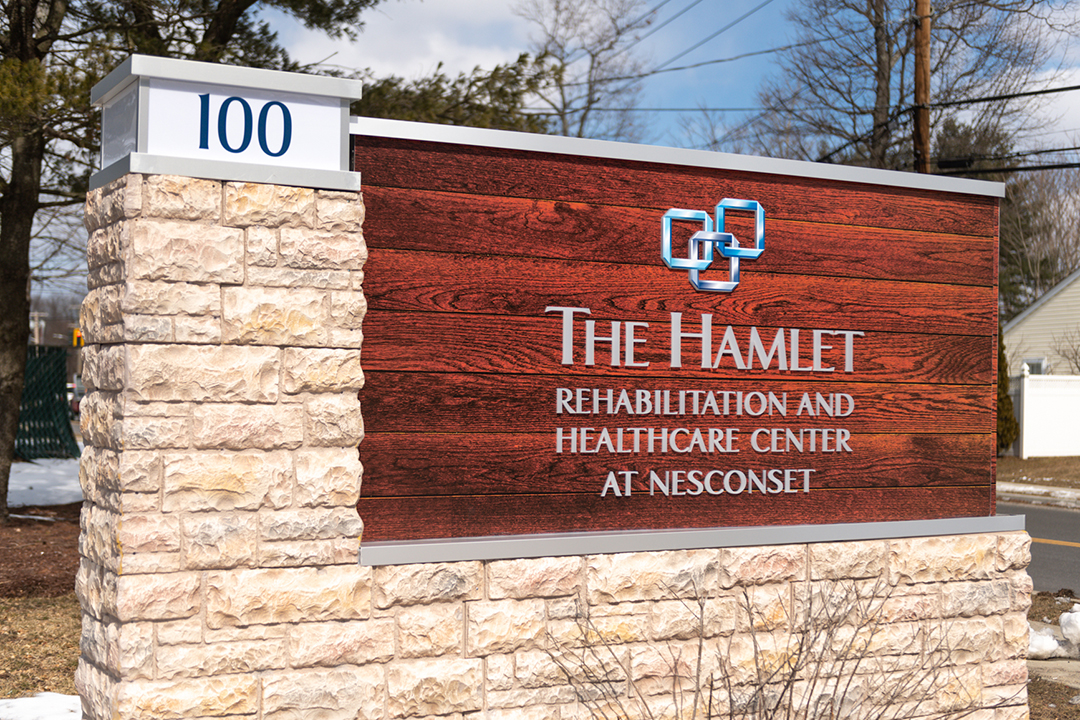
Address 100 Southern Blvd, Nesconset, NY 11767

Calculate Travel Distance to The Hamlet Rehabilitation and Healthcare Center at Nesconset

Add your location

Address

Staffing Data (Q2 2025)

This data corresponds to Q2 2025 and is based on CMS Payroll-Based Journal.

Total staff 329
Employees 260
Contractors 69
Staff to resident ratio 1.46:1
734% better than New York average

New York average ratio: 0.18:1

Avg staff/day 148
Average shift 7.6 hours
0% compared with New York average

New York average: 7.7 hours

Total staff hours (quarter) 101,963
Nursing staff breakdown
Registered Nurse

Manages medical care and health needs.

Total count 33
Average shift length Info Average shift length. Calculated as total hours divided by days worked and average staff per day. 7.6 hours

This role is partially covered by contractors.

Licensed Practical Nurse

Assists with medical care and medications.

Total count 55
Average shift length Info Average shift length. Calculated as total hours divided by days worked and average staff per day. 8.1 hours

This role is partially covered by contractors.

Certified Nursing Assistant

Helps with daily care and mobility.

Total count 127
Average shift length Info Average shift length. Calculated as total hours divided by days worked and average staff per day. 7.5 hours

No contractors work on this role.

Contractor staffing

Total hours from contractors

17.7%

18,049 contractor hours this quarter

Physical Therapy Aide: 18 Speech Language Pathologist: 16 Respiratory Therapy Technician: 12 Physical Therapy Assistant: 9 Licensed Practical Nurse: 4 Qualified Social Worker: 4 Registered Nurse: 3 Respiratory Therapist: 2 RN Director of Nursing: 1
Staff by category
Certified Nursing Assistant127012744,56891100%7.5
Licensed Practical Nurse5145516,90691100%8.1
Registered Nurse303338,05591100%7.6
Speech Language Pathologist016165,2288897%7.6
Physical Therapy Aide018185,11191100%7.3
Other Dietary Services Staff140143,4918998%7.1
Clinical Nurse Specialist100103,1656673%8
Respiratory Therapy Technician012123,1618998%8.3
Mental Health Service Worker8082,5927785%7.7
Occupational Therapy Aide6061,8537481%7.5
Dietitian4041,7808897%7.5
Physical Therapy Assistant0991,5728897%6.8
Physical Therapist3031,1397886%6.7
Qualified Social Worker0448946673%6.7
Administrator2025948290%7.2
RN Director of Nursing1124705864%7.9
Nurse Practitioner1014485662%8
Respiratory Therapist0224335763%7.6
Other Social Services Staff2022943741%7.6
Qualified Activities Professional1012122932%7.3
127 Certified Nursing Assistant
% of Days 100%
55 Licensed Practical Nurse
% of Days 100%
33 Registered Nurse
% of Days 100%
16 Speech Language Pathologist
% of Days 97%
18 Physical Therapy Aide
% of Days 100%
14 Other Dietary Services Staff
% of Days 98%
10 Clinical Nurse Specialist
% of Days 73%
12 Respiratory Therapy Technician
% of Days 98%
8 Mental Health Service Worker
% of Days 85%
6 Occupational Therapy Aide
% of Days 81%
4 Dietitian
% of Days 97%
9 Physical Therapy Assistant
% of Days 97%
3 Physical Therapist
% of Days 86%
4 Qualified Social Worker
% of Days 73%
2 Administrator
% of Days 90%
2 RN Director of Nursing
% of Days 64%
1 Nurse Practitioner
% of Days 62%
2 Respiratory Therapist
% of Days 63%
2 Other Social Services Staff
% of Days 41%
1 Qualified Activities Professional
% of Days 32%

Facility Characteristics

Source: CMS Long-Term Care Facility Characteristics (Data as of Jan 2026)

Total census
225 residents
Residents by payment source
Medicare
93 residents (41.3%)
Medicaid
105 residents (46.7%)
Private pay or other
27 residents (12%)
Programs & Services
Residents' Group

Residents meet regularly to discuss policies, care quality, and activities

Active Resident Council

Organized group of residents that meets regularly to discuss facility policies, quality of life, and activities.

Quality of care over time

These measures show how residents usually do over time at this home, based on health outcomes and preventive care.

High-risk clinical events score Info A composite score based on pressure ulcers, falls with injury, weight loss, walking ability decline, and activities of daily living decline. 11.2
14% worse than New York average

New York average: 9.8

Functional decline score Info A composite score based on activities of daily living decline, walking ability decline, and incontinence. 18.8
In line with New York average

New York average: 18.1

Long-stay resident measures
Significantly above average New York avg: 4.3 Info CMS star rating based on long-stay quality measure performance. 5 stars = significantly above average, 1 star = significantly below average.
Need for Help with Daily Activities Increased Info Percent of long-stay residents whose need for help with daily activities has increased 19.6%
19% worse than New York average

New York average: 16.4%

Walking Ability Worsened Info Percent of long-stay residents whose ability to move independently worsened 16.8%
In line with New York average

New York average: 16.6%

Low Risk Residents with Bowel/Bladder Incontinence Info Percent of low risk long-stay residents who lose control of their bowels or bladder 20.0%
6% better than New York average

New York average: 21.4%

Falls with Major Injury Info Percent of long-stay residents experiencing one or more falls with major injury 4.9%
65% worse than New York average

New York average: 3.0%

High Risk Residents with Pressure Ulcers Info Percent of long-stay high risk residents with pressure ulcers 5.1%
28% better than New York average

New York average: 7.2%

Urinary Tract Infection Info Percent of long-stay residents with a urinary tract infection 0.5%
65% better than New York average

New York average: 1.4%

Lost Too Much Weight Info Percent of long-stay residents who lose too much weight 9.5%
56% worse than New York average

New York average: 6.1%

Depressive Symptoms Info Percent of long-stay residents who have depressive symptoms 3.3%
82% better than New York average

New York average: 18.1%

Antipsychotic Use Info Percent of long-stay residents who received an antipsychotic medication 10.5%
17% better than New York average

New York average: 12.6%

Pneumococcal Vaccine Info Percent of long-stay residents assessed and appropriately given the pneumococcal vaccine 81.5%
11% worse than New York average

New York average: 91.4%

Influenza Vaccine Info Percent of long-stay residents assessed and appropriately given the seasonal influenza vaccine 91.0%
In line with New York average

New York average: 95.2%

Hospitalizations per 1,000 days Info Number of hospitalizations per 1,000 long-stay resident days. 0.79
54% better than New York average

New York average: 1.71

ED visits per 1,000 days Info Number of outpatient emergency department visits per 1,000 long-stay resident days. 0.25
81% better than New York average

New York average: 1.35

Short-stay resident measures
Significantly above average New York avg: 3.7 Info CMS star rating based on short-stay quality measure performance. 5 stars = much above average, 1 star = much below average.
Pneumococcal Vaccine Info Percent of short-stay residents assessed and appropriately given the pneumococcal vaccine 54.5%
29% worse than New York average

New York average: 76.6%

Antipsychotic medication increase Info Percent of short-stay residents who newly received an antipsychotic medication 1.1%
11% better than New York average

New York average: 1.3%

Influenza Vaccine Info Percent of short-stay residents assessed and appropriately given the seasonal influenza vaccine 55.3%
30% worse than New York average

New York average: 78.8%

Re-hospitalized after SNF stay Info Percentage of short-stay residents who were re-hospitalized after their nursing home admission. 16.8%
18% better than New York average

New York average: 20.6%

Emergency department visits Info Percentage of short-stay residents who had an outpatient emergency department visit. 5.2%
46% better than New York average

New York average: 9.7%

Falls with major injury Info Percentage of SNF residents who experience falls with major injury during their stay. 0.8%
In line with New York average

New York average: 0.8%

Ability to care for self at discharge Info Percentage of residents at or above expected ability to care for themselves at discharge. 68.5%
28% better than New York average

New York average: 53.7%

Successful return to home or community Info Rate of successful return to home or community from a skilled nursing facility. 58.0%
15% better than New York average

New York average: 50.6%

Penalties and fines

Federal penalties imposed by CMS for regulatory violations, including civil money penalties (fines) and denials of payment for new Medicare/Medicaid admissions.

Source: CMS Penalties Database (Data as of Jan 2026)

Total fines amount $93K
40% higher than New York average

New York average: $66K

Number of fines 2
In line with New York average

New York average: 2.0

Payment Denials Info Serious action where Medicare and/or Medicaid temporarily stops payments for new residents until issues are fixed. 0
100% fewer payment denials than New York average

New York average: 0.1

Fines amount comparison
This facility $93K
New York average $66K
Penalty History

Penalties are imposed by CMS for violations of federal nursing home regulations.

Civil Money Penalty Info Fines imposed for noncompliance, which can be assessed per day or per instance of violation. Apr 5, 2024
$44K
Civil Money Penalty Info Fines imposed for noncompliance, which can be assessed per day or per instance of violation. Sep 8, 2023
$49K

Last updated: Jan 2026

Guides for Better Senior Living

Care Cost Calculator: See Prices in Your Area

Nursing Home Data Explorer

Don’t Wait Too Long: 7 Red Flag Signs Your Parent Needs Assisted Living Now

The True Cost of Assisted Living in 2025 – And How Families Are Paying For It

Understanding Senior Living Costs: Pricing Models, Discounts & Financial Assistance

Financial Aid for New York Seniors

Get financial aid guidance

Community First Choice Option

NY Medicaid CFCO

Age 65+ or disabled, New York resident, Medicaid- eligible, care need (not necessarily nursing home level).

~$2,829/month (300% FBR, individual).

$30,182 (individual, higher due to NY Medicaid expansion).

Higher asset limit; urban density increases demand.

Expanded In-Home Services for the Elderly Program (EISEP)

NY EISEP

Age 60+, New York resident, at risk of decline but not nursing home level.

~$2,500/month (individual, varies).

$15,000 (individual).

Cost-sharing required above certain income; urban/rural balance.

Senior Citizen Rent Increase Exemption (SCRIE)

NY SCRIE

Age 62+, NYC resident, live in rent-controlled/stabilized apartment, spend >1/3 of income on rent.

$50,000/year (household).

No strict asset cap, but income-focused eligibility.

Limited to NYC’s rent-regulated units; high demand in urban areas.

Senior Citizen Homeowners’ Exemption (SCHE)

NY SCHE

Age 65+, NYC resident, own and live in a 1-3 family home, co-op, or condo.

$58,399/year (household).

No strict asset cap, income-driven eligibility.

Applies only in NYC; excludes large apartment buildings.

New York Foundation for Senior Citizens (NYFSC) Home Sharing Program

NYFSC Home Sharing

One participant must be 60+ (host or guest), NYC resident, able to share living space.

No strict limit, but targets those needing cost relief.

Not applicable; focus on housing need.

Primarily NYC-focused; limited slots due to demand.