The Pearl of Rolling Meadows
Nursing Home, Memory Care & Respite Care · Rolling Meadows, IL
CMS overall rating Info CMS (the Centers for Medicare & Medicaid Services) is the federal agency that rates nursing home quality. Its Overall Rating runs from 1 to 5 stars, combining health inspections, staffing, and quality measures, with inspections weighted most heavily.

The Pearl of Rolling Meadows

Nursing Home, Memory Care & Respite Care · Rolling Meadows, IL
CMS overall rating Info CMS (the Centers for Medicare & Medicaid Services) is the federal agency that rates nursing home quality. Its Overall Rating runs from 1 to 5 stars, combining health inspections, staffing, and quality measures, with inspections weighted most heavily.
Calculator: See prices in your area
The Pearl of Rolling Meadows accepts Medicare, Medicaid, and private pay.

Overview of The Pearl of Rolling Meadows

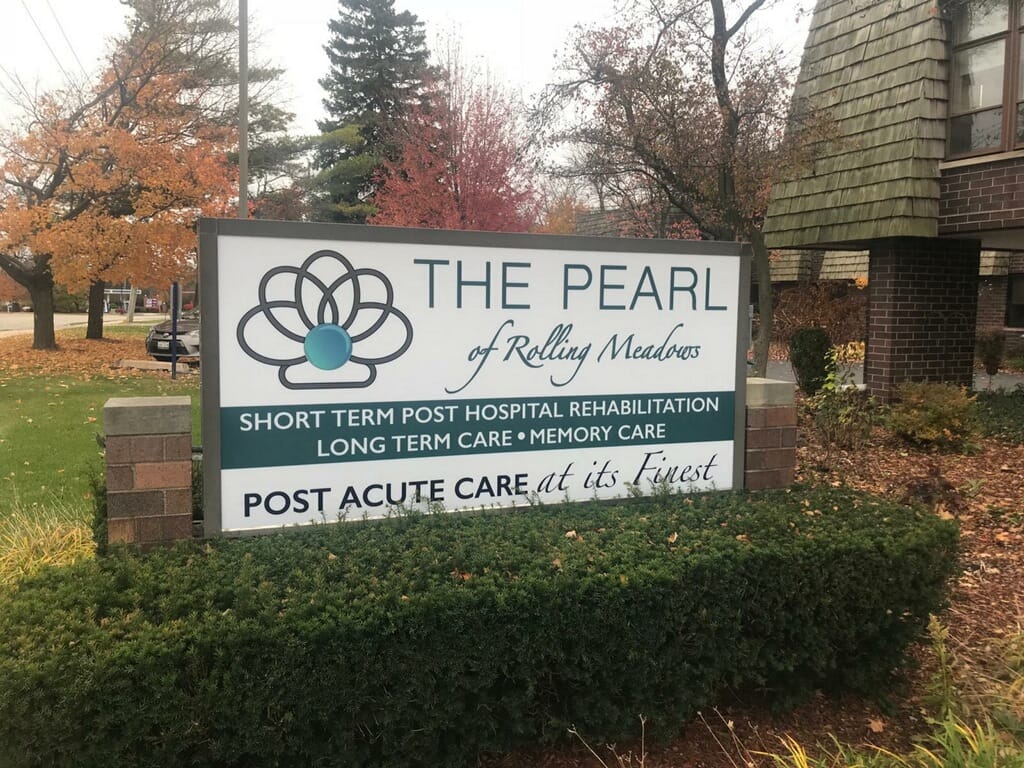
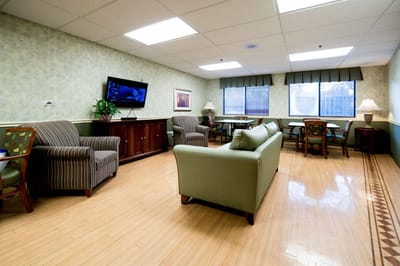
The Pearl of Rolling Meadows is a nursing home in Rolling Meadows, IL, offering a wide range of care options, including long-term care, memory care, and rehabilitation. The community’s nurturing and welcoming environment ensures older adults are well-cared for. With 24-hour care, therapies, and restaurant-style dining, residents receive the utmost attention and care to live comfortably. To meet residents’ unique needs and preferences, the community curates personalized care plans.

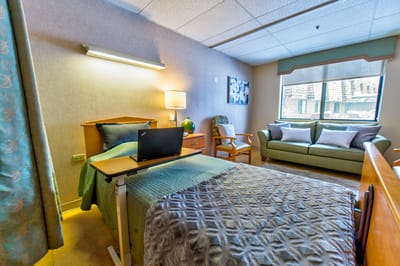
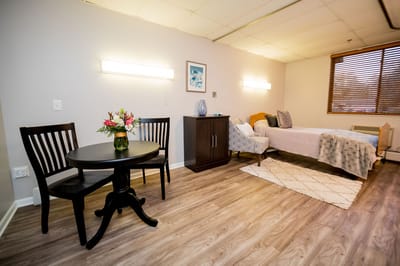
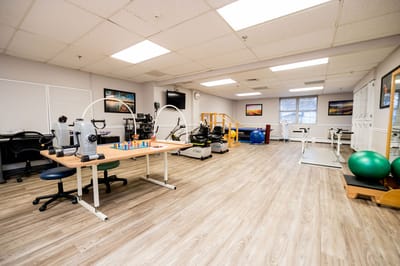
Stretching exercises, fun gatherings, and various recreational activities ensure residents can maintain their holistic well-being and have fun. Residents can also focus on their recovery with state-of-the-art amenities and spacious rooms. Situated near a highway in the tree-lined neighborhood of Rolling Meadows, the community ensures a laid-back and convenient lifestyle. This nursing home provides top-notch care for older adults’ welfare, making it a great choice for senior living in Illinois.

Quality ratings

Measured by Centers for Medicare & Medicaid Services (CMS)

Overall rating Info The Overall CMS Rating combines results from health inspections, staffing levels and quality measures. Health inspections carry the most weight. Staffing and quality scores can increase or decrease the final rating based on performance compared to state and national standards.
▲ 19.0% Above IL avg. ▲ 19.0% Above IL avg.IL average: 2.5Click the badge to see the full State ranking.Click here to see the full State ranking.
Health Inspection Info Based on the results of the facility's three most recent standard inspections and any complaint investigations. CMS reviews the number, scope, and severity of deficiencies, with more recent findings weighted more heavily.
▲ 8.1% Above IL avg. ▲ 8.1% Above IL avg.IL average: 2.8Click the badge to see the full State ranking.Click here to see the full State ranking.
Staffing Info Measures average nursing staff hours per resident per day, including Registered Nurses (RNs) and total nursing staff. Ratings are adjusted based on the level of care residents require and are compared to state and national benchmarks.
▲ 40.4% Above IL avg. ▲ 40.4% Above IL avg.IL average: 2.1Click the badge to see the full State ranking.Click here to see the full State ranking.
Quality Measures Info Based on clinical and physical health indicators reported to CMS, such as hospital readmissions, falls, pressure ulcers, and improvements in mobility. These measures reflect how well residents' health needs are being managed.
▲ 42.1% Above IL avg. ▲ 42.1% Above IL avg.IL average: 2.8Click the badge to see the full State ranking.Click here to see the full State ranking.

Staffing hours breakdown

Info Daily nursing hours per resident by staff type, reported to CMS. Higher is generally better — compare this facility to state and national averages to see where staffing stands.

Hours per resident per day — compared to Illinois state averages

Total nursing care / resident Info This home is ranked 93rd out of 172 homes in Illinois for nurse hours. Total adjusted nursing hours per resident per day, combining RN, LPN, and aide time. CMS adjusts this for case-mix so facilities can be fairly compared.
2h 50m per day
Rank #93 / 172Nurse hours — State benchmarkedThis home is ranked 93rd out of 172 homes in Illinois. Shows adjusted nurse hours per resident per day benchmarked to the Illinois average, with a ranking across 172 Illinois facilities. More hours mean more direct care. The national average is about 3.5 hrs; below 3.0 is a red flag.Rankings are based only on facilities in Illinois that report data for that category. Facilities without available data are excluded from the ranking.Click the rank badge to see the full State ranking.Click here to see the full State ranking.
This facility Illinois avg (3h 6m per day)
vs Illinois avg
-8%

2 of 6 metrics below state avg

Standout metric Registered Nurse (RN) is +25% above state avg
Staff typeHours / Day / Residentvs state avg
Registered Nurse (RN) Info RNs hold the highest nursing license and can assess residents, interpret test results, and direct care plans. More RN hours per day often signals stronger clinical oversight and faster response to health changes. 54m per day ▲ 25% State avg: 43m per day · National avg: 41m per day
LPN / LVN Info Licensed Practical Nurses (LPNs) or Licensed Vocational Nurses (LVNs) deliver routine hands-on care — medication administration, wound dressing, and monitoring vital signs. They work under RN supervision and make up a large share of daily bedside care. 39m per day ■ Avg State avg: 39m per day · National avg: 52m per day
Nurse Aide Info Certified Nurse Aides (CNAs) provide the most direct day-to-day assistance: bathing, dressing, feeding, and mobility. Nurse aide hours are typically the largest staffing category and directly affect residents' quality of life. 1h 54m per day ▼ 10% State avg: 2h 7m per day · National avg: 2h 20m per day
Weekend Total Nursing Info Combined nursing hours (RN + LPN + Nurse Aide) per resident per day on weekends. Staffing often drops on weekends — this figure reveals whether the facility maintains adequate coverage outside of weekday hours. 2h 56m per day ▼ 5% State avg: 3h 6m per day · National avg: 3h 27m per day
Physical Therapist Info Hours per resident per day provided by licensed Physical Therapists (PTs) or PT Assistants. PT services help residents recover mobility after injury or illness and are especially important for post-acute (short-stay) rehabilitation. 3m per day ▲ 7% State avg: 3m per day · National avg: 4m per day
Weekend RN Info Registered nurse hours specifically on weekends. Facilities sometimes reduce RN presence on Saturdays and Sundays — a low weekend RN figure compared to weekday hours can indicate reduced clinical oversight when most administrative staff are absent. 33m per day ■ Avg State avg: 33m per day · National avg: 29m per day

Capacity and availability

This home usually has availability

Higher occupancy than the Illinois average: 69.3%
Occupancy rate
78.5% Rank #86 / 204Occupancy rate — State benchmarkedThis home is ranked 86th out of 204 homes in Illinois. Shows this facility's occupancy rate versus the Illinois average, with its Statewide rank out of 204. Higher occupancy signals strong local demand and financial stability.Rankings are based only on facilities in Illinois that report data for that category. Facilities without available data are excluded from the ranking.Click the rank badge to see the full State ranking.Click here to see the full State ranking.
Avg. Length of Stay
145 days
Bed community size
155-bed community Rank #48 / 426Bed count — State benchmarkedThis home is ranked 48th out of 426 homes in Illinois. Shows this facility's certified or reported bed count compared to other Illinois facilities. Larger communities may offer more amenities, programs, and on-site services for residents and families.Rankings are based only on facilities in Illinois that report data for that category. Facilities without available data are excluded from the ranking.Click the rank badge to see the full State ranking.Click here to see the full State ranking.
A large-scale community that may provide a wide range of amenities, services, and structured programs.
Walk Score
Walk Score: 50 / 100 Rank #332 / 648Walk Score — State benchmarkedThis home is ranked 332nd out of 648 homes in Illinois. Shows how walkable this facility's neighborhood is compared to the average Walk Score across Illinois facilities. Higher scores benefit residents, families, and staff.Rankings are based only on facilities in Illinois that report data for that category. Facilities without available data are excluded from the ranking.Click the rank badge to see the full State ranking.Click here to see the full State ranking.
Moderately walkable. Some errands can be accomplished on foot, with a mix of nearby amenities.

Contact The Pearl of Rolling Meadows

Staffing Data

Reporting period: October 1 – December 31, 2025 (Q4 2025). Source: CMS Payroll-Based Journal report.

Total staff 153
Employees 129
Contractors 24
Staff to resident ratio 1.23 : 1
31% fewer staff per resident than Illinois average
Illinois average ratio: 1.80 : 1 Illinois average ratio: 1.80 : 1See full Illinois ranking
Avg staff/day 58
Average shift 8.2 hours
8% better than Illinois average
Illinois average: 7.6 hours Illinois average shift: 7.6 hoursSee full Illinois ranking
Total staff hours (quarter) 43,498

Nursing staff breakdown

Q4 2025 · Oct 1 – Dec 31 More info This data comes from the CMS Payroll-Based Journal report covering October 1 – December 31, 2025.
Registered Nurse

Manages medical care and health needs.

RN Staff Info 24 total: 23 full-time employees and 1 contractor. 24
Average shift length Info Average shift length. Calculated as total hours divided by days worked and average staff per day. 9.7 hours
Licensed Practical Nurse

Assists with medical care and medications.

LPN Staff Info All 23 LPN Staff are full-time employees. No contractors work on this role. 23
Average shift length Info Average shift length. Calculated as total hours divided by days worked and average staff per day. 9.2 hours
Certified Nursing Assistant

Helps with daily care and mobility.

CNA Staff Info All 66 CNA Staff are full-time employees. No contractors work on this role. 66
Average shift length Info Average shift length. Calculated as total hours divided by days worked and average staff per day. 7.7 hours

Contractor staffing

Q4 2025 · Oct 1 – Dec 31 More info This data comes from the CMS Payroll-Based Journal report covering October 1 – December 31, 2025.

Total hours from contractors

10.1%

4,372 contractor hours this quarter

Speech Language Pathologist: 5 Physical Therapy Aide: 4 Physical Therapy Assistant: 4 Respiratory Therapy Technician: 4 Qualified Social Worker: 3 Medication Aide/Technician: 2 Registered Nurse: 1 Medical Director: 1

Staff by category

Q4 2025 · Oct 1 – Dec 31 More info This data comes from the CMS Payroll-Based Journal report covering October 1 – December 31, 2025.
Certified Nursing Assistant6606619,86692100%7.7
Registered Nurse231248,27292100%9.7
Licensed Practical Nurse230236,66192100%9.2
Other Dietary Services Staff8081,8548896%7.6
Clinical Nurse Specialist2029276470%7.5
Speech Language Pathologist0558776672%6.8
Physical Therapy Aide0446816672%6.9
Medication Aide/Technician0225984043%15
Respiratory Therapy Technician0445847278%8.1
Physical Therapy Assistant0445246975%7.6
Mental Health Service Worker1014736368%7.5
Nurse Practitioner1014506065%7.5
Administrator1014435964%7.5
Dietitian1014285762%7.5
Qualified Social Worker0333745155%7.3
RN Director of Nursing3032932325%7
Medical Director0111952628%7.5
66 Certified Nursing Assistant
% of Days 100%
24 Registered Nurse
% of Days 100%
23 Licensed Practical Nurse
% of Days 100%
8 Other Dietary Services Staff
% of Days 96%
2 Clinical Nurse Specialist
% of Days 70%
5 Speech Language Pathologist
% of Days 72%
4 Physical Therapy Aide
% of Days 72%
2 Medication Aide/Technician
% of Days 43%
4 Respiratory Therapy Technician
% of Days 78%
4 Physical Therapy Assistant
% of Days 75%
1 Mental Health Service Worker
% of Days 68%
1 Nurse Practitioner
% of Days 65%
1 Administrator
% of Days 64%
1 Dietitian
% of Days 62%
3 Qualified Social Worker
% of Days 55%
3 RN Director of Nursing
% of Days 25%
1 Medical Director
% of Days 28%

Penalties and fines

Federal penalties imposed by CMS for regulatory violations, including civil money penalties (fines) and denials of payment for new Medicare/Medicaid admissions.

Source: CMS Penalties Database

No penalties in the past 3 years

No civil money penalties or payment denials were reported in the last 3 years.

Quality of care over time

These measures show how residents usually do over time at this home, based on health outcomes and preventive care.

High-risk clinical events score Info A composite score based on pressure ulcers, falls with injury, weight loss, walking ability decline, and activities of daily living decline. 3.9
59% better than Illinois average

Illinois average: 9.7

Functional decline score Info A composite score based on activities of daily living decline, walking ability decline, and incontinence. 6.9
63% better than Illinois average

Illinois average: 18.6

Long-stay resident measures
Need for Help with Daily Activities Increased Info Percent of long-stay residents whose need for help with daily activities has increased 6.2%
60% better than Illinois average

Illinois average: 15.5%

Walking Ability Worsened Info Percent of long-stay residents whose ability to move independently worsened 7.4%
60% better than Illinois average

Illinois average: 18.4%

Low Risk Residents with Bowel/Bladder Incontinence Info Percent of low risk long-stay residents who lose control of their bowels or bladder 6.9%
68% better than Illinois average

Illinois average: 21.6%

Falls with Major Injury Info Percent of long-stay residents experiencing one or more falls with major injury 1.1%
68% better than Illinois average

Illinois average: 3.4%

High Risk Residents with Pressure Ulcers Info Percent of long-stay high risk residents with pressure ulcers 1.9%
65% better than Illinois average

Illinois average: 5.3%

Urinary Tract Infection Info Percent of long-stay residents with a urinary tract infection 0.9%
50% better than Illinois average

Illinois average: 1.8%

Lost Too Much Weight Info Percent of long-stay residents who lose too much weight 3.0%
54% better than Illinois average

Illinois average: 6.5%

Depressive Symptoms Info Percent of long-stay residents who have depressive symptoms 97.0%
102% worse than Illinois average

Illinois average: 48.1%

Antipsychotic Use Info Percent of long-stay residents who received an antipsychotic medication 26.4%
31% worse than Illinois average

Illinois average: 20.2%

Pneumococcal Vaccine Info Percent of long-stay residents assessed and appropriately given the pneumococcal vaccine 53.6%
40% worse than Illinois average

Illinois average: 89.2%

Influenza Vaccine Info Percent of long-stay residents assessed and appropriately given the seasonal influenza vaccine 94.3%
In line with Illinois average

Illinois average: 91.6%

Short-stay resident measures
Pneumococcal Vaccine Info Percent of short-stay residents assessed and appropriately given the pneumococcal vaccine 10.7%
84% worse than Illinois average

Illinois average: 68.3%

Antipsychotic medication increase Info Percent of short-stay residents who newly received an antipsychotic medication 3.1%
34% worse than Illinois average

Illinois average: 2.3%

Influenza Vaccine Info Percent of short-stay residents assessed and appropriately given the seasonal influenza vaccine 9.2%
85% worse than Illinois average

Illinois average: 63.0%

Breakdown by payment type

Medicare

26% of new residents, usually for short-term rehab.

Typical stay 2 - 3 months

Private pay

7% of new residents, often for short stays.

Typical stay 7 - 8 months

Medicaid

67% of new residents, often for long-term daily care.

Typical stay 5 - 6 months

Facility Characteristics

Source: CMS Long-Term Care Facility Characteristics (Data as of Jan 2026)

Total residents 124
Medicare
14
11.3% of residents
Medicaid
87
70.2% of residents
Private pay or other
23
18.5% of residents
Programs & Services
Residents Group

Residents meet regularly to discuss policies, care quality, and activities

Active Resident Council

Organized group of residents that meets regularly to discuss facility policies, quality of life, and activities.

Finances and operations

Based on CMS SNF Cost Report for fiscal year ending in 12/2023.

For-profit
Individual
Net patient revenue Info Net patient revenue — what the home actually collects for resident care, after contractual allowances, bad debt and discounts are subtracted from its gross charges (CMS cost report, Worksheet G-3). It covers resident care only; money the home earns from other sources is shown separately as "Other income."
$14.4M
Net patient income Info Net patient income: net patient revenue minus the home's total operating expenses. A positive figure means it earns more from resident care than it spends to deliver it; a negative figure means the opposite. It excludes non-operating "other income."
-$276.2K
For-profit Individual
Net patient revenue Info Net patient revenue — what the home actually collects for resident care, after contractual allowances, bad debt and discounts are subtracted from its gross charges (CMS cost report, Worksheet G-3). It covers resident care only; money the home earns from other sources is shown separately as "Other income."
$14.4M Rank #81 / 171Revenue — State benchmarkedThis home is ranked 81st out of 171 homes in Illinois. Shows this facility's annual revenue compared to the Illinois average. Higher revenue generally means more resources for staffing and capital — read alongside Payroll %.Rankings are based only on facilities in Illinois that report data for that category. Facilities without available data are excluded from the ranking.Click the rank badge to see the full State ranking.Click here to see the full State ranking.
Net patient income Info Net patient income: net patient revenue minus the home's total operating expenses. A positive figure means it earns more from resident care than it spends to deliver it; a negative figure means the opposite. It excludes non-operating "other income."
-$276.2K
Other income Info Money the home earns outside of resident care — such as investments, grants, rentals and other non-operating sources (CMS cost report, Worksheet G-3). It is tracked separately from net patient revenue: it is not part of that figure, and it is not included in net patient income.
$841.3K
Payroll costs Info Staff salaries plus wage-related costs — benefits such as payroll taxes, health insurance and retirement — from the home's own accounting records (CMS cost report, Worksheet A). Contract or agency labor is counted separately, under other operating costs. Rank #82 / 171Payroll — State benchmarkedThis home is ranked 82nd out of 171 homes in Illinois. Shows total annual staff payroll benchmarked to the Illinois average. Higher payroll investment relative to peers often signals better staffing and less reliance on cheaper contract labor.Rankings are based only on facilities in Illinois that report data for that category. Facilities without available data are excluded from the ranking.Click the rank badge to see the full State ranking.Click here to see the full State ranking.
$6.4M 44.6% of net patient revenue Info Payroll as a share of revenue: staff salaries and wage-related benefits divided by net patient revenue. A higher figure means more of each revenue dollar goes to staff pay. Rank #79 / 171Payroll % — State benchmarkedThis home is ranked 79th out of 171 homes in Illinois. Shows payroll as a percentage of revenue versus the Illinois average. Well-run Illinois facilities typically land around 54–67% — the top third Statewide. Below 25% may signal understaffing or heavy agency use — read with Staffing ratings.Rankings are based only on facilities in Illinois that report data for that category. Facilities without available data are excluded from the ranking.Click the rank badge to see the full State ranking.Click here to see the full State ranking.
Other operating costs Info Everything it costs to run the home apart from payroll — food, utilities, supplies, maintenance, contract labor and administration. Calculated as total operating expense minus payroll (staff salaries and wage-related benefits).
$8.2M
Total costs Info The home's total operating expense for the year — all the costs of running it, salaries included (CMS cost report, Worksheet G-3).
$14.6M

What does this home offer?

Building type icon
Building type icon

Building Type: 2-story

On-site medical care and health services icon

On-site Medical Care and Health Services

Rehabilitative support icon

Rehabilitative Support

Housekeeping icon
Housekeeping icon

Housekeeping Services

Who this home usually serves

TYPE OF STAY

Mostly long-term care residents

Most residents stay for extended periods and receive ongoing daily care.

Most new residents arrive under Medicaid (67% of admissions), and a typical Medicaid stay runs around 5 - 6 months.

Admissions
300 total

Coverage residents most often arrive under.

Medicare 26%
Private pay 7%
Medicaid 67%
Discharges
307 total

Coverage residents most often leave under.

Medicare 27%
Private pay 8%
Medicaid 65%

Places of interest near The Pearl of Rolling Meadows

Address 1.9 miles from city center Info Estimated distance in miles from Rolling Meadows's city center to The Pearl of Rolling Meadows's address, calculated via Google Maps.

Calculate Travel Distance to The Pearl of Rolling Meadows

Add your location

Address

Compare Nursing Homes around Arlington Heights

The information below is reported by the Illinois Department of Public Health, Office of Health Care Regulation.

4 facilities compared · CMS & IL Dept. of Health data

Radford Green at Sedgebrook
NH
AL
IL
MC
Lincolnshire
37
Facility 37
IL AVG 86
Rank #366 / 426
83.1%
Facility 83.1%
IL AVG 69.3%
Rank #70 / 204
+20%
4.75
Facility 4.75
IL AVG 3.10
Rank #21 / 172
-5%+53%
$68.8k
Facility $68.8k
IL AVG $151.3k
Rank #117 / 173
22
Facility 22
IL AVG 36.8
Rank #51 / 172
2.8
Facility 2.8
IL AVG 3.7
Rank #37 / 172
576-
36
Facility 36
IL AVG 51
Rank #448 / 648
Senior Living Vii Operator Holdings LLC
$34.2M
Facility $34.2M
IL AVG $12.2M
Rank #5 / 171
$21.3M
Facility $21.3M
IL AVG $4.8M
Rank #1 / 171
62.2%
Facility 62.2%
IL AVG 44.3%
Rank #89 / 171
146136
New Summit Rehabilitation and Healthcare
NH
NC
Arlington Heights
120
Facility 120
IL AVG 86
Rank #80 / 426
26.0%
Facility 26.0%
IL AVG 69.3%
Rank #196 / 204
-62%
3.76
Facility 3.76
IL AVG 3.10
Rank #47 / 172
+64%+21%
$0
Facility $0
IL AVG $151.3k
Rank #1 / 173
23
Facility 23
IL AVG 36.8
Rank #54 / 172
3.8
Facility 3.8
IL AVG 3.7
Rank #103 / 172
189-
41
Facility 41
IL AVG 51
Rank #412 / 648
Vivra Specialty Care LLC
$8.5M
Facility $8.5M
IL AVG $12.2M
Rank #91 / 171
$5.4M
Facility $5.4M
IL AVG $4.8M
Rank #125 / 171
63.2%
Facility 63.2%
IL AVG 44.3%
Rank #132 / 171
146179
The Pearl of Rolling Meadows
NH
MC
RC
Rolling Meadows
155
Facility 155
IL AVG 86
Rank #48 / 426
78.5%
Facility 78.5%
IL AVG 69.3%
Rank #86 / 204
+13%
2.84
Facility 2.84
IL AVG 3.10
Rank #93 / 172
+11%-8%
$0
Facility $0
IL AVG $151.3k
Rank #1 / 173
30
Facility 30
IL AVG 36.8
Rank #79 / 172
2.3
Facility 2.3
IL AVG 3.7
Rank #15 / 172
2117-
50
Facility 50
IL AVG 51
Rank #332 / 648
Joezee Meadows LLC
$14.4M
Facility $14.4M
IL AVG $12.2M
Rank #81 / 171
$6.4M
Facility $6.4M
IL AVG $4.8M
Rank #82 / 171
44.6%
Facility 44.6%
IL AVG 44.3%
Rank #79 / 171
145350
ALIYA of Palatine
NH
Palatine
129
Facility 129
IL AVG 86
Rank #72 / 426
73.1%
Facility 73.1%
IL AVG 69.3%
Rank #112 / 204
+6%
2.47
Facility 2.47
IL AVG 3.10
Rank #129 / 172
-11%-20%
$354.9k
Facility $354.9k
IL AVG $151.3k
Rank #172 / 173
46
Facility 46
IL AVG 36.8
Rank #124 / 172
4.2
Facility 4.2
IL AVG 3.7
Rank #129 / 172
10122-
87
Facility 87
IL AVG 51
Rank #55 / 648
Joseph Kowalczyk
$5.6M
Facility $5.6M
IL AVG $12.2M
Rank #159 / 171
$2.8M
Facility $2.8M
IL AVG $4.8M
Rank #161 / 171
50.2%
Facility 50.2%
IL AVG 44.3%
Rank #55 / 171
146053

Financial Assistance for
Nursing Home in Illinois

The Pearl of Rolling Meadows is located in Rolling Meadows, Illinois.
Here are the financial assistance programs available to residents in Illinois.

Get Financial aid guidance

Community Care Program

Illinois CCP

Age 60+
General Illinois resident, at risk of nursing home placement.
Income Limits (2025) ~$1,215/month individual
Asset Limits $17,500 individual, excludes home, car
IL

High demand in urban areas; waitlists possible.

Benefits
In-home care (3-5 hours/day) Adult day services ($65/day) Emergency home response systems ($30/month)

Illinois Respite Program

IL Respite (via NFCSP)

Age Caregiver of someone 60+ (or with dementia)
General Illinois resident.
Income Limits No strict limit; prioritizes low-income.
Asset Limits Not applicable.
IL

Limited slots; urban/rural balance.

Benefits
In-home respite (4-6 hours/day) Adult day care (~$65/day) Short-term facility care (up to 5 days)

Supportive Living Program (SLP)

Illinois Medicaid Supportive Living Program

Age 65+ or 22-64 with disability
General Illinois resident, Medicaid-eligible, needs moderate assistance (not nursing home-level).
Income Limits (2025) ~$2,829/month (300% FBR, individual); QIT allowed.
Asset Limits $2,000 (individual), $3,000 (couple) (excludes home, car).
IL

~200 SLP sites statewide; room/board not covered.

Benefits
Personal care (5-7 hours/day, e.g., bathing, mobility) Meals Housekeeping Medication management Respite (~240 hours/year)

Persons Who Are Elderly Waiver

Illinois Medicaid Elderly Waiver

Age 65+
General Illinois resident, Medicaid-eligible, nursing home-level care need.
Income Limits (2025) ~$2,829/month 300% FBR, individual
Asset Limits $2,000 (individual), $3,000 (couple).
IL

Part of HealthChoice Illinois; consumer-directed options available.

Benefits
Personal care (5-7 hours/day, e.g., dressing, eating) Homemaker Adult day care (~$60/day) Respite (240 hours/year) Home mods ($1,000 avg.)

Medicare Savings Program (MSP)

Illinois Medicare Savings Program

Age 65+ or disabled
General Illinois resident, Medicare Part A/B.
Income Limits (2025) ~$2,510/month (QMB), ~$3,380/month (SLMB), ~$3,598/month (QI)—individual.
Asset Limits $9,430 (individual), $14,130 (couple).
IL

Three tiers; no waitlist.

Benefits
Covers Part B premiums ($174.70/month) Deductibles ($240/year) Copays (~20%)

Optional State Supplementation (OSS)

Illinois Optional State Supplementation

Age 65+ or disabled
General Illinois resident, in approved facility, SSI recipient or low-income.
Income Limits (2025) ~$1,004/month including SSI
Asset Limits $2,000 (individual), $3,000 (couple).
IL

~$50-$500/month based on facility type.

Benefits
Cash (~$50-$500/month) for room/board in personal care homes or SLFs

VA Aid and Attendance (A&A) and Housebound Benefits

Illinois VA Aid and Attendance/Housebound

Age 65+ or disabled veteran/spouse
General Illinois resident, wartime service, need for ADL help (A&A) or homebound.
Income Limits (2025) Net income < ~$1,984/month (veteran with dependent, A&A); pension offsets income.
Asset Limits ~$155,356 net worth limit
IL

High veteran demand in urban/rural areas.

Benefits
Cash (~$1,433-$2,642/month veteran, ~$951-$1,318 spouse) for care costs (e.g., in-home, assisted living)

Frequently Asked Questions about The Pearl of Rolling Meadows

Is The Pearl of Rolling Meadows in a walkable area?

The Pearl of Rolling Meadows has a walk score of 50. Moderately walkable. Some errands can be accomplished on foot, with a mix of nearby amenities.

What is the occupancy rate at The Pearl of Rolling Meadows?

The Pearl of Rolling Meadows's occupancy is 78.5%.

What is the best email address for The Pearl of Rolling Meadows?

The team at The Pearl of Rolling Meadows can be reached at [email protected].

Does The Pearl of Rolling Meadows operate as a for-profit or non-profit?

The Pearl of Rolling Meadows is registered as a for-profit.

Are there photos of The Pearl of Rolling Meadows?

Yes — there are 7 photos of The Pearl of Rolling Meadows in the photo gallery on this page.

What is the address of The Pearl of Rolling Meadows?

The Pearl of Rolling Meadows is located at 4225 Kirchoff Rd, Rolling Meadows, IL 60008.

What is the phone number of The Pearl of Rolling Meadows?

(847) 397-2400 will put you in contact with the team at The Pearl of Rolling Meadows.

Guides for Better Senior Living

Care Cost Calculator: See Prices in Your Area

Nursing Home Data Explorer

Don’t Wait Too Long: 7 Red Flag Signs Your Parent Needs Assisted Living Now

The True Cost of Assisted Living in 2025 – And How Families Are Paying For It

Understanding Senior Living Costs: Pricing Models, Discounts & Financial Assistance