Facility type
Snf

We arrange tours, appointments, and even moving support so you don’t have to


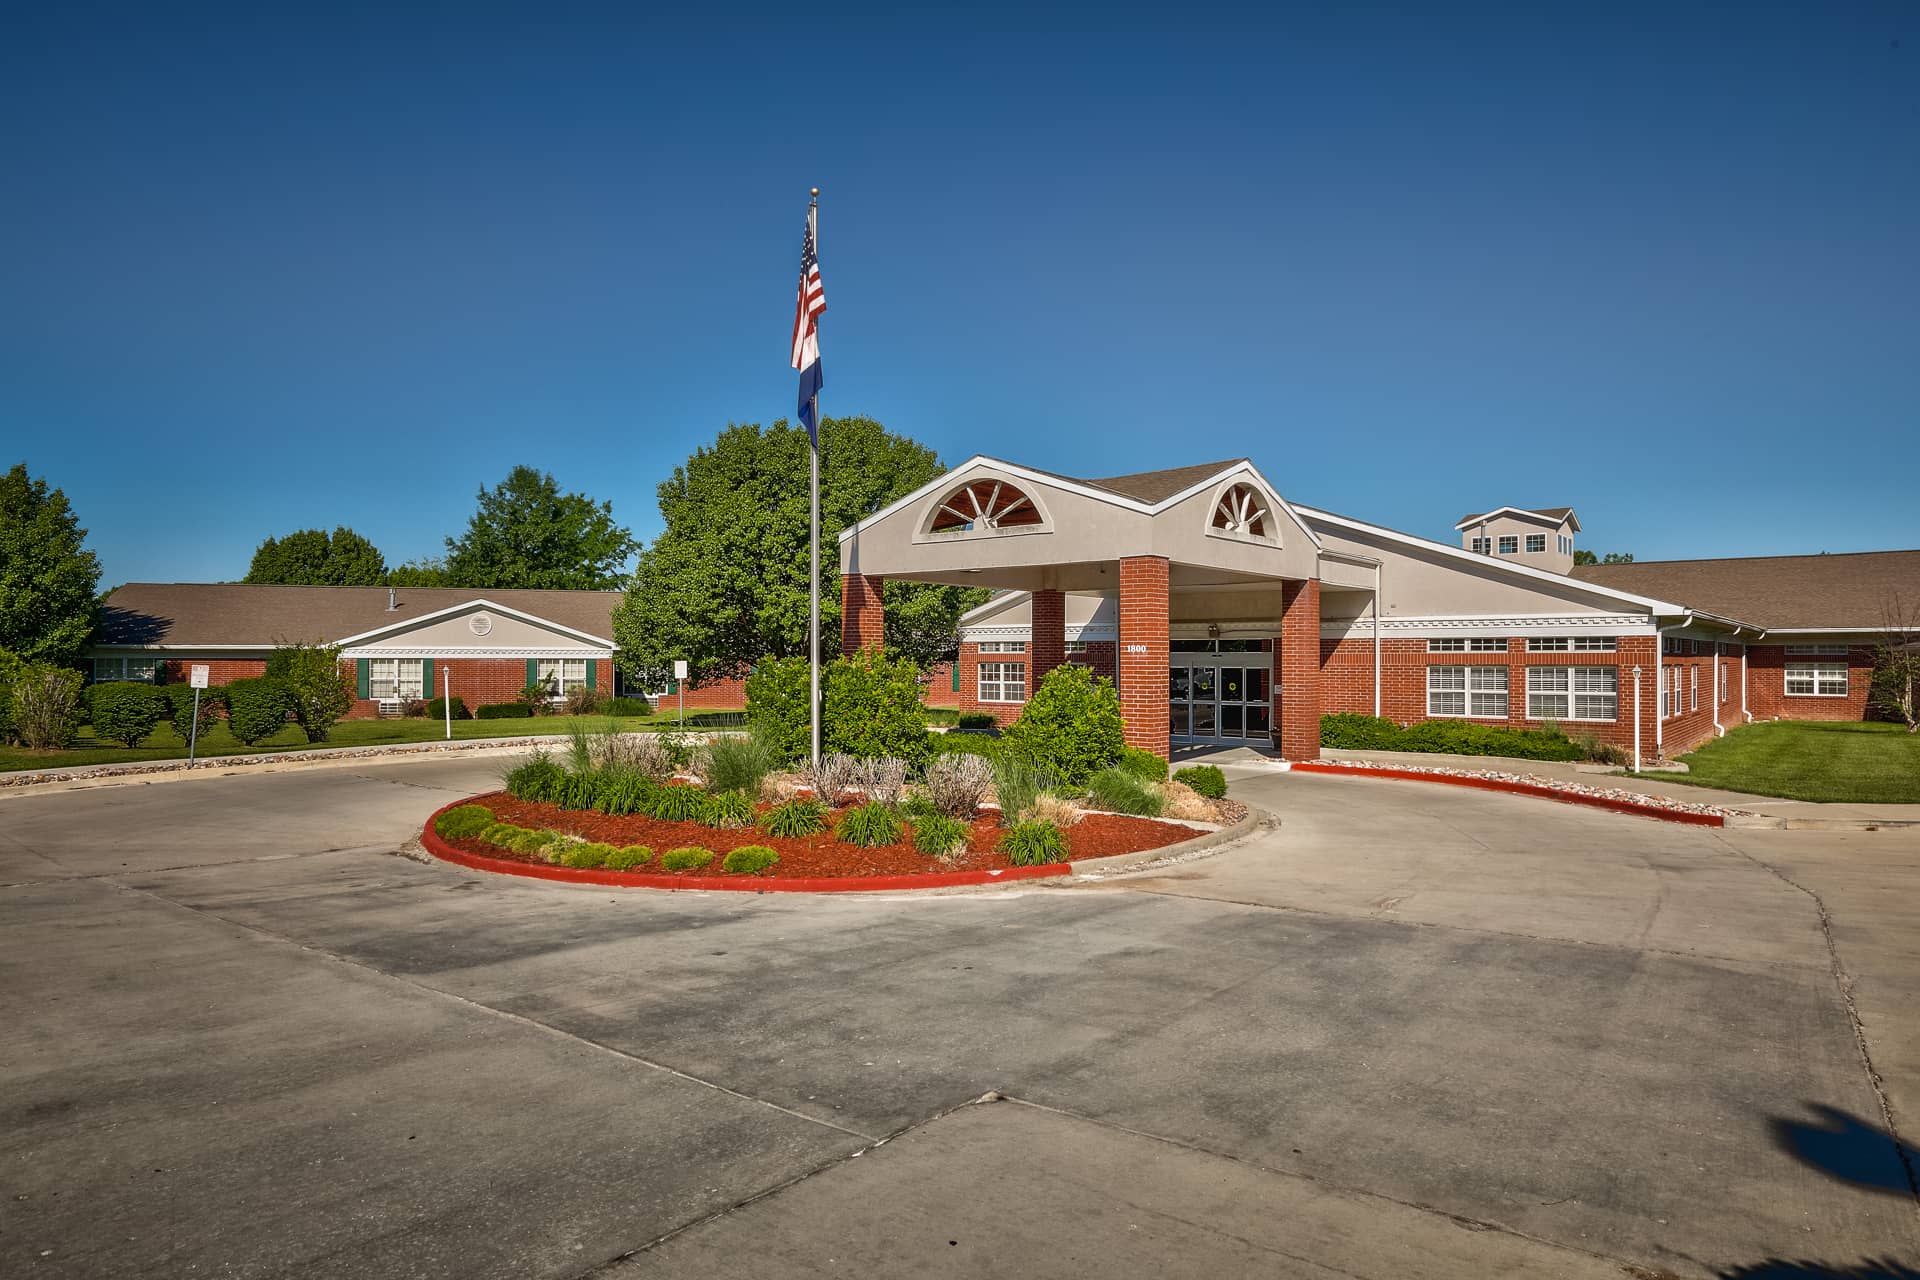

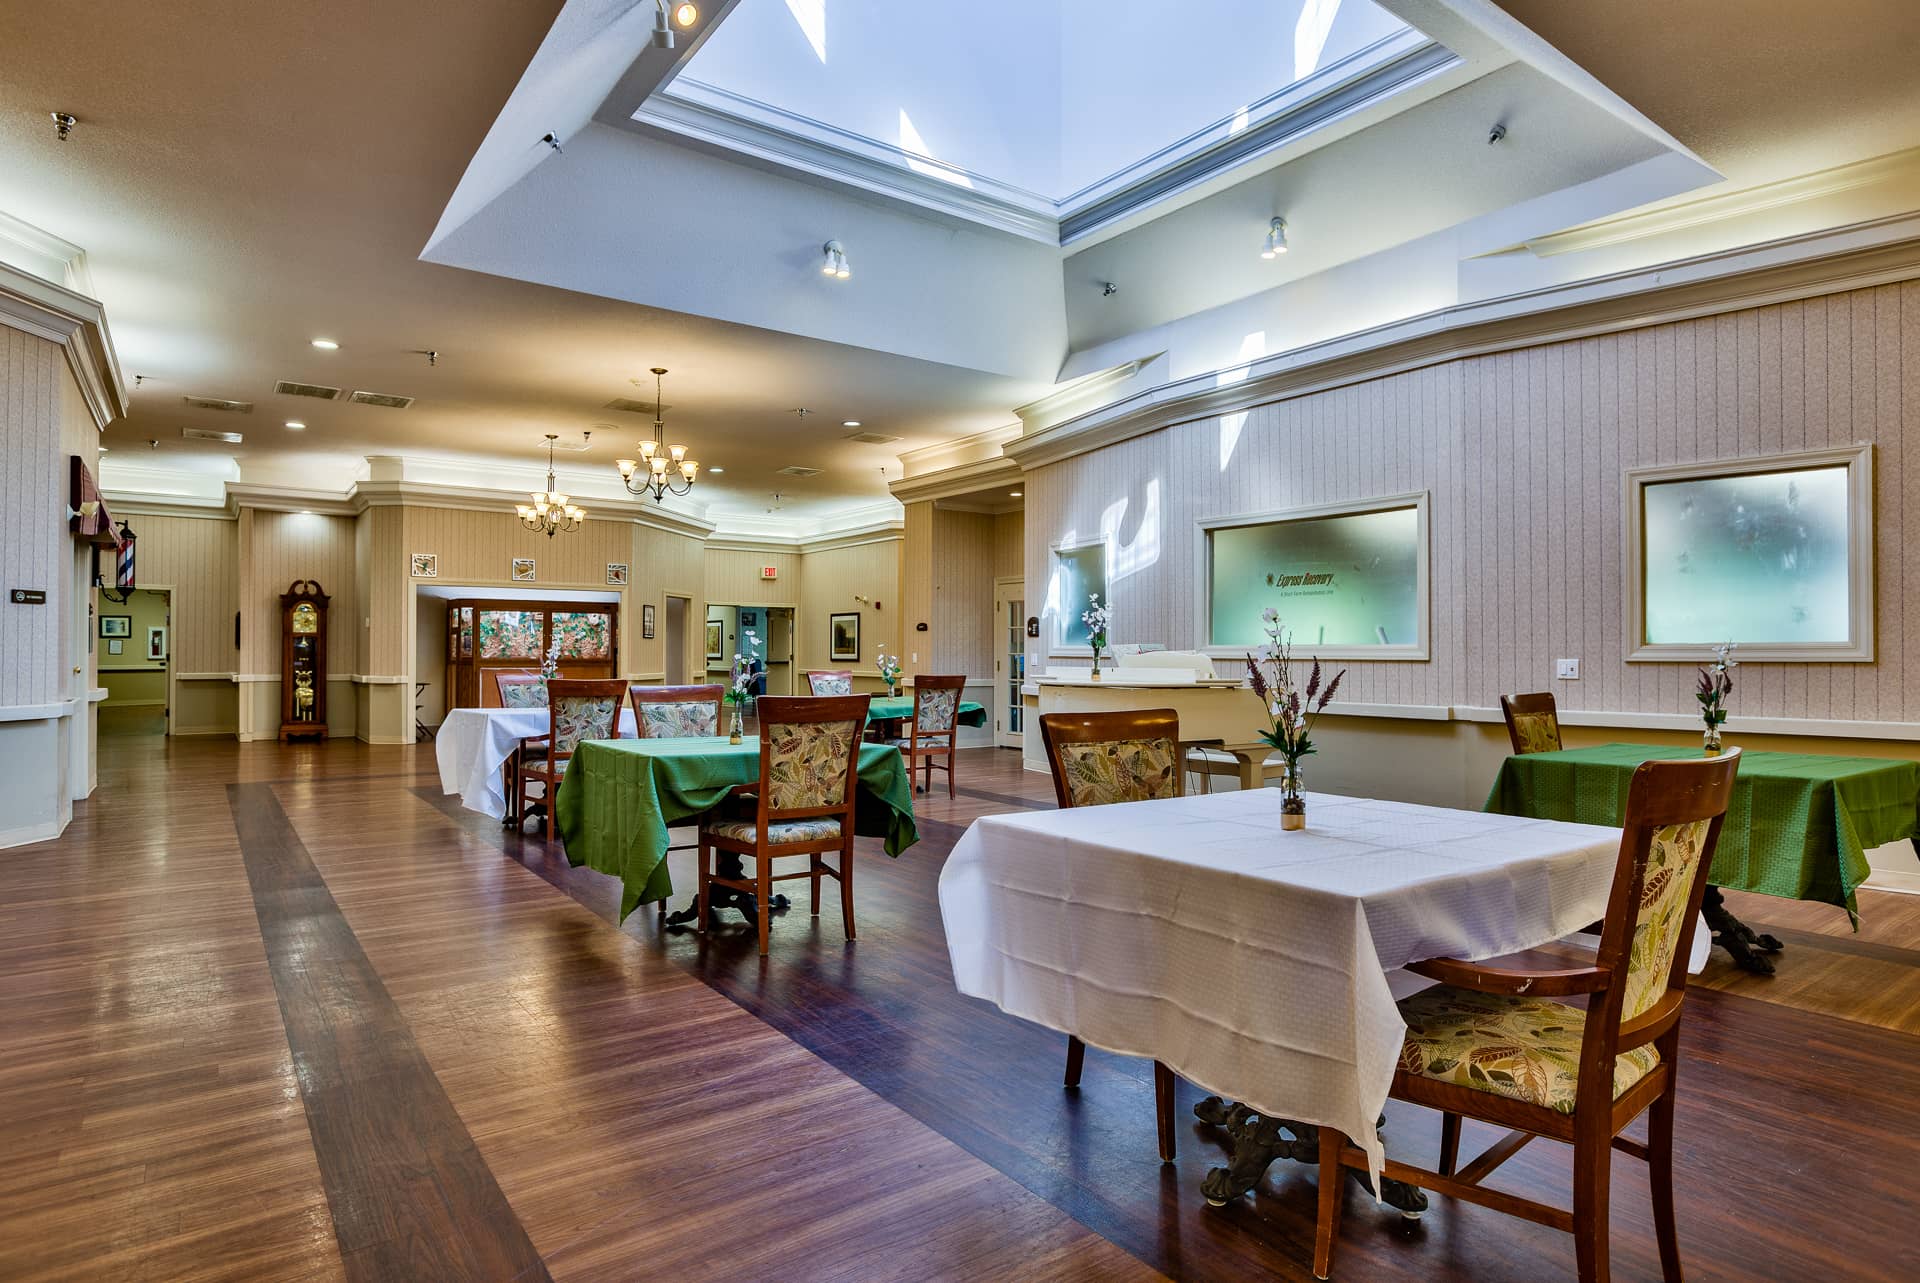
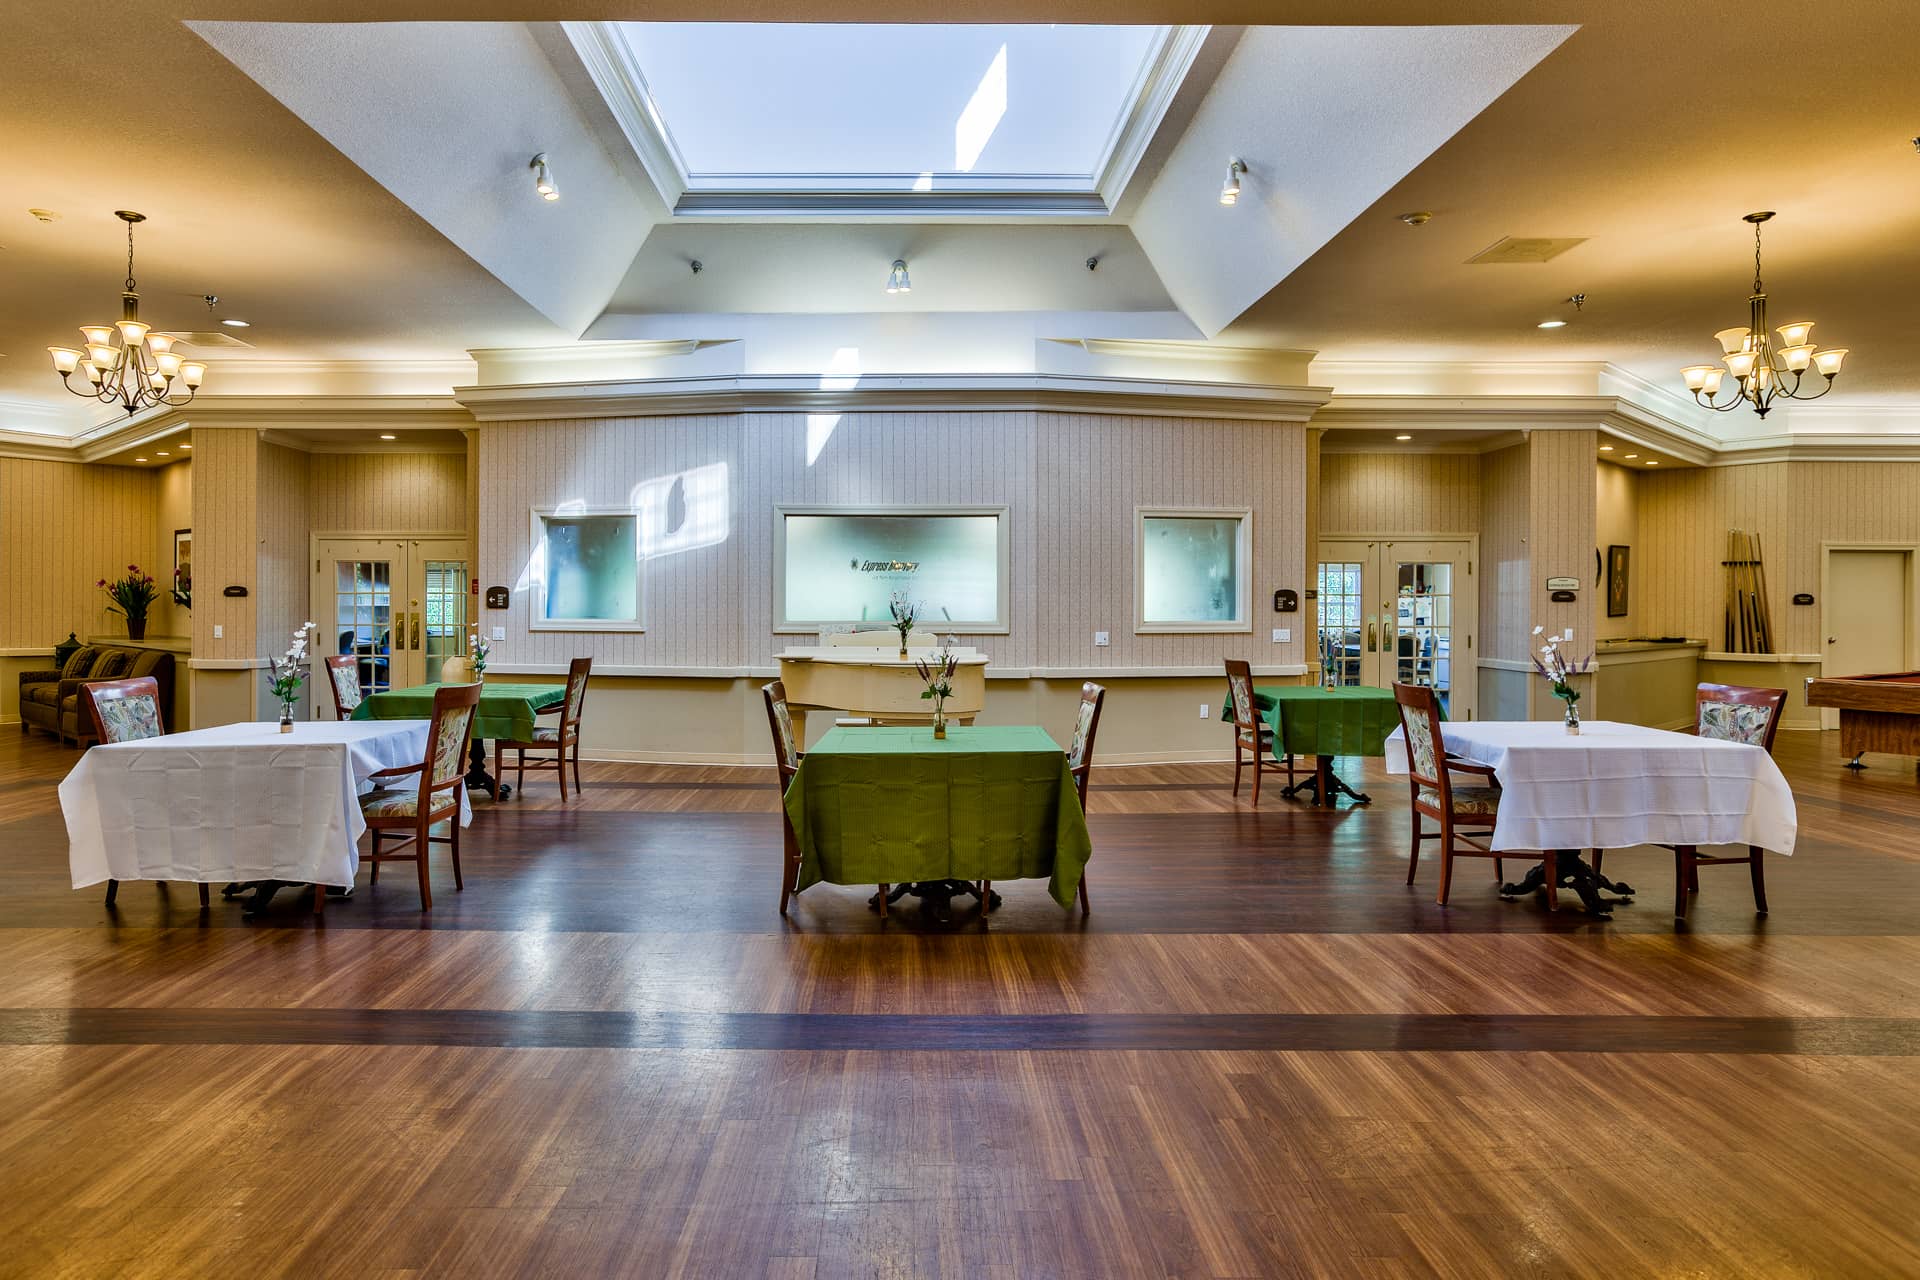
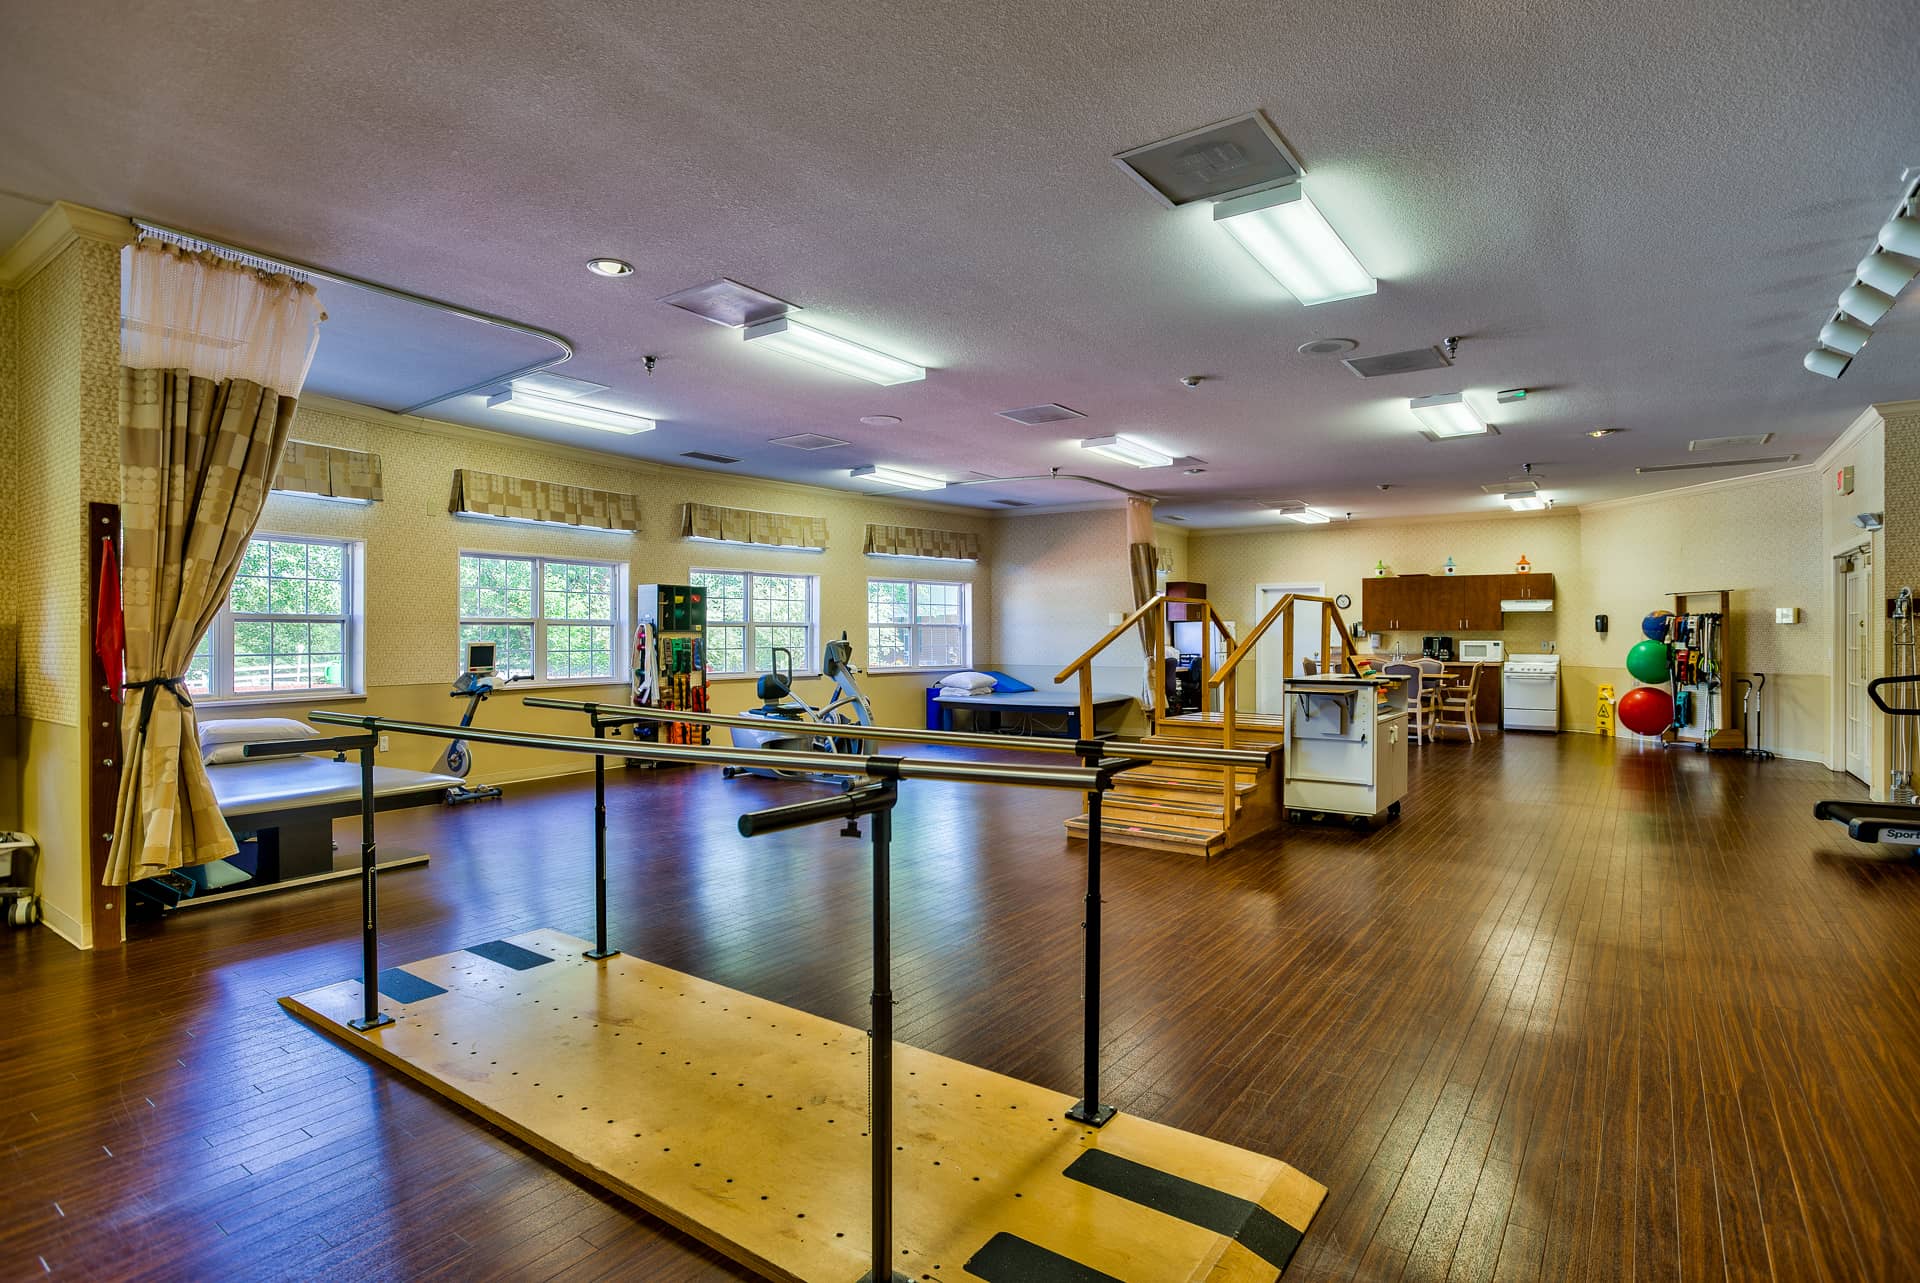
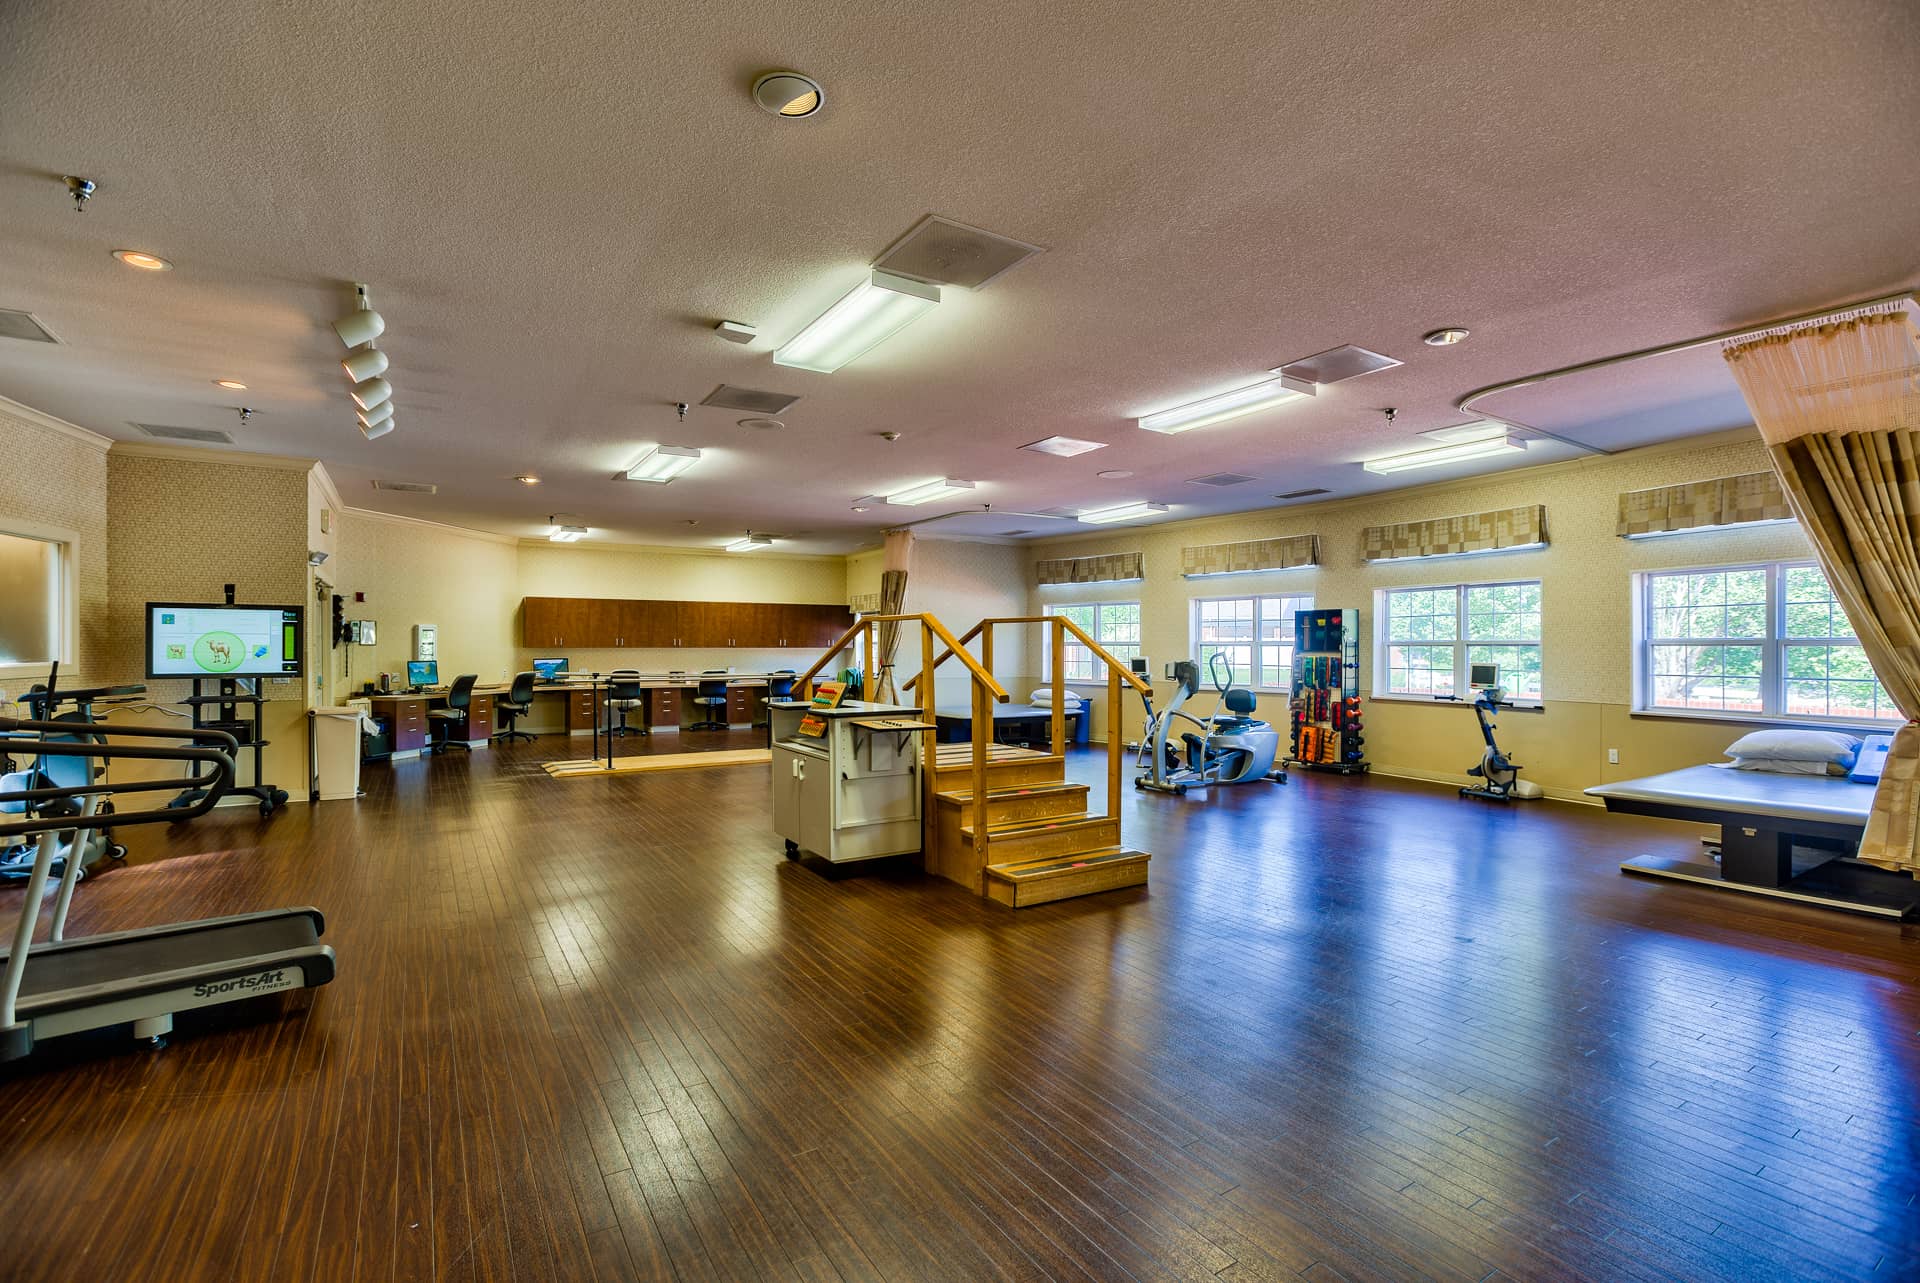
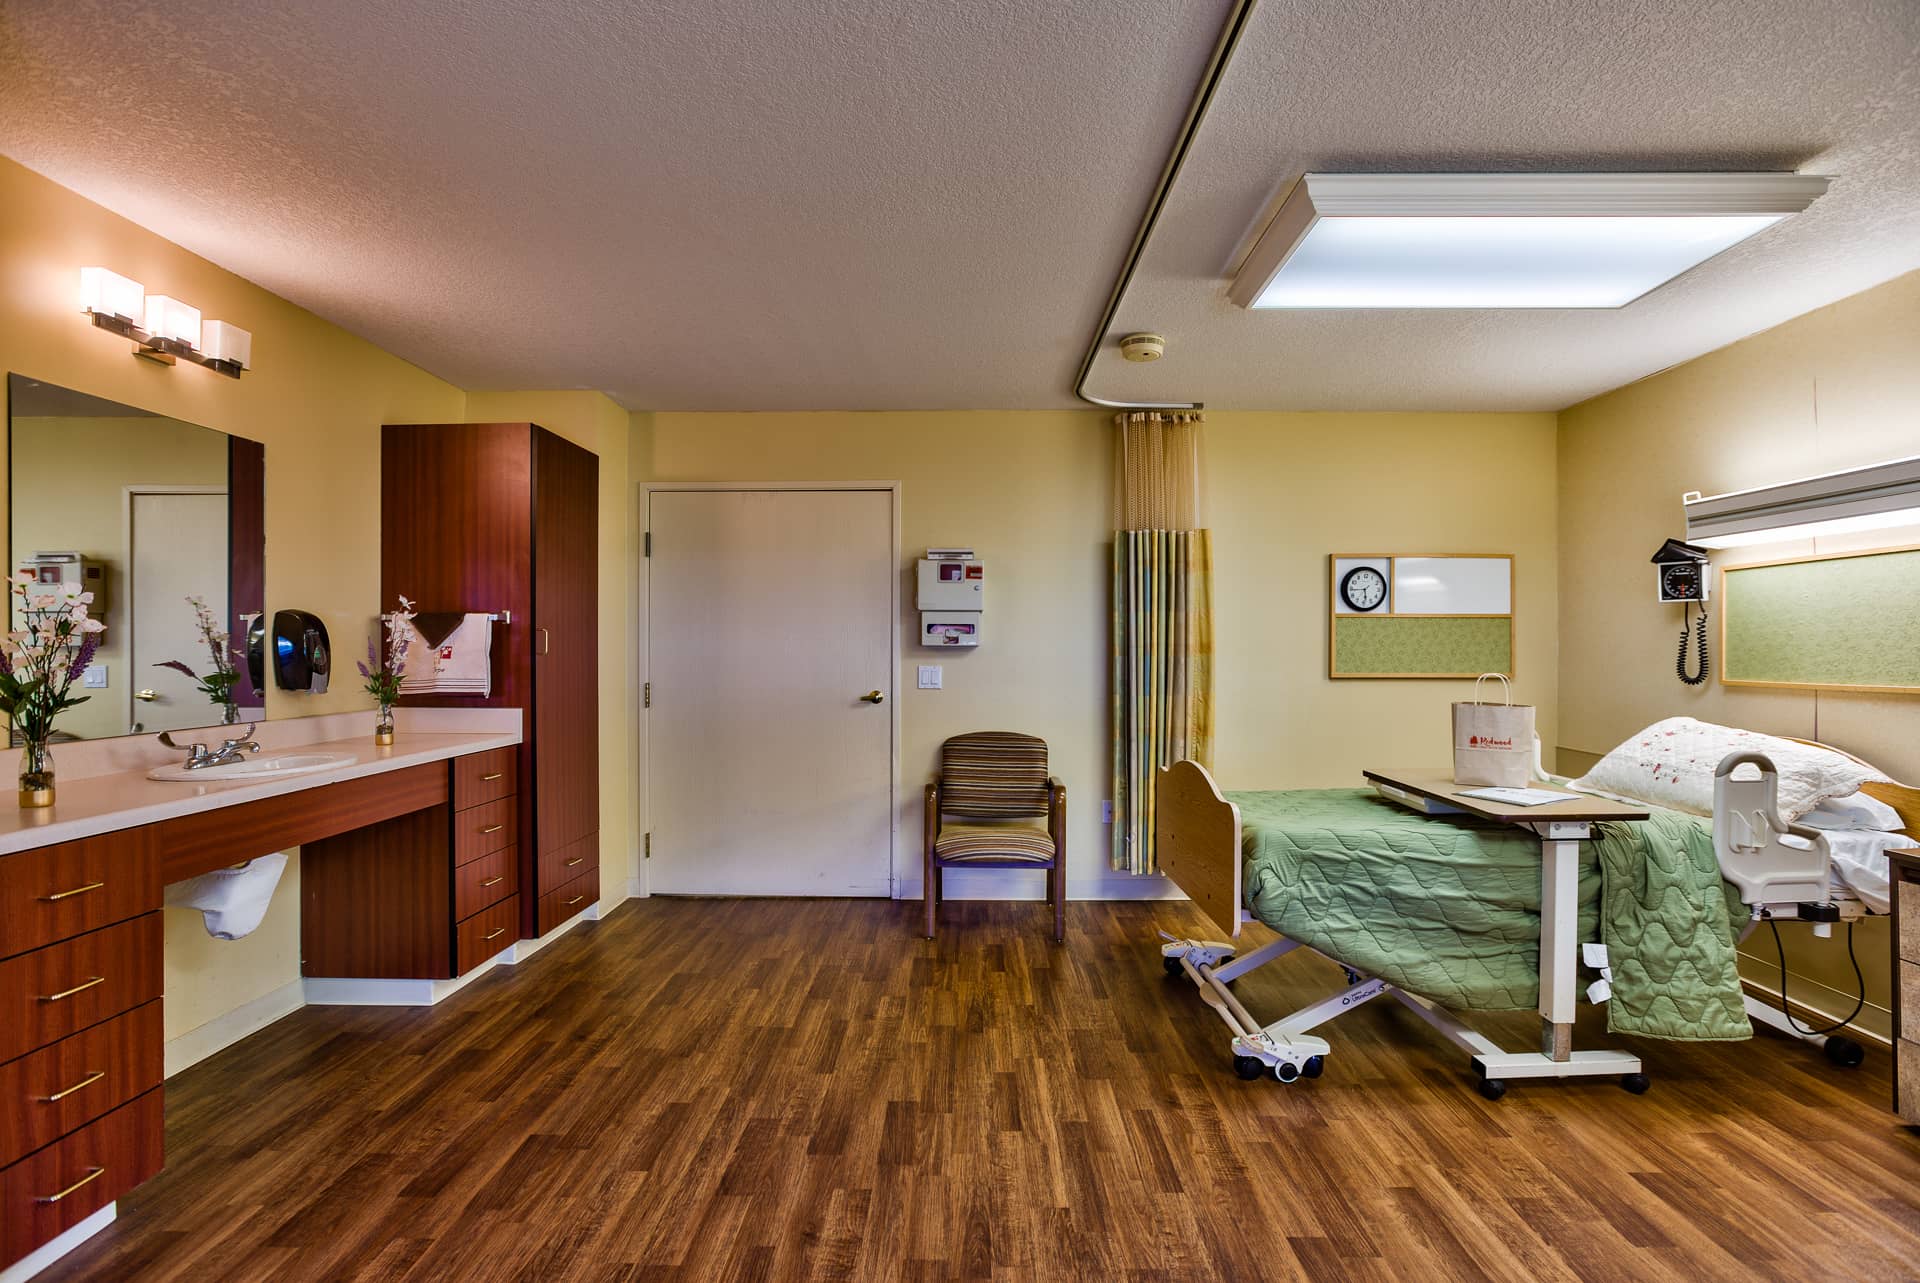
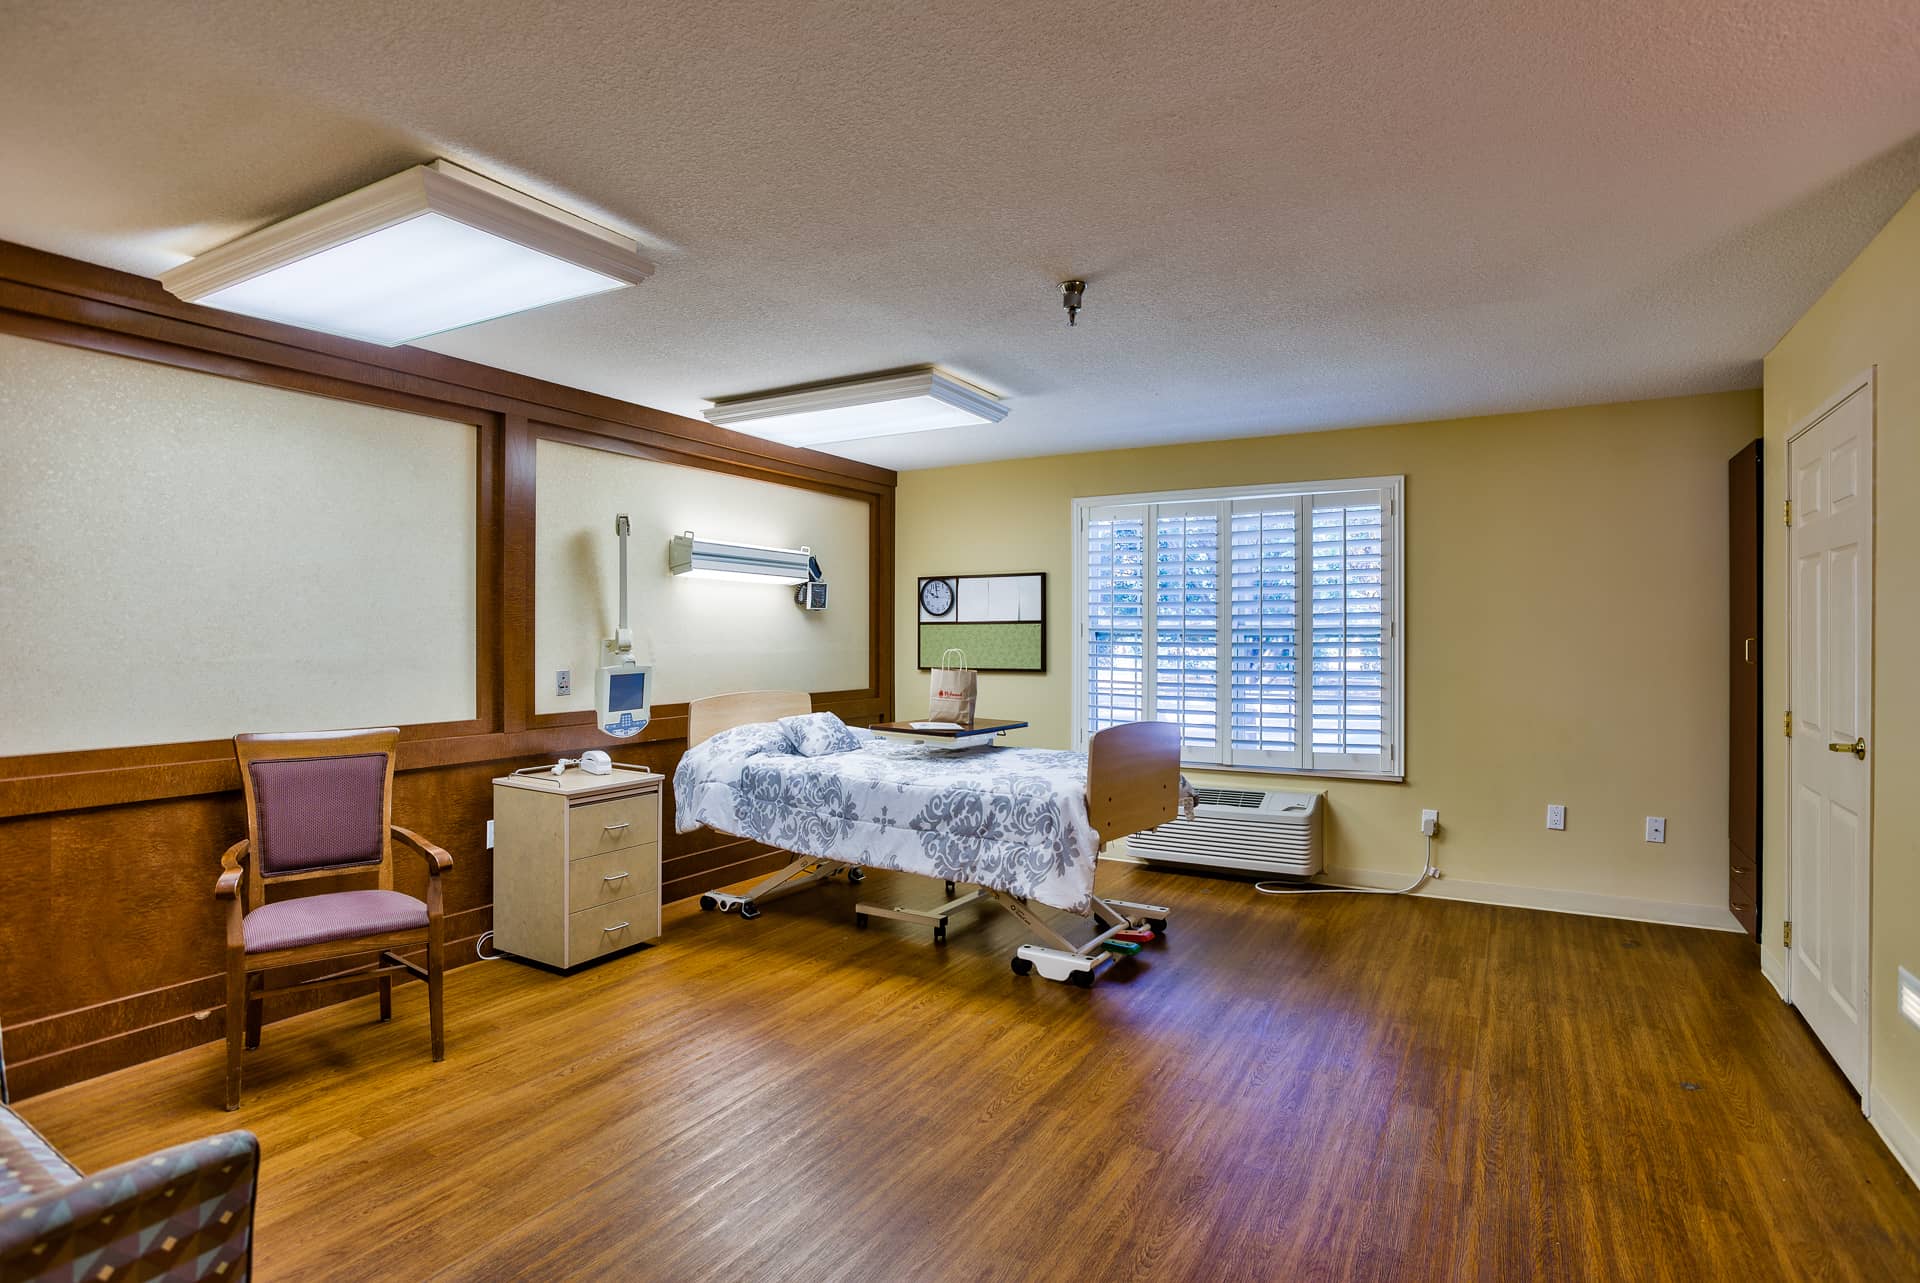

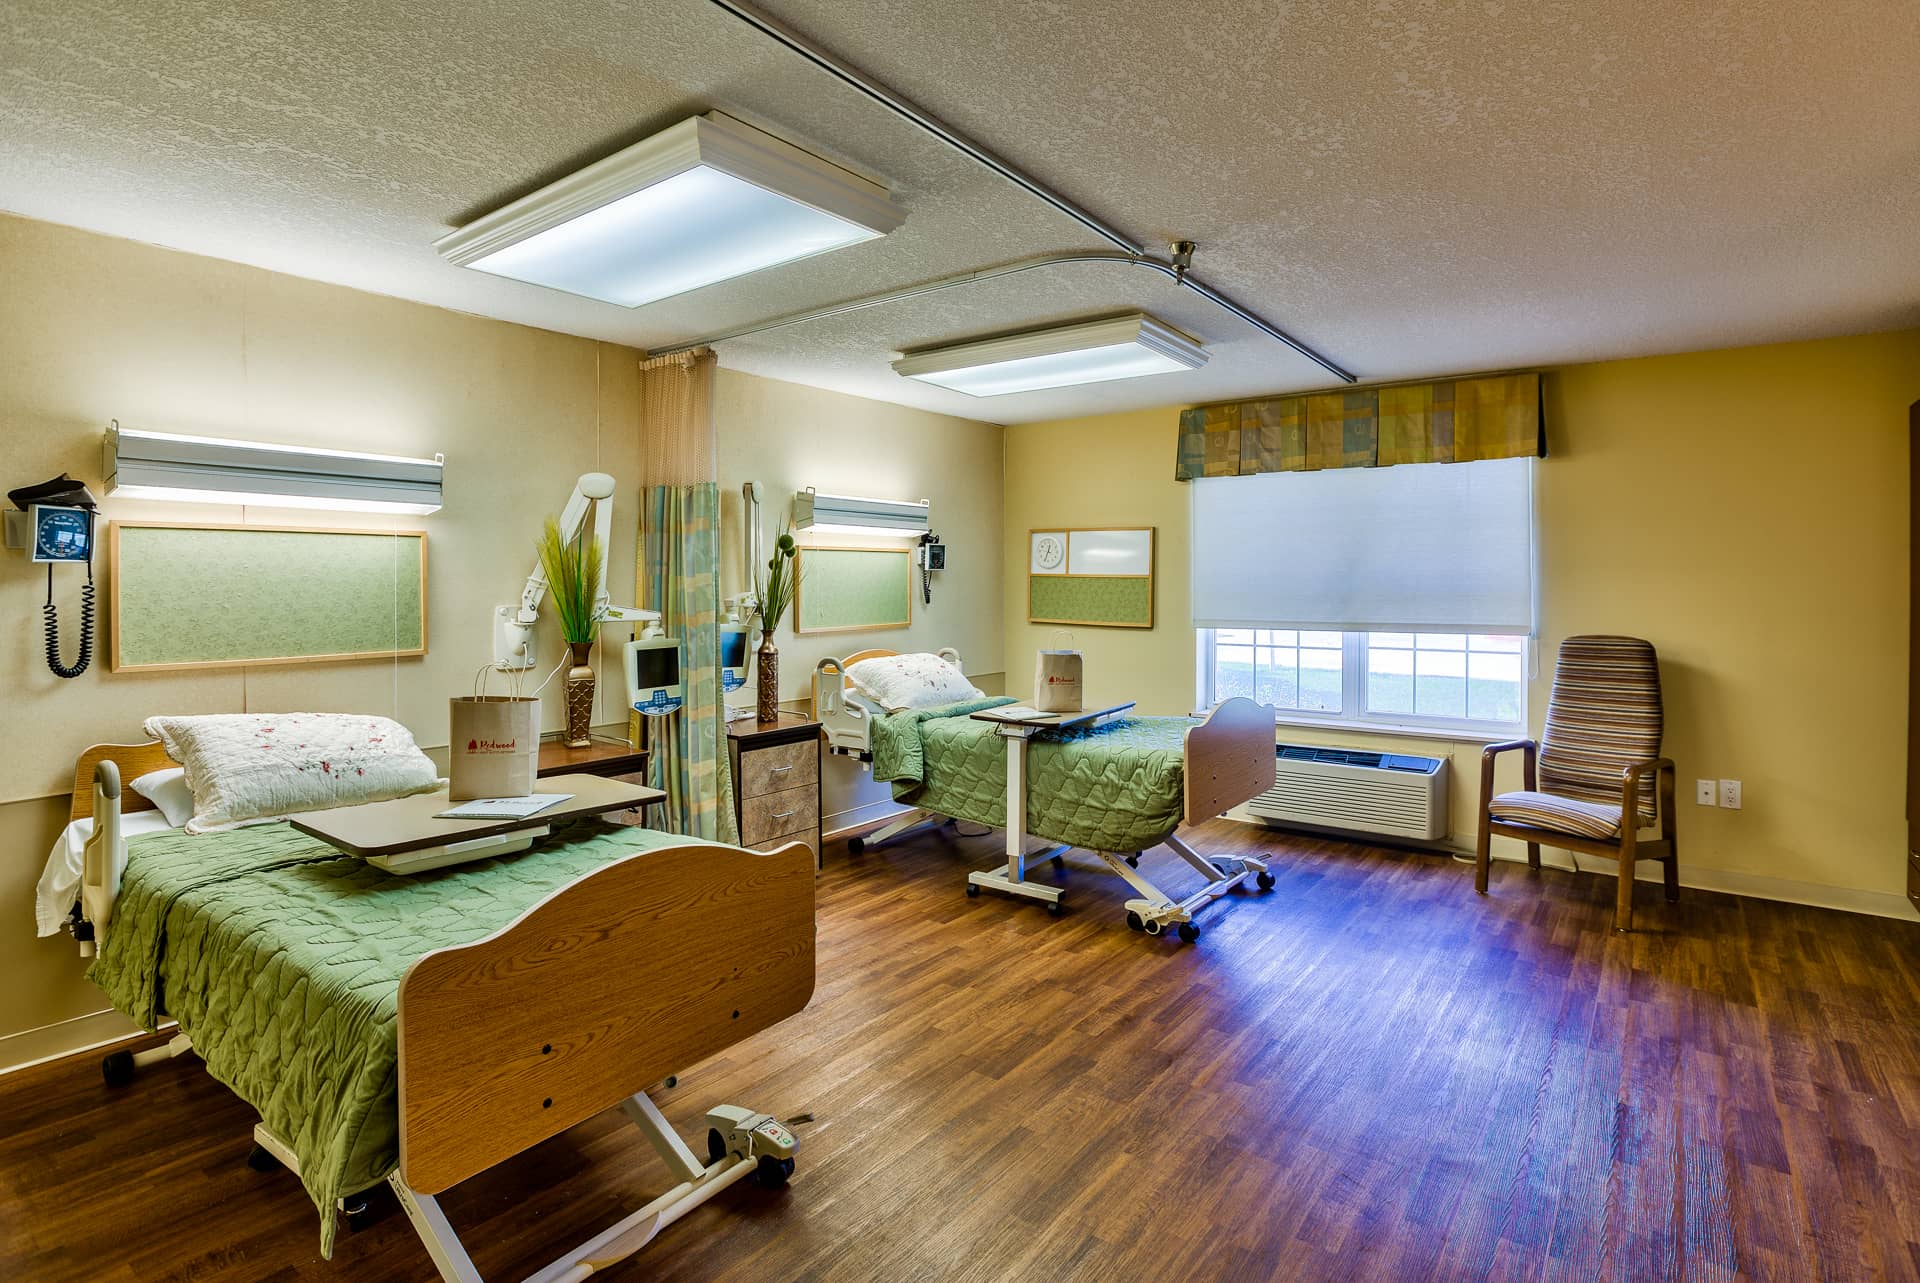
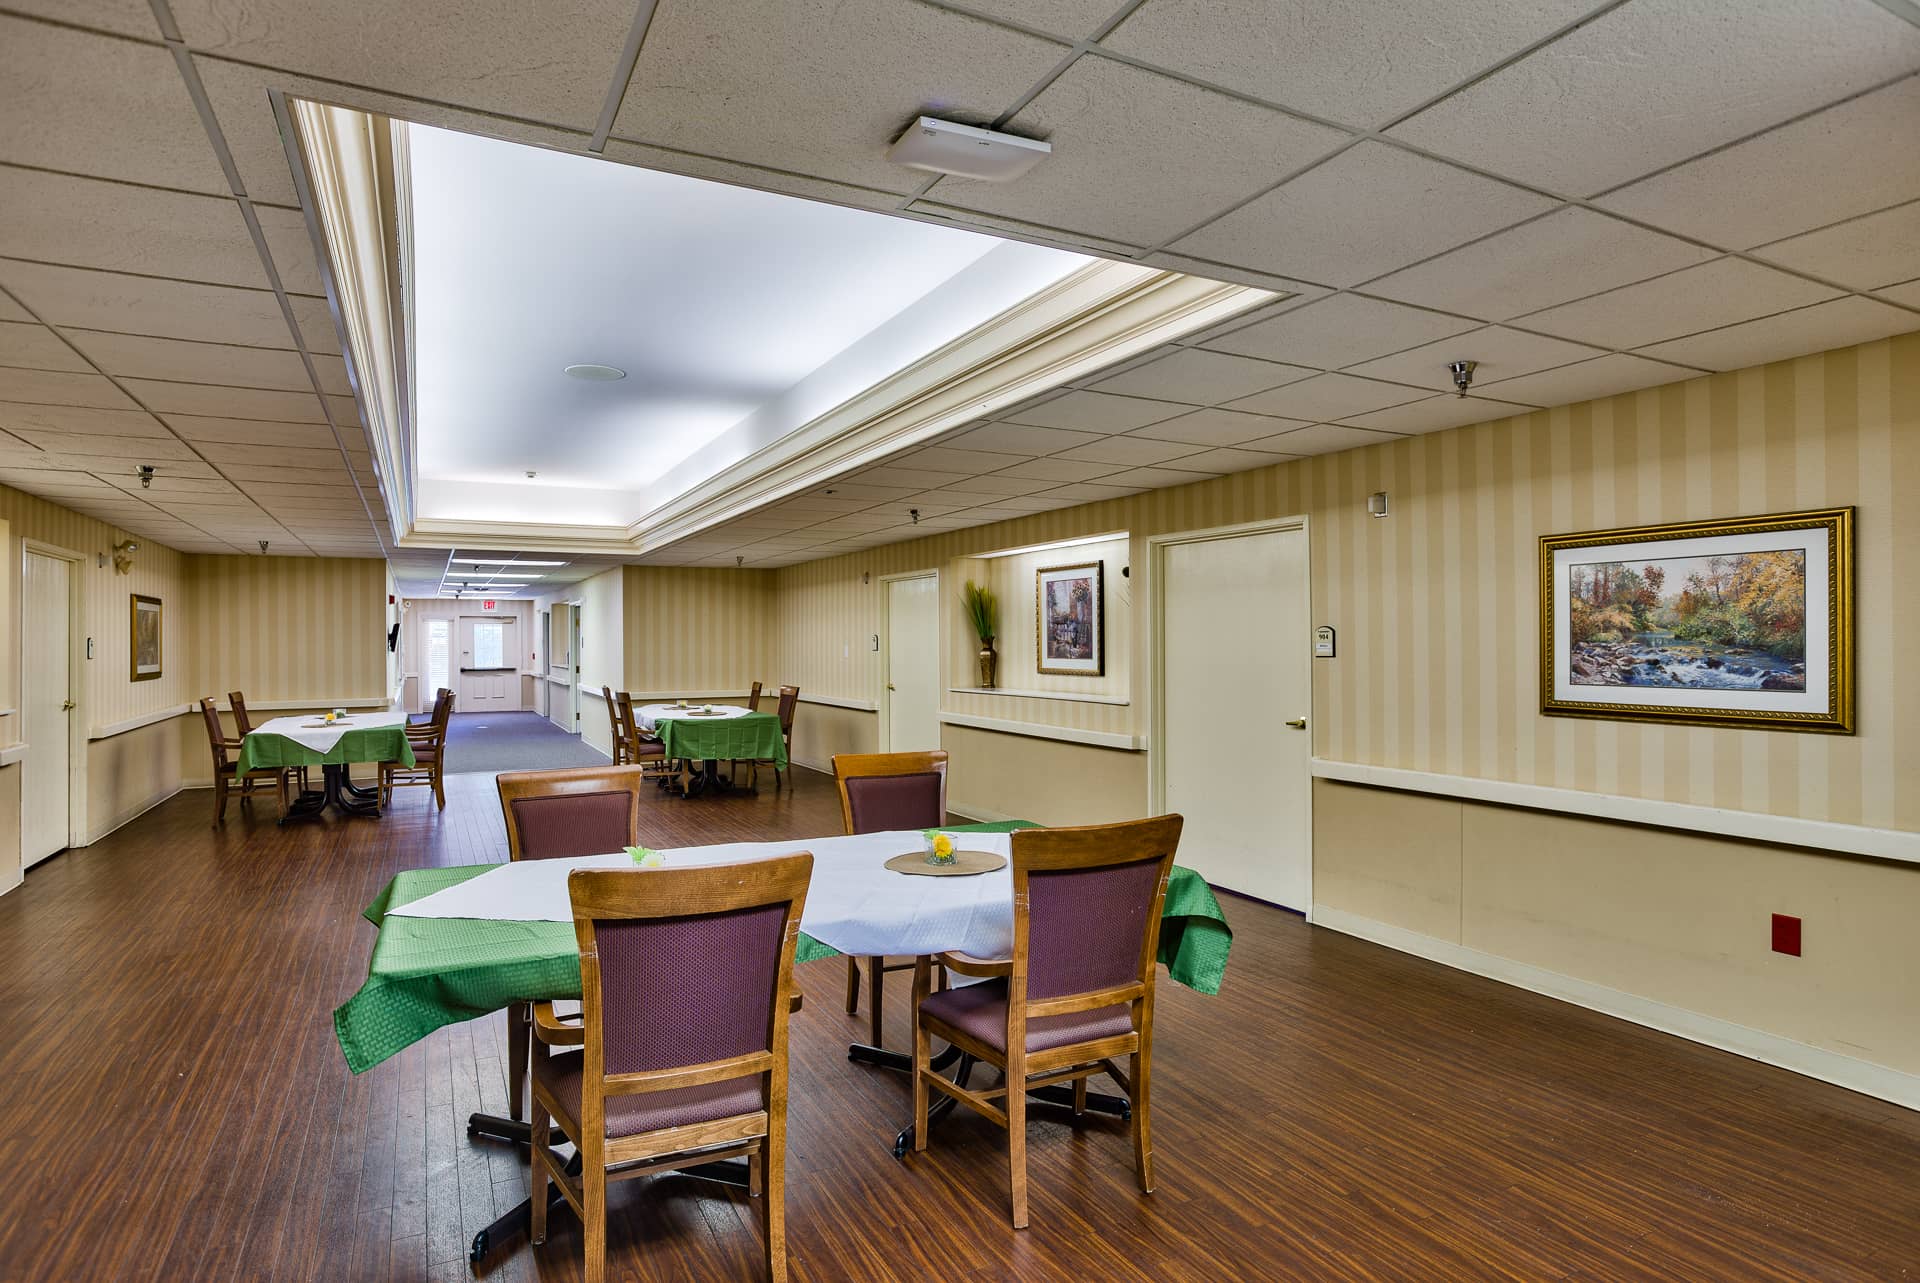
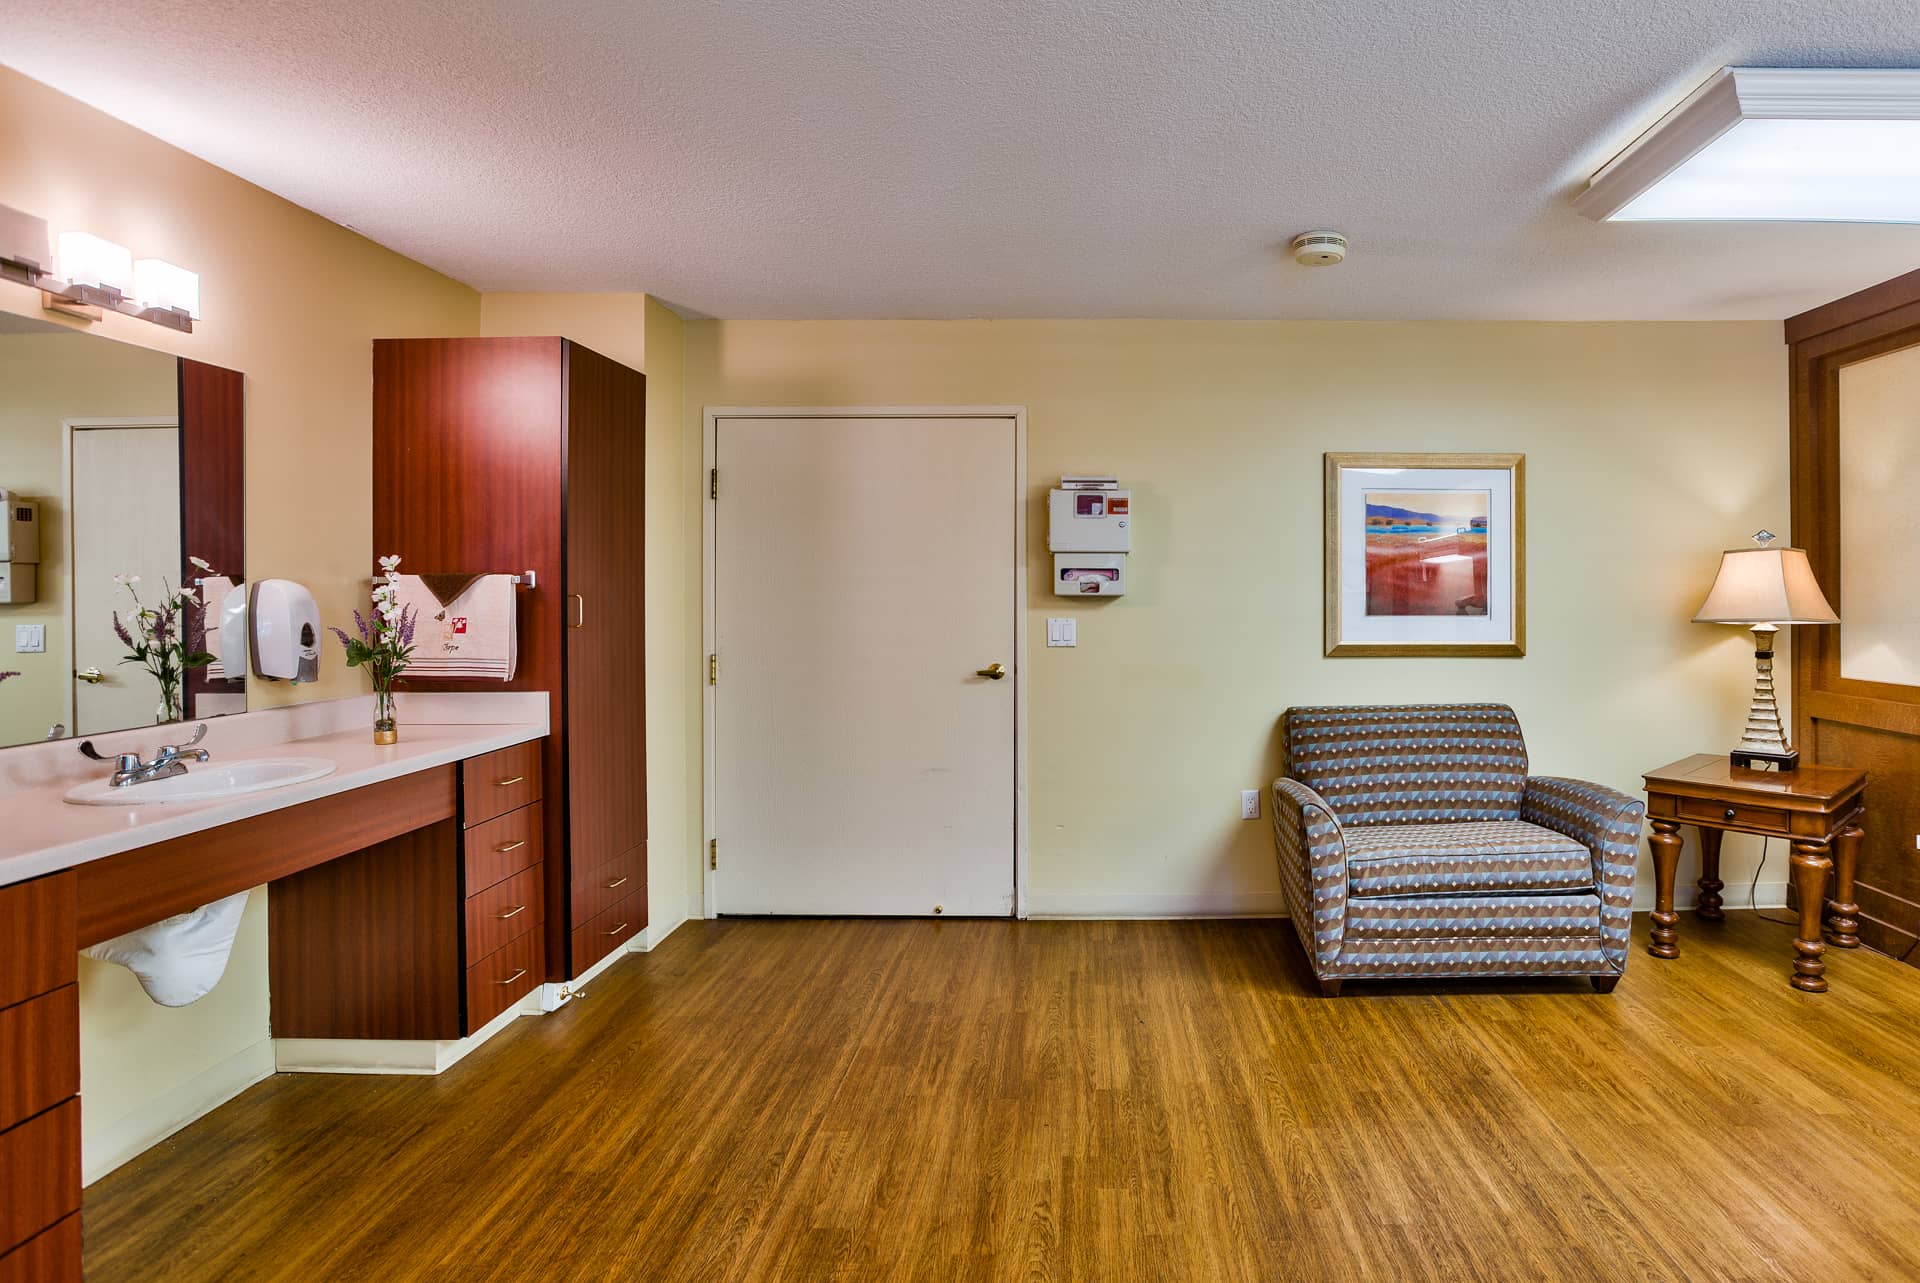
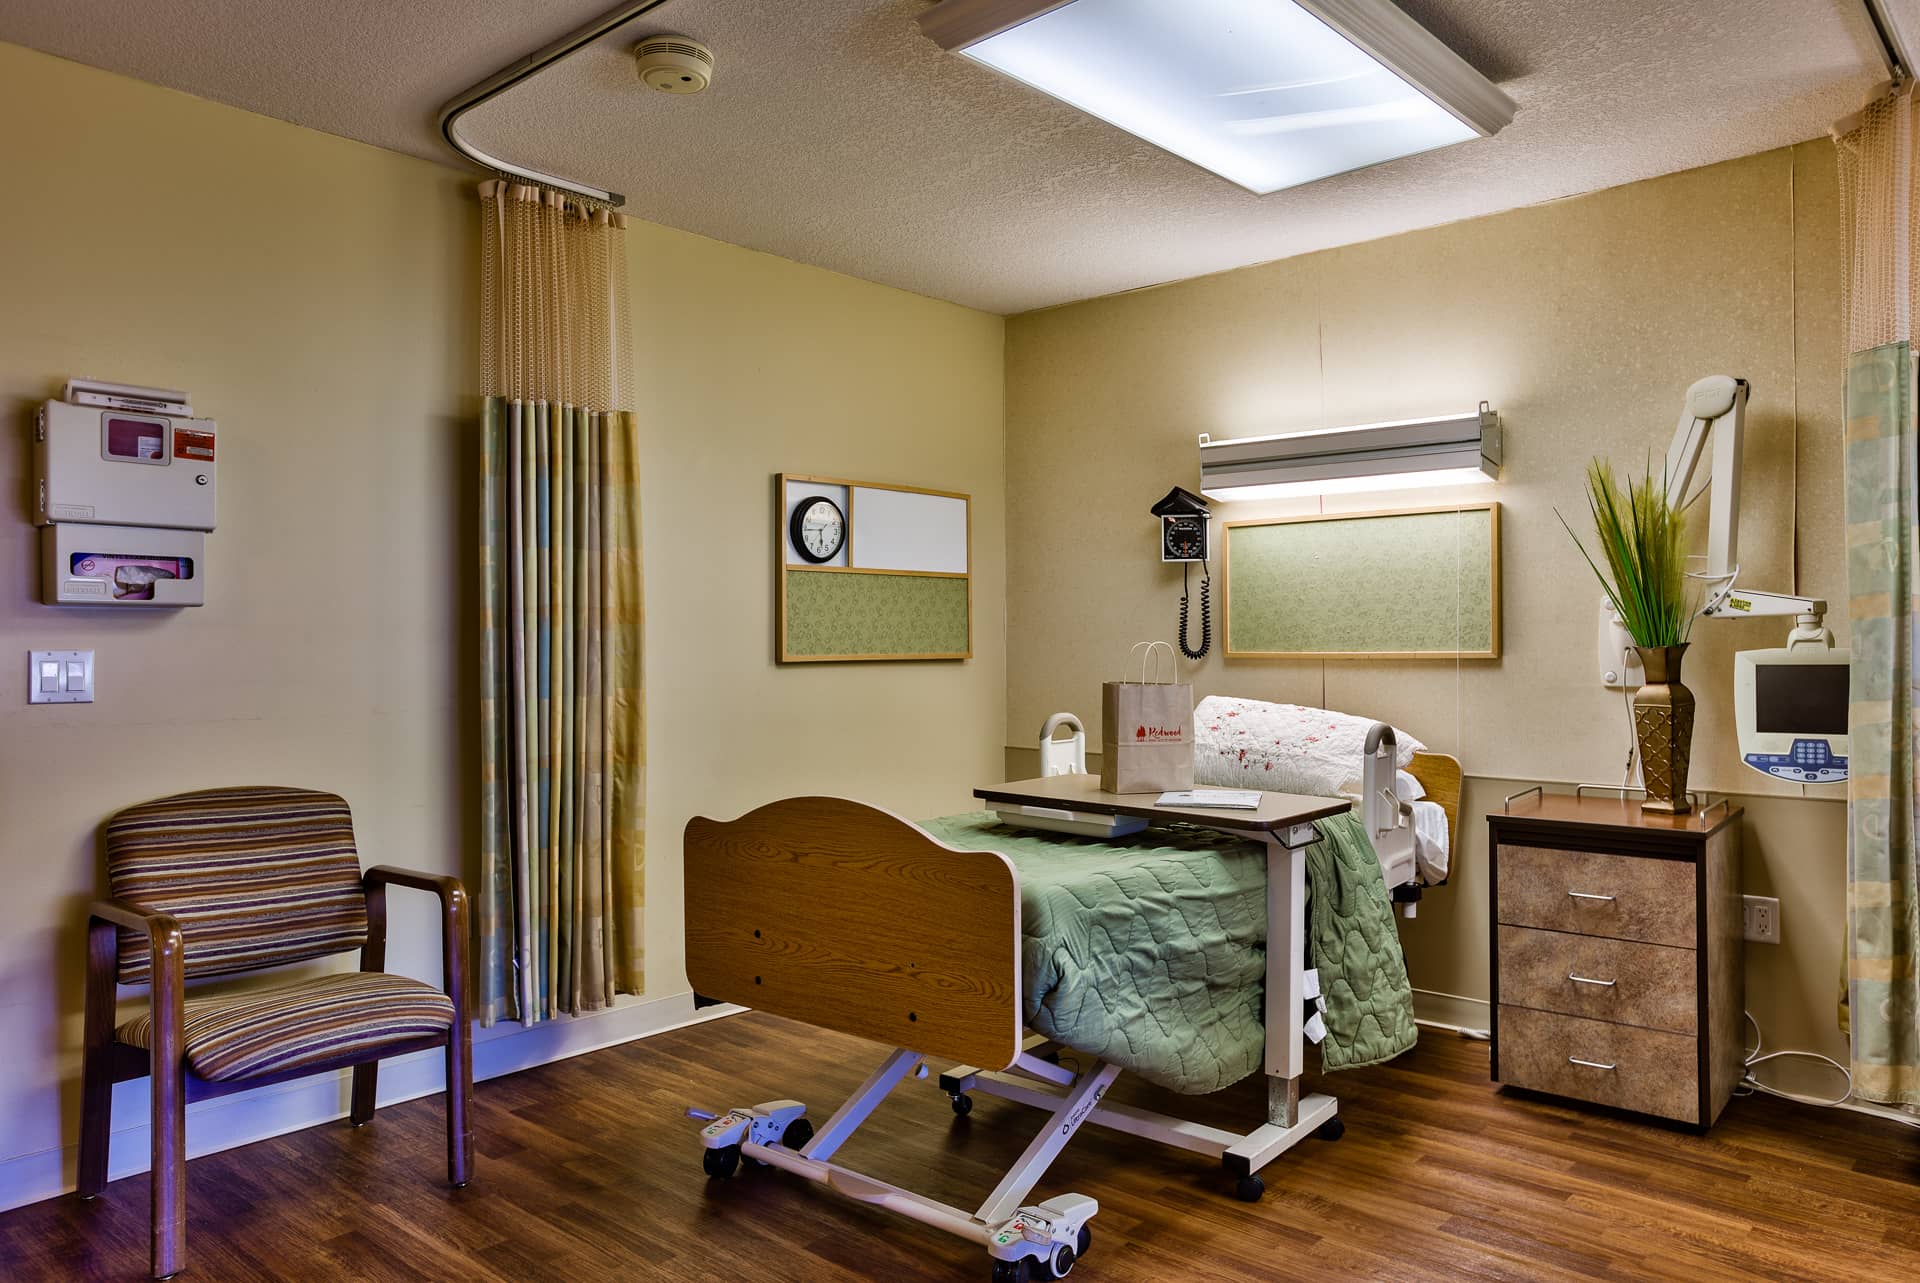
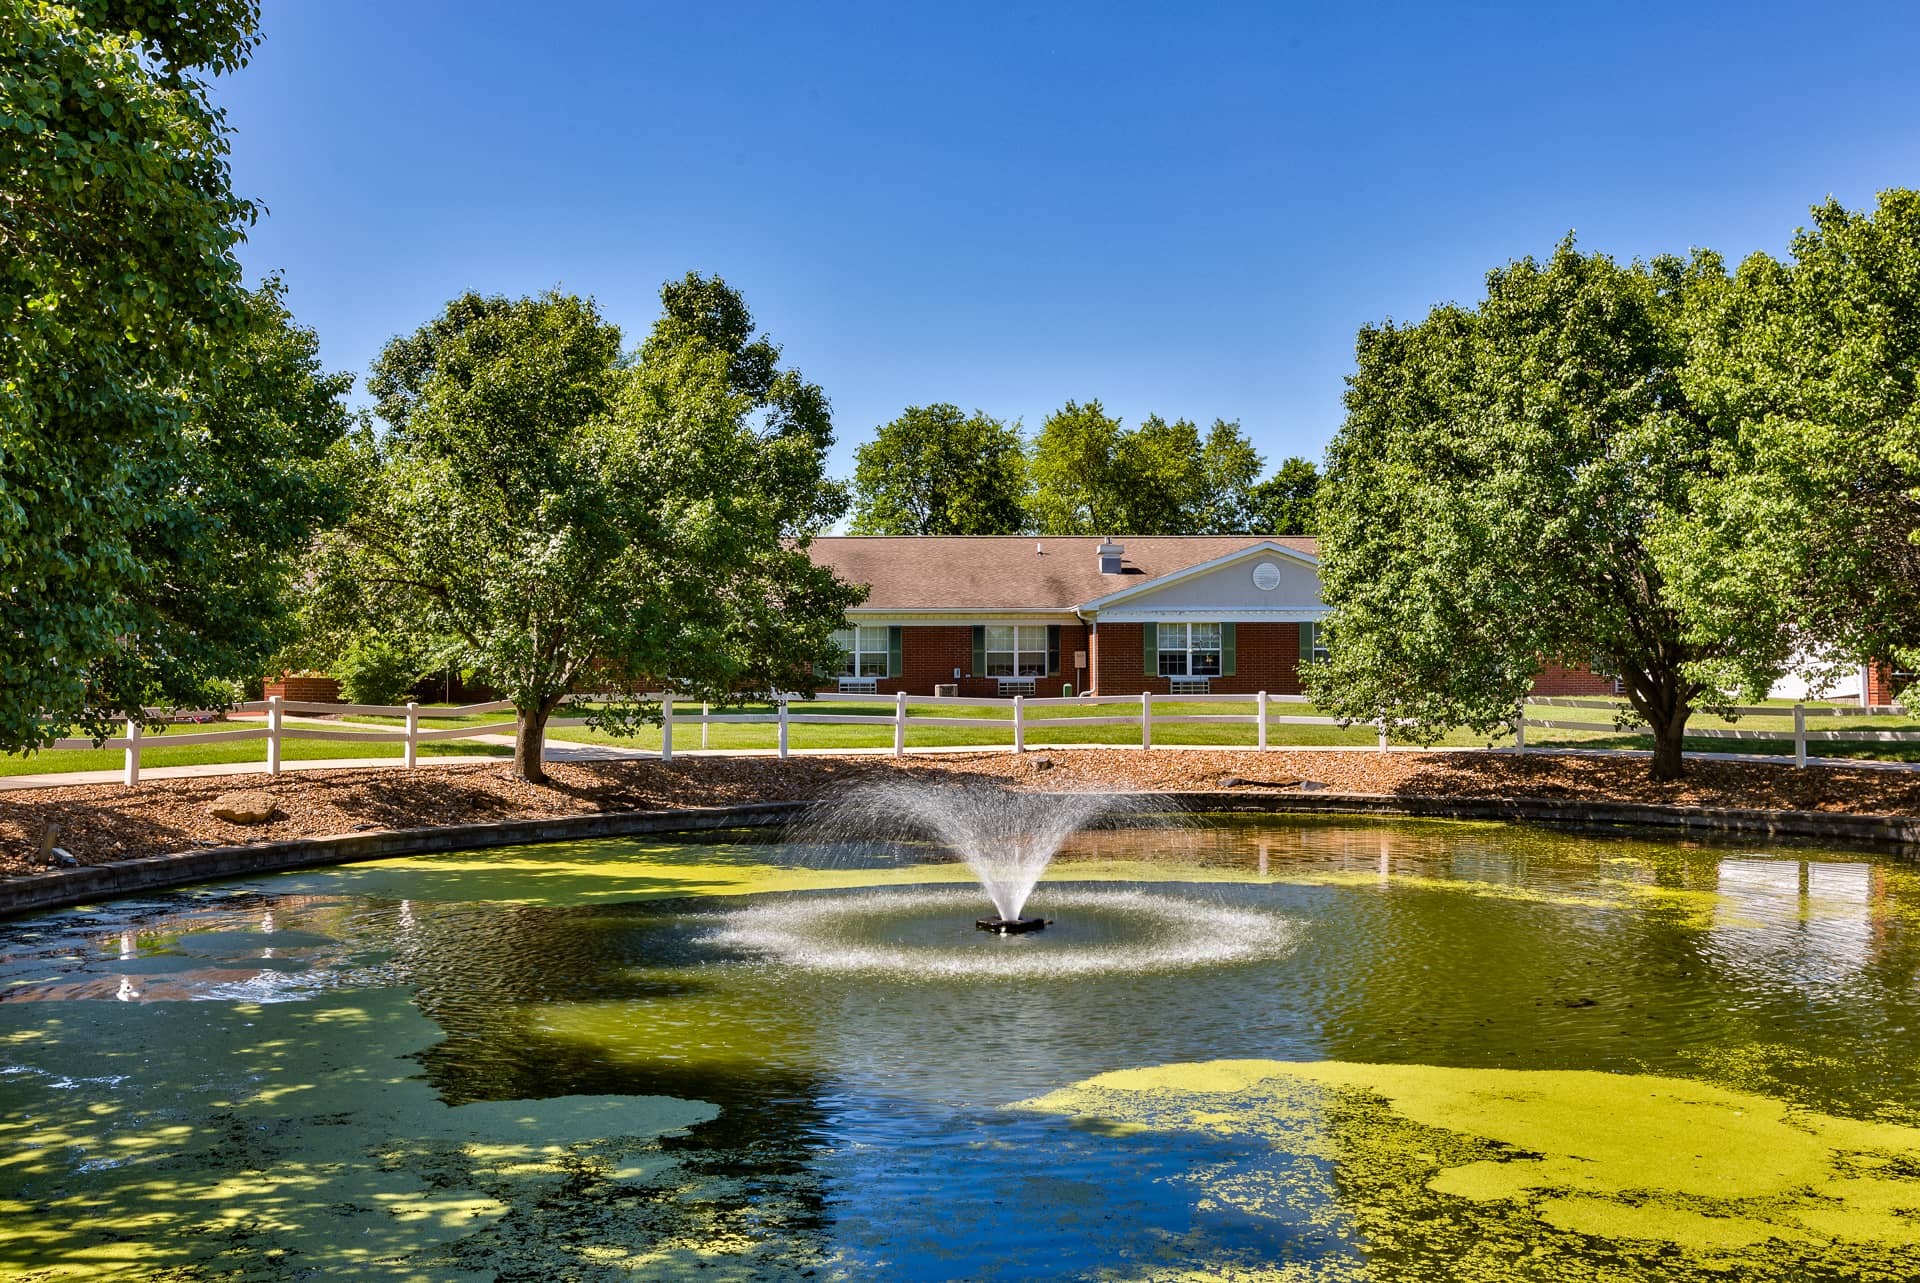
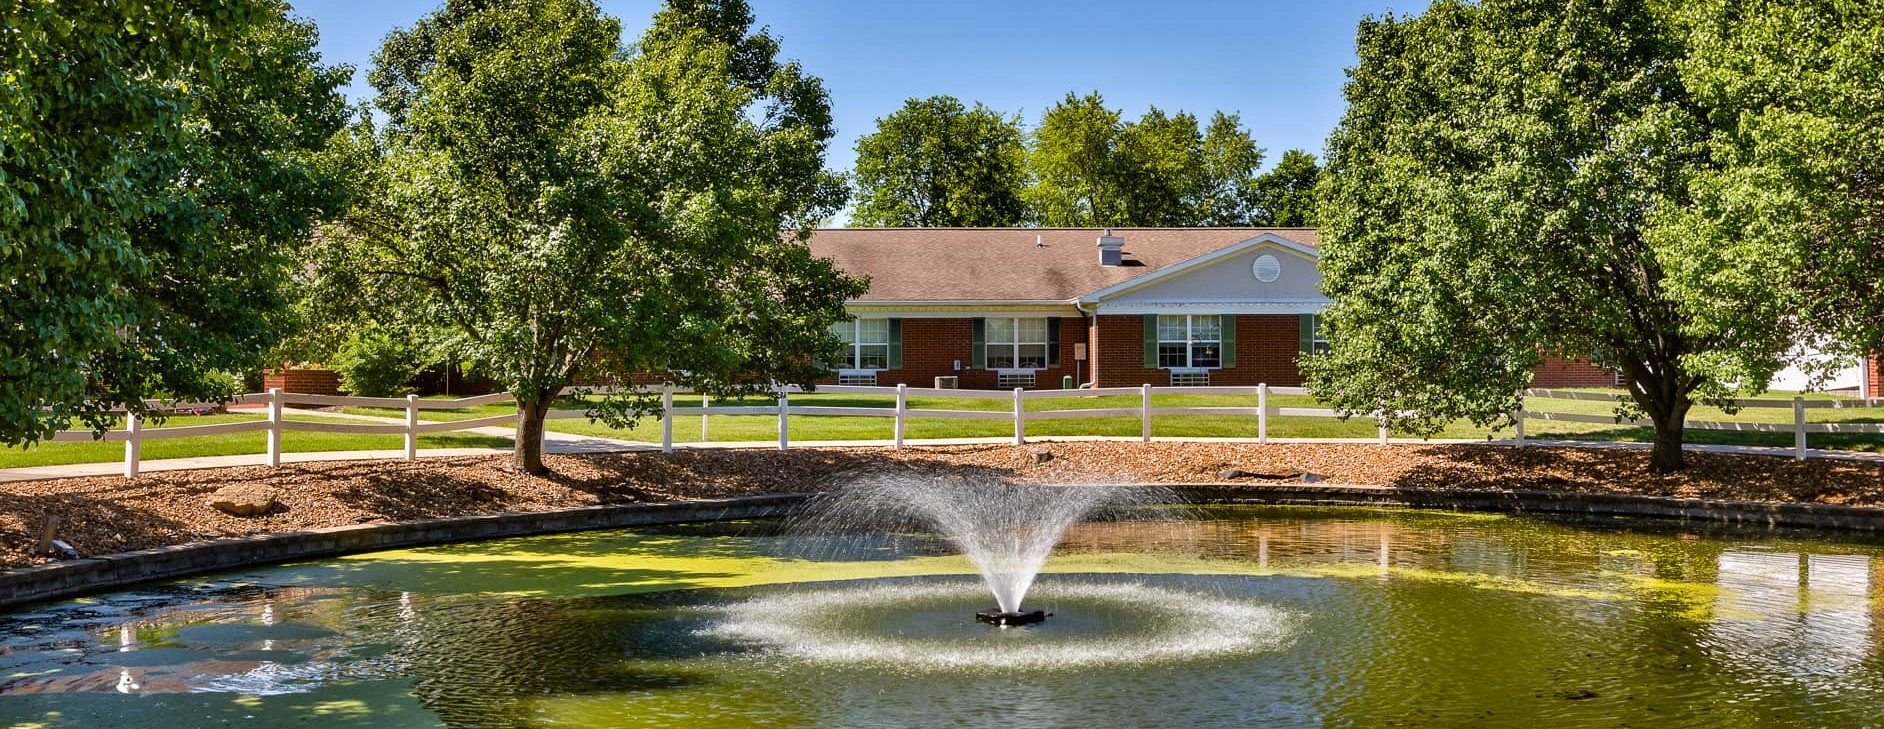
The Rehabilitation Center of Independence focuses on skilled nursing and short-term care for seniors seeking to achieve their goals in a thriving environment. The nursing home is composed of a professional care staff who brings excellence to the recovery of every senior; residents can genuinely feel the high-end quality of care in a nurturing atmosphere. With its professional approach, TRC of Independence aims to change the meaning of skilled nursing and rehabilitation for seniors through the exceptional care the compassionate staff delivers.
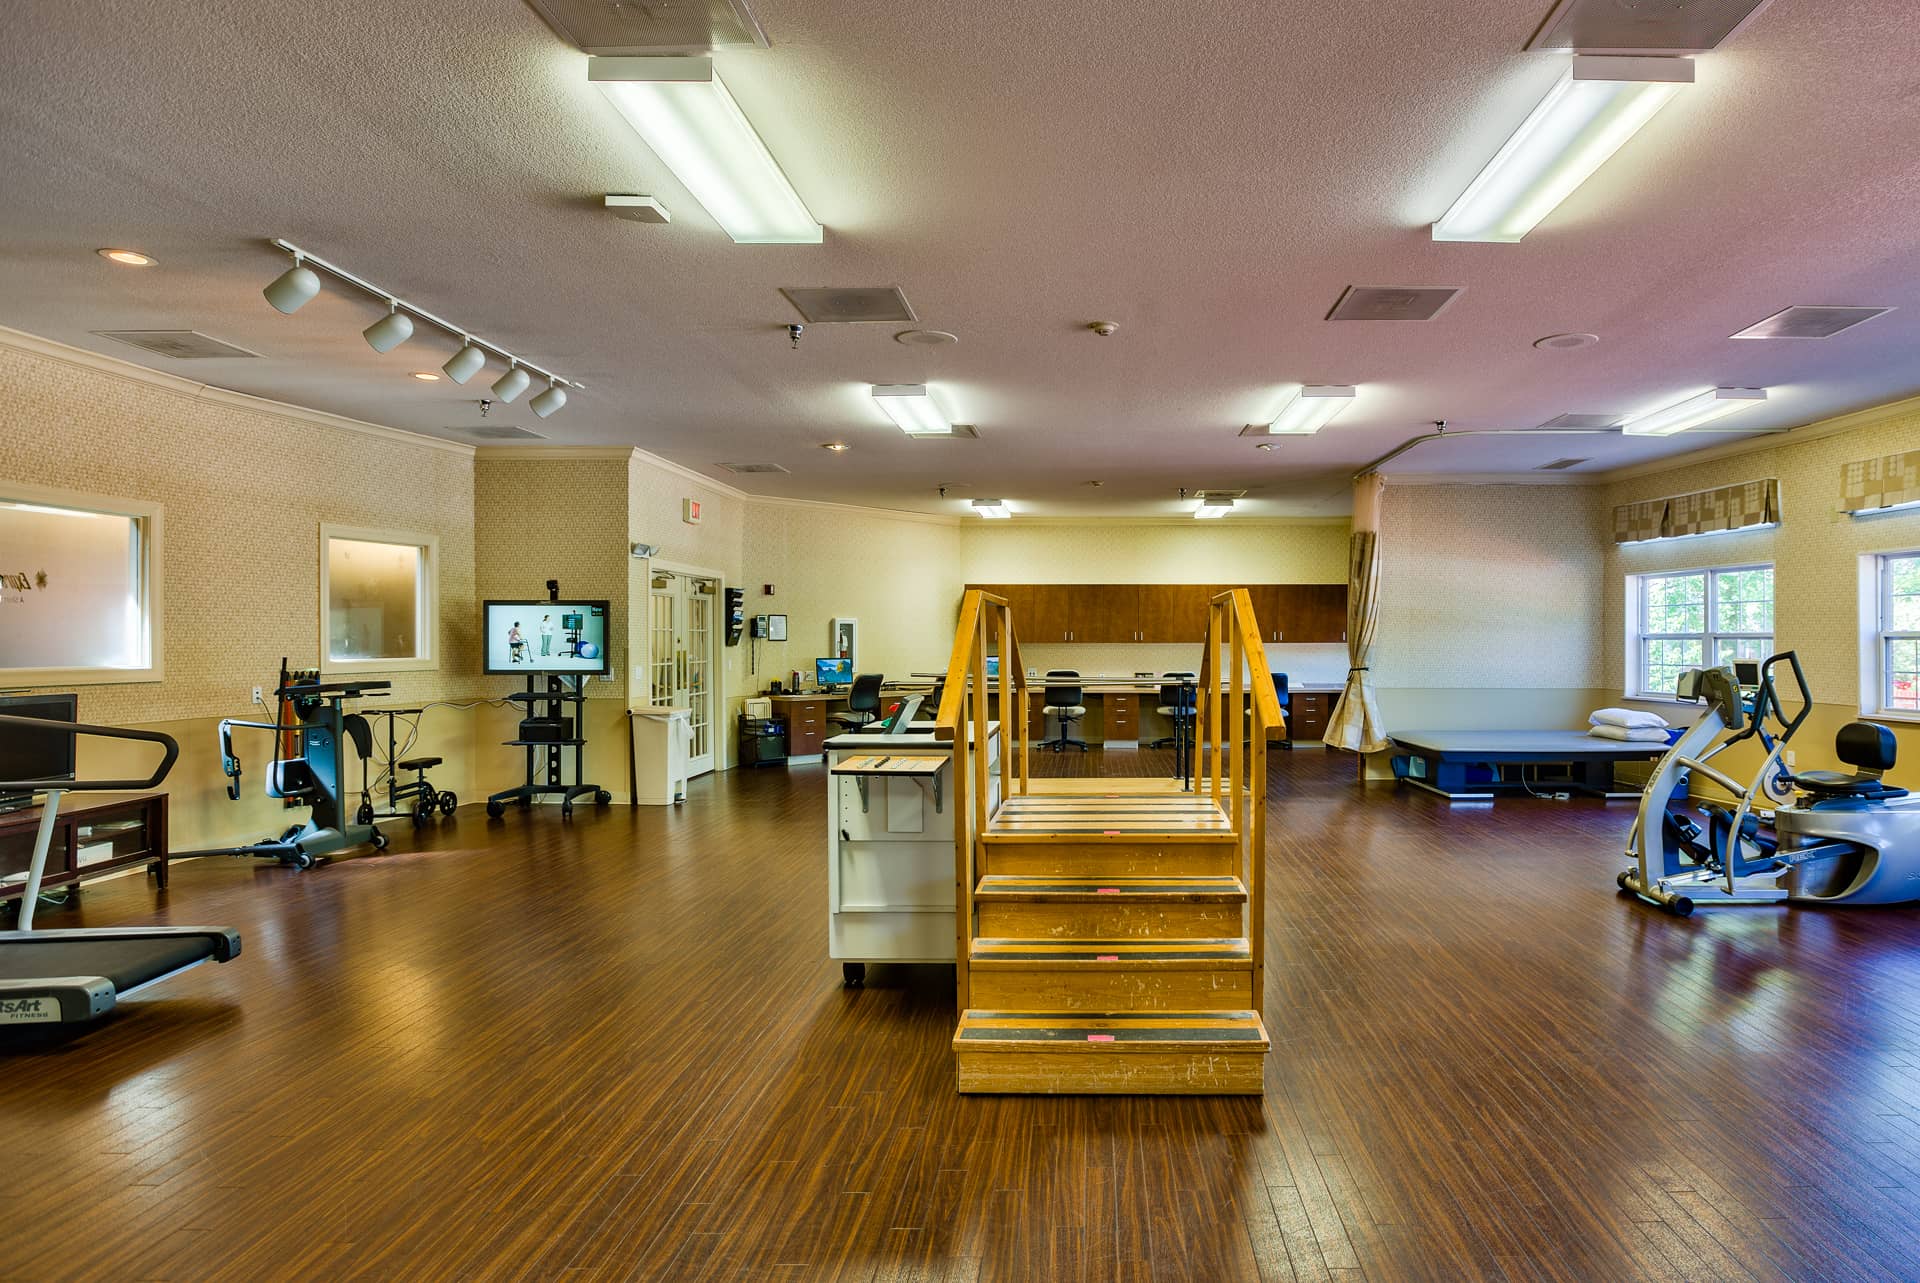
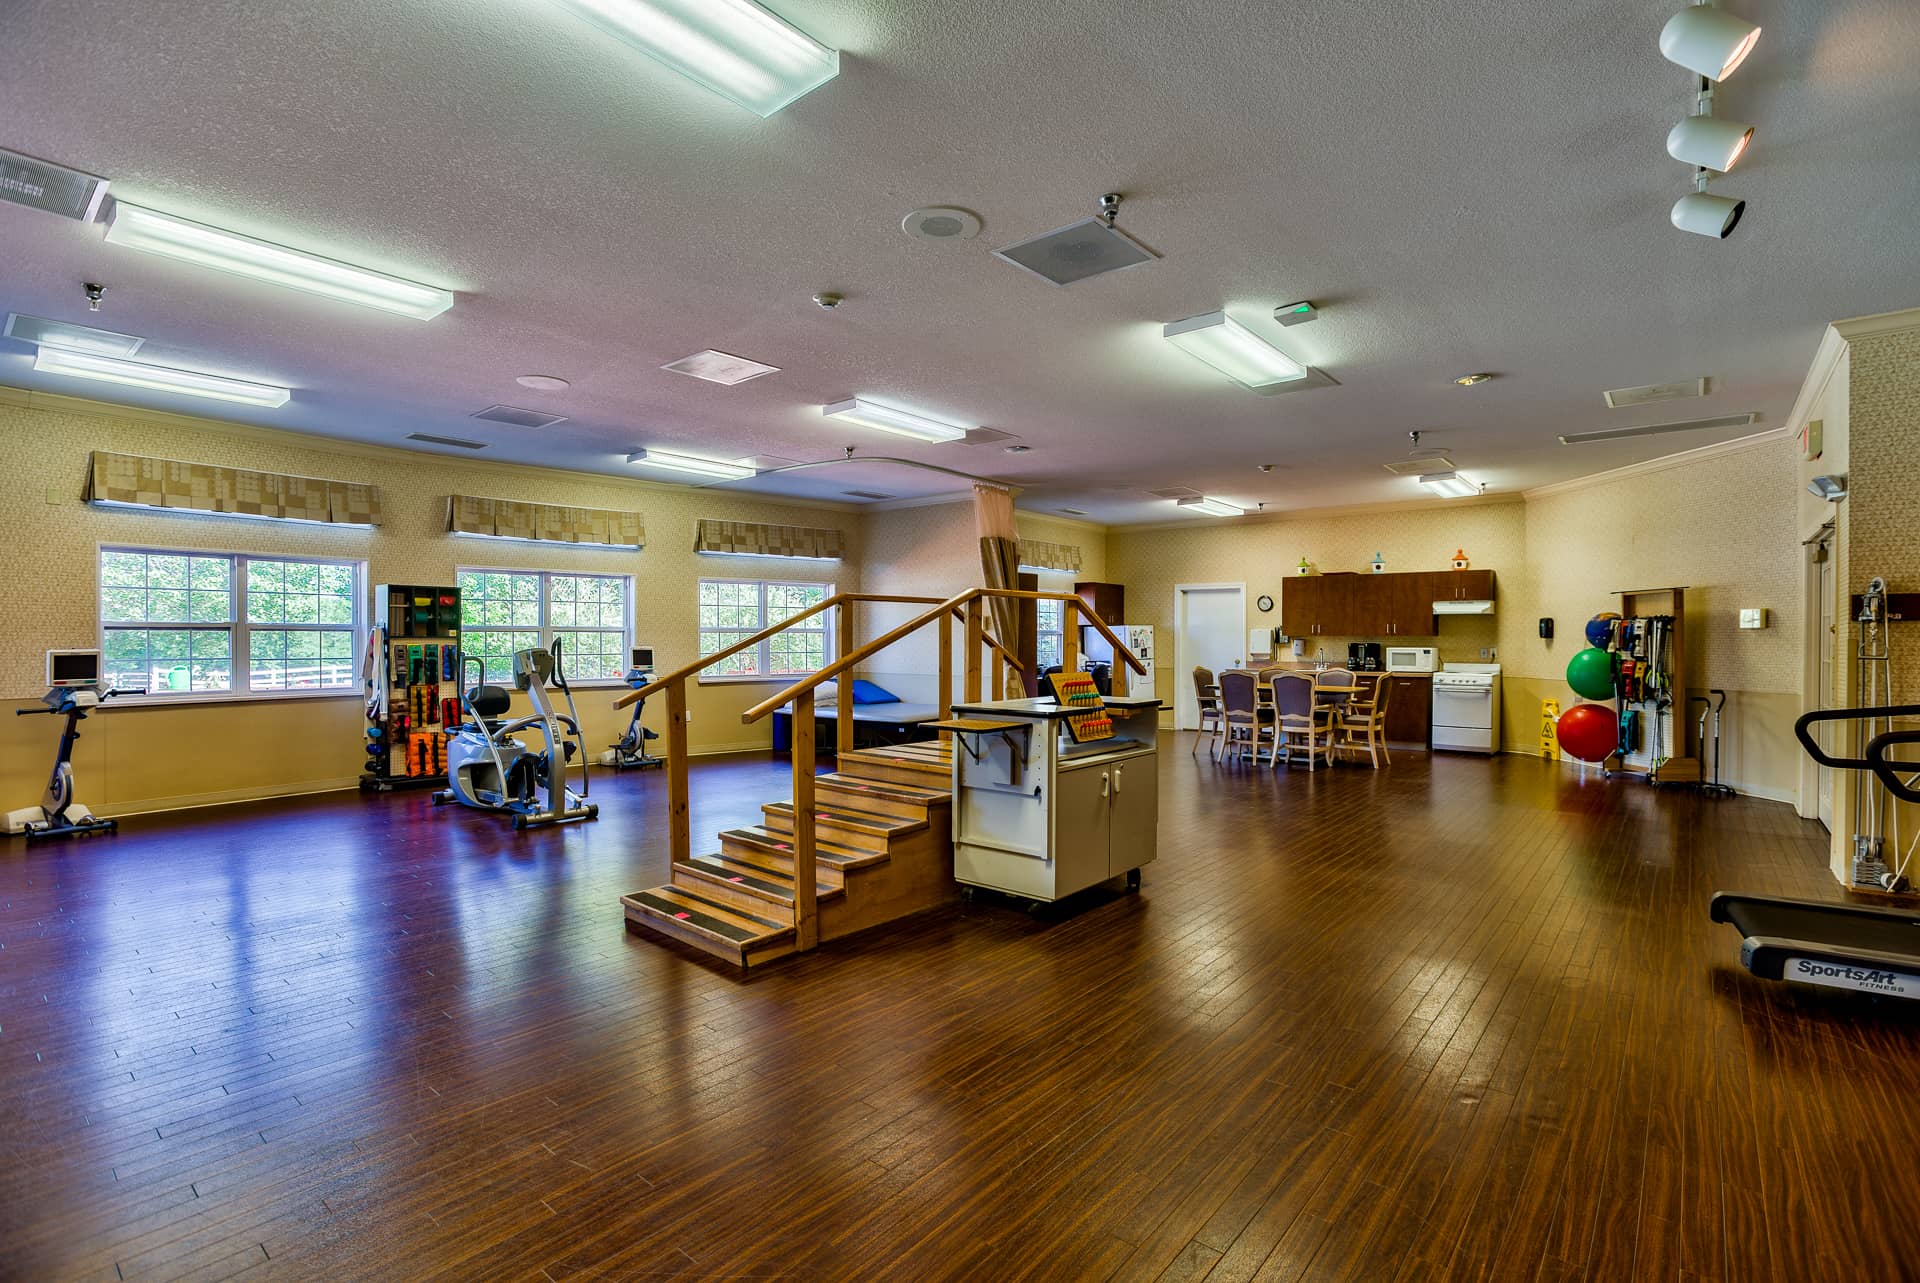
The nursing home specializes in post-hospital rehabilitation, other services include therapy (speech, occupational, physical), blood transfusions, respiratory care, post-stroke rehabilitation, diabetes management, and wound care.
 Official CMS rating based on health inspections, staffing and quality measures.
Official CMS rating based on deficiencies found during state health inspections.
Official CMS rating based on nurse staffing hours per resident per day.
Official CMS rating based on clinical outcomes for residents.
Average daily nursing hours per resident (adjusted for acuity). Higher values indicate more nursing time per resident.
Hours of care per resident per day, broken down by staff type. Data from CMS Medicare.
Registered nurse hours per resident per day.
Official CMS rating based on health inspections, staffing and quality measures.
Official CMS rating based on deficiencies found during state health inspections.
Official CMS rating based on nurse staffing hours per resident per day.
Official CMS rating based on clinical outcomes for residents.
Average daily nursing hours per resident (adjusted for acuity). Higher values indicate more nursing time per resident.
Hours of care per resident per day, broken down by staff type. Data from CMS Medicare.
Registered nurse hours per resident per day.
Offers a balance of services and community atmosphere.
Lower occupancy suggests more openings may be available.
This home supports both short-term rehab and long-term care, with residents staying for a wide range of durations.
10% of new residents, usually for short-term rehab.
52% of new residents, often for short stays.
38% of new residents, often for long-term daily care.
The portion of the home's budget spent on staff, including nurses, caregivers, and other employees who support care and operations.
All remaining costs needed to run the home, such as food, utilities, building maintenance, supplies and administrative expenses.
The Rehabilitation Center of Independence is legally operated by 1800 OPCO LLC, and administrated by BRASWELL.
Ways to qualify for care at this community, including accepted programs and payment options.
This facility is certified for eligible Medicare services.
Missouri average 6.6
Last Health inspection on Mar 2025
Health citations are formal notices following inspections when they fail to comply with safety and care standards.
52 of 56 citations resulted from standard inspections; 2 of 56 resulted from complaint investigations; and 2 of 56 came from combined inspections (standard and complaint).
Missouri average: 0.7
Missouri average: 1
Data sourced from CMS Health Deficiencies reports. Citation severity codes range from A (least serious) to L (most serious). Immediate Jeopardy (J-L) citations indicate situations where the facility's noncompliance has placed residents at risk of death or serious harm.
Nursing Home 24/7 care needed
Assisted Living For seniors needing help with daily tasks but not full-time nursing.
Nursing
Nursing Home 24/7 care needed
Assisted Living For seniors needing help with daily tasks but not full-time nursing.
Assisted Living For seniors needing help with daily tasks but not full-time nursing.
Independent Living For self-sufficient seniors seeking community and minimal assistance.
Memory Care Specialized care for those with Memory Loss, Alzheimer's, or dementia, ensuring safety and support.
Nursing Homes 24/7 care needed
Nursing Home 24/7 care needed
Nursing
Nursing Home 24/7 care needed
Assisted Living For seniors needing help with daily tasks but not full-time nursing.
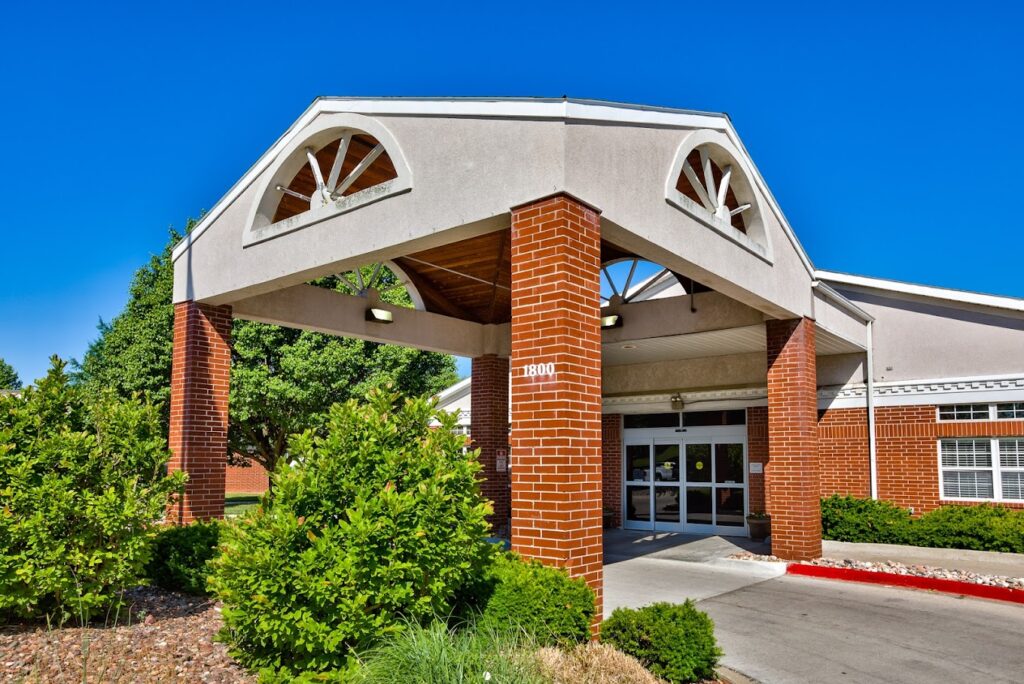 The Rehabilitation Center of Independence
 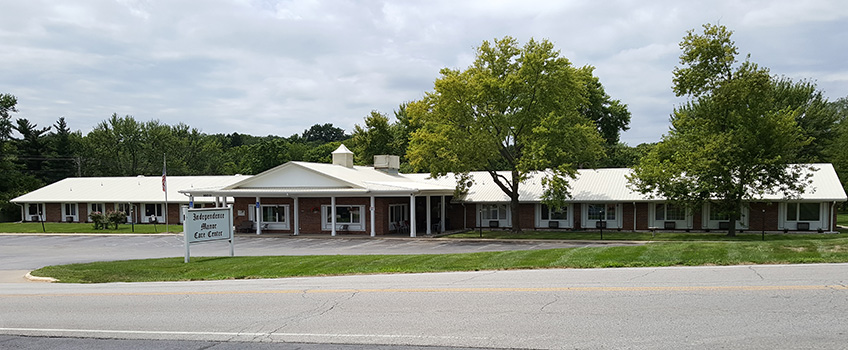 Independence Manor Care Center
 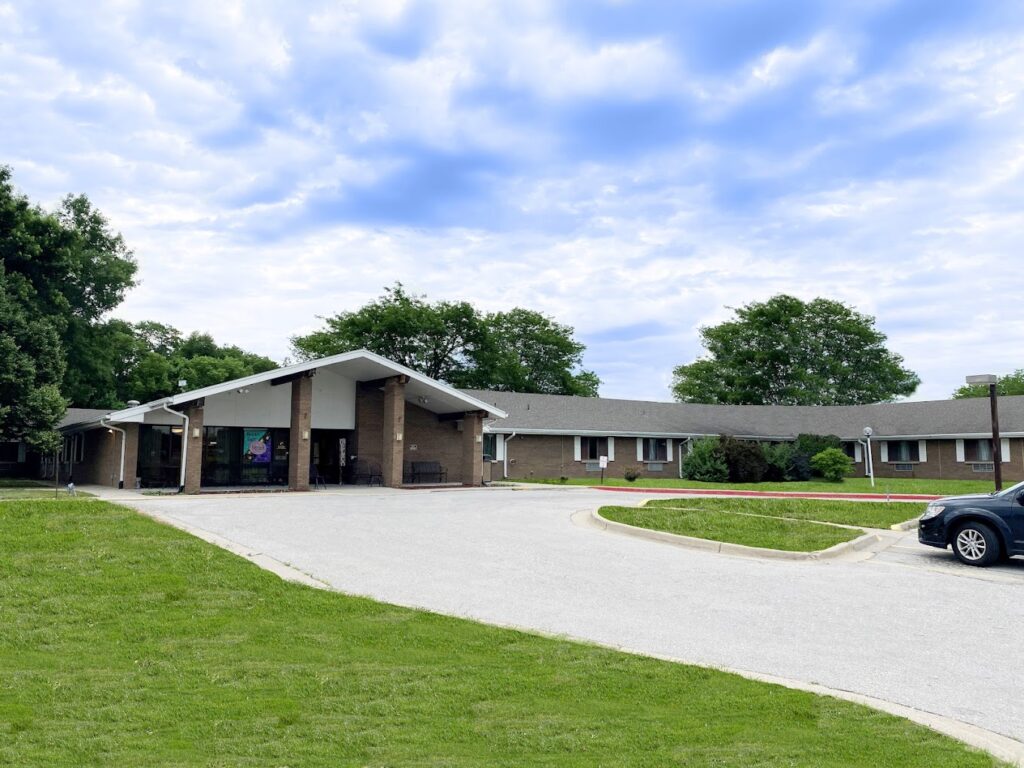 Baptist Homes of Independence
 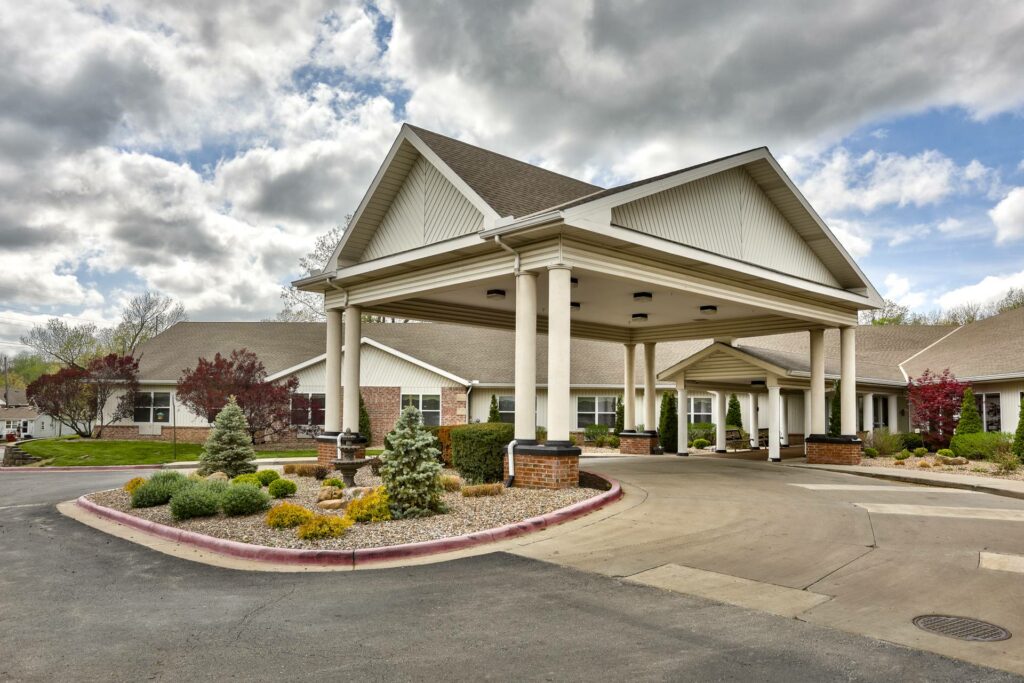 Carmel Hills Wellness & Rehabilitation
![]() 3.5 miles from city center — 2.75 miles to nearest hospital (Centerpoint Medical Center)
3.5 miles from city center — 2.75 miles to nearest hospital (Centerpoint Medical Center)
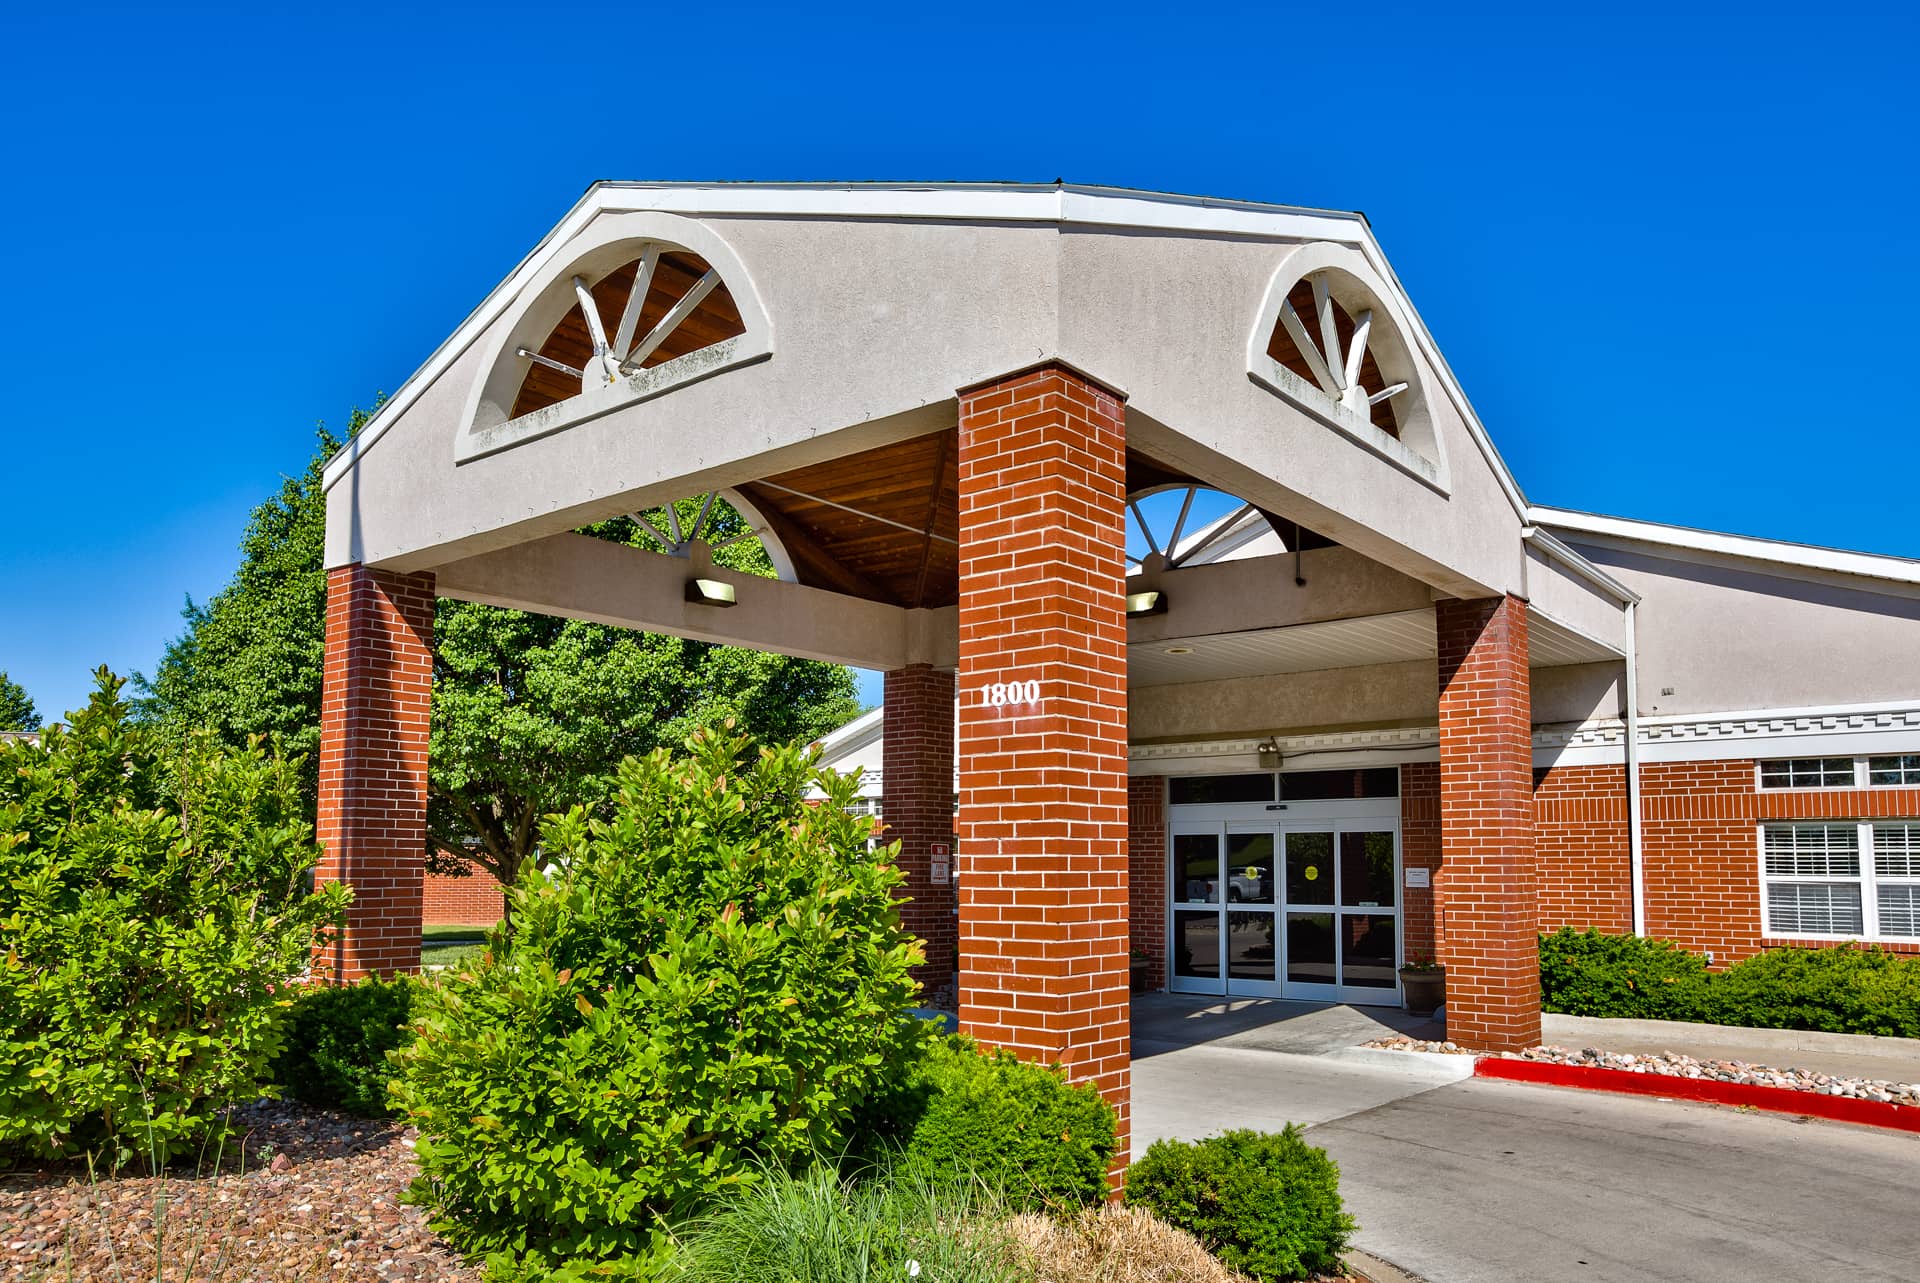
![]() 1800 S Swope Dr, Independence, MO 64057
1800 S Swope Dr, Independence, MO 64057
Add your location
Source: CMS Payroll-Based Journal (Q2 2025)
| Role ⓘ | Count ⓘ | Avg Shift (hrs) ⓘ | Uses Contractors? ⓘ |
|---|---|---|---|
| Registered Nurse | 1 | 10.8 | No |
| Licensed Practical Nurse | 30 | 9.4 | Yes |
| Certified Nursing Assistant | 96 | 8.8 | Yes |
| Role ⓘ | Employees ⓘ | Contractors ⓘ | Total Staff ⓘ | Total Hours ⓘ | Days Worked ⓘ | % of Days ⓘ | Avg Shift (hrs) ⓘ |
|---|---|---|---|---|---|---|---|
| Certified Nursing Assistant | 60 | 36 | 96 | 18,721 | 91 | 100% | 8.8 |
| Licensed Practical Nurse | 16 | 14 | 30 | 7,072 | 91 | 100% | 9.4 |
| Medication Aide/Technician | 18 | 11 | 29 | 5,590 | 91 | 100% | 10.1 |
| Physical Therapist | 22 | 0 | 22 | 4,994 | 91 | 100% | 8.1 |
| RN Director of Nursing | 3 | 0 | 3 | 1,675 | 69 | 76% | 9 |
| Therapeutic Recreation Specialist | 0 | 4 | 4 | 936 | 75 | 82% | 6.5 |
| Occupational Therapy Aide | 2 | 0 | 2 | 790 | 84 | 92% | 9 |
| Other Dietary Services Staff | 3 | 0 | 3 | 741 | 73 | 80% | 6.4 |
| Physical Therapy Aide | 0 | 5 | 5 | 723 | 66 | 73% | 6.2 |
| Clinical Nurse Specialist | 1 | 2 | 3 | 690 | 82 | 90% | 8.1 |
| Administrator | 2 | 0 | 2 | 615 | 63 | 69% | 9.8 |
| Nurse Practitioner | 1 | 0 | 1 | 577 | 68 | 75% | 8.5 |
| Dietitian | 1 | 0 | 1 | 523 | 69 | 76% | 7.6 |
| Dental Services Staff | 1 | 0 | 1 | 439 | 59 | 65% | 7.4 |
| Nurse Aide in Training | 2 | 0 | 2 | 405 | 44 | 48% | 9 |
| Respiratory Therapy Technician | 0 | 2 | 2 | 403 | 63 | 69% | 5.8 |
| Registered Nurse | 1 | 0 | 1 | 335 | 31 | 34% | 10.8 |
| Qualified Social Worker | 0 | 4 | 4 | 332 | 69 | 76% | 4.7 |
| Physician Assistant | 1 | 0 | 1 | 327 | 62 | 68% | 5.3 |
| Physical Therapy Assistant | 0 | 3 | 3 | 274 | 67 | 74% | 4.1 |
| Occupational Therapy Assistant | 0 | 1 | 1 | 32 | 3 | 3% | 10.7 |
Source: CMS Long-Term Care Facility Characteristics (Data as of Jan 2026)
Residents meet regularly to discuss policies, care quality, and activities
Organized group of residents that meets regularly to discuss facility policies, quality of life, and activities.
Data sourced from CMS Long-Term Care Facility Characteristics quarterly report. Payer mix reflects the current resident census by primary payment source.
These measures show how residents usually do over time at this home, based on health outcomes and preventive care.
Missouri average: 10.9
Missouri average: 19.5
Missouri average: 19.8%
Missouri average: 20.6%
Missouri average: 18.1%
Missouri average: 4.0%
Missouri average: 5.0%
Missouri average: 2.7%
Missouri average: 5.6%
Missouri average: 12.8%
Missouri average: 22.0%
Missouri average: 85.2%
Missouri average: 90.9%
Missouri average: 2.08
Missouri average: 2.35
Missouri average: 66.6%
Missouri average: 2.2%
Missouri average: 63.5%
Missouri average: 25.3%
Missouri average: 13.4%
Missouri average: 0.8%
Missouri average: 53.7%
Missouri average: 50.6%
Quality measures are calculated from Minimum Data Set (MDS) assessments. For most measures, lower percentages indicate better care quality.
Federal penalties imposed by CMS for regulatory violations, including civil money penalties (fines) and denials of payment for new Medicare/Medicaid admissions.
Source: CMS Penalties Database (Data as of Jan 2026)
Missouri average: $73K
Missouri average: 2.4
Missouri average: 0.7
Penalties are imposed by CMS for violations of federal nursing home regulations.
Last updated: Jan 2026
Historical financial and operational data for The Rehabilitation Center of Independence based on CMS SNF Cost Reports.
Loading trend charts...
Care Cost Calculator: See Prices in Your Area
Nursing Home Data Explorer
Don’t Wait Too Long: 7 Red Flag Signs Your Parent Needs Assisted Living Now
The True Cost of Assisted Living in 2025 – And How Families Are Paying For It
Understanding Senior Living Costs: Pricing Models, Discounts & Financial Assistance

Touring a community? Use this expert-backed checklist to stay organized, ask the right questions, and find the perfect fit.
We'll send you a PDF version of the touring checklist.