


Total staff
127
Employees
108
Contractors
19

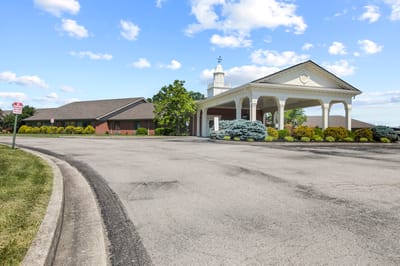
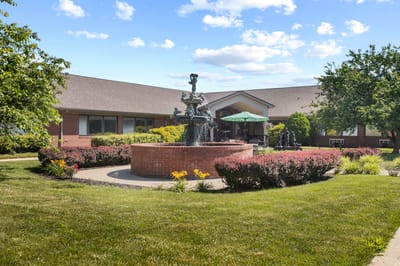

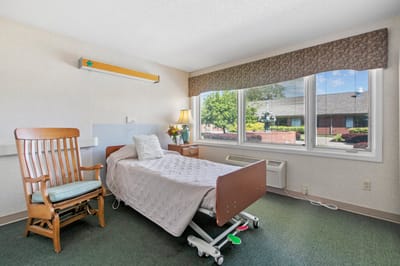


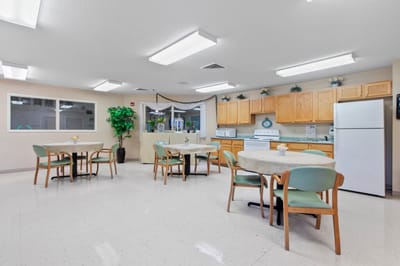

Located on Brooklyn Boulevard in Berea, Kentucky, The Terrace Nursing & Rehabilitation Facility provides skilled nursing, rehabilitation, and respite care services. The community has 102 beds and accepts Medicare, Medicaid, and private-pay residents, offering families several payment options for both short-term and long-term care needs.
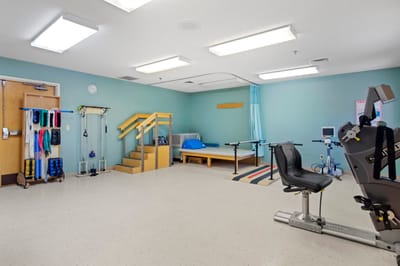
Residents receive an average of 2 hours and 53 minutes of nursing care each day. Nurse aides provide approximately 2 hours and 27 minutes of that total, reflecting a care model that relies heavily on hands-on daily assistance and support.
The community maintains a high occupancy rate of about 94%. Residents stay an average of 162 days, indicating a combination of rehabilitation-focused admissions and longer-term nursing care placements.
Situated in an area with a Walk Score of 2, the community is highly dependent on vehicle transportation. Most errands, appointments, and visits require driving, an important consideration for family members planning regular trips to see loved ones.
| Staff type | Hours / Day / Resident | vs state avg |
|---|---|---|
|
Registered Nurse (RN)
| 18m per day | ▼ 62% State avg: 46m per day · National avg: 41m per day |
|
LPN / LVN
| 59m per day | ▲ 20% State avg: 49m per day · National avg: 52m per day |
|
Nurse Aide
| 2h 27m per day | ■ Avg State avg: 2h 25m per day · National avg: 2h 21m per day |
|
Weekend Total Nursing
| 3h 13m per day | ▼ 7% State avg: 3h 29m per day · National avg: 3h 26m per day |
|
Physical Therapist
| 2m per day | ▼ 54% State avg: 4m per day · National avg: 4m per day |
|
Weekend RN
| 12m per day | ▼ 60% State avg: 31m per day · National avg: 29m per day |
Reporting period: October 1 – December 31, 2025 (Q4 2025). Source: CMS Payroll-Based Journal report.
Manages medical care and health needs.
Assists with medical care and medications.
Helps with daily care and mobility.
Total hours from contractors
2,698 contractor hours this quarter
| Certified Nursing Assistant | 57 | 0 | 57 | 19,983 | 92 | 100% | 9.7 |
| Licensed Practical Nurse | 23 | 0 | 23 | 6,789 | 92 | 100% | 9.6 |
| Registered Nurse | 7 | 0 | 7 | 2,078 | 91 | 99% | 8.9 |
| RN Director of Nursing | 6 | 0 | 6 | 1,993 | 70 | 76% | 7.1 |
| Medication Aide/Technician | 4 | 0 | 4 | 1,767 | 92 | 100% | 10.5 |
| Speech Language Pathologist | 0 | 2 | 2 | 897 | 68 | 74% | 7.7 |
| Dietitian | 2 | 0 | 2 | 855 | 75 | 82% | 7.3 |
| Physical Therapy Assistant | 0 | 4 | 4 | 720 | 70 | 76% | 6.9 |
| Other Dietary Services Staff | 2 | 0 | 2 | 503 | 61 | 66% | 8.1 |
| Nurse Practitioner | 2 | 0 | 2 | 488 | 61 | 66% | 8 |
| Dental Services Staff | 1 | 0 | 1 | 473 | 61 | 66% | 7.8 |
| Administrator | 1 | 0 | 1 | 388 | 64 | 70% | 6.1 |
| Physical Therapy Aide | 0 | 2 | 2 | 374 | 61 | 66% | 6.1 |
| Qualified Social Worker | 0 | 4 | 4 | 359 | 53 | 58% | 6.6 |
| Respiratory Therapy Technician | 0 | 4 | 4 | 273 | 72 | 78% | 3.6 |
| Nurse Aide in Training | 2 | 0 | 2 | 218 | 21 | 23% | 10.4 |
| Clinical Nurse Specialist | 1 | 0 | 1 | 64 | 8 | 9% | 8 |
| Occupational Therapy Aide | 0 | 1 | 1 | 31 | 9 | 10% | 3.4 |
| Occupational Therapy Assistant | 0 | 1 | 1 | 29 | 6 | 7% | 4.8 |
| Medical Director | 0 | 1 | 1 | 16 | 14 | 15% | 1.1 |
Federal penalties imposed by CMS for regulatory violations, including civil money penalties (fines) and denials of payment for new Medicare/Medicaid admissions.
Source: CMS Penalties Database
No penalties in the past 3 years
No civil money penalties or payment denials were reported in the last 3 years.
These measures show how residents usually do over time at this home, based on health outcomes and preventive care.
Kentucky average: 10.5
Kentucky average: 18.9
Kentucky average: 16.8%
Kentucky average: 19.6%
Kentucky average: 20.5%
Kentucky average: 3.8%
Kentucky average: 5.8%
Kentucky average: 1.9%
Kentucky average: 6.8%
Kentucky average: 14.3%
Kentucky average: 15.6%
Kentucky average: 93.9%
Kentucky average: 96.2%
Kentucky average: 1.87
Kentucky average: 2.19
Kentucky average: 83.7%
Kentucky average: 1.9%
Kentucky average: 83.6%
Kentucky average: 24.5%
Kentucky average: 13.9%
Kentucky average: 0.8%
Kentucky average: 53.7%
Kentucky average: 50.6%
Quality measures are calculated from Minimum Data Set (MDS) assessments. For most measures, lower percentages indicate better care quality.
38% of new residents, usually for short-term rehab.
59% of new residents, often for short stays.
3% of new residents, often for long-term daily care.
Source: CMS Long-Term Care Facility Characteristics (Data as of Jan 2026)
Residents meet regularly to discuss policies, care quality, and activities
State-approved Nurse Aide Training and Competency Evaluation Program on-site
Organized group of residents that meets regularly to discuss facility policies, quality of life, and activities.
Data sourced from CMS Long-Term Care Facility Characteristics quarterly report. Payer mix reflects the current resident census by primary payment source.
Historical financial and operational data for The Terrace Nursing & Rehabilitation Facility from 2011–2023, based on CMS SNF Cost Reports.
Key figures below are for fiscal year ending in 12/2023.
Based on CMS SNF Cost Report for fiscal year ending in 12/2023.
Pets Allowed
This home supports both short-term rehab and long-term care, with residents staying for a wide range of durations.
Most new residents arrive under private pay (59% of admissions), and a typical private pay stay runs around 2 - 3 months.
Coverage residents most often arrive under.
Coverage residents most often leave under.
![]() 1.7 miles from city center
1.7 miles from city center
![]() Estimated distance in miles from Berea's city center to The Terrace Nursing & Rehabilitation Facility's address, calculated via Google Maps.
Estimated distance in miles from Berea's city center to The Terrace Nursing & Rehabilitation Facility's address, calculated via Google Maps.
Add your location
Info below is compiled from CMS reports & the KY Cabinet for Health & Family Services (CHFS), senior community websites & trusted data sources such as Walk Score & BBB.
Communities are listed from highest to lowest based on our ranking methodology.
| Kenwood Health and Rehabilitation Center | NH RC SNF | Richmond | 93
Facility
93
KY AVG
82
Rank
#126 / 341 |
92.5%
Facility
92.5%
KY AVG
84.3
Rank
#55 / 168 | +10% | 3.49
Facility
3.49
KY AVG
3.75
Rank
#66 / 189 | -48% | -7% | $0
Facility
$0
KY AVG
$65.4k
Rank
#1 / 195 | 1
Facility
1
KY AVG
13.5
Rank
#1 / 191 | 1.0
Facility
1.0
KY AVG
4.4
Rank
#1 / 191 | - | 86 | - |
78
Facility
78
KY AVG
41
Rank
#18 / 423 | Benita Dickenson | $8.8MFiscal year ending 12/2023
Facility
$8.8MFiscal year ending 12/2023
KY AVG
$10.5M
Rank
#117 / 192 | $4.4MFiscal year ending 12/2023
Facility
$4.4MFiscal year ending 12/2023
KY AVG
$4.0M
Rank
#71 / 192 | 49.4%Fiscal year ending 12/2023
Facility
49.4%Fiscal year ending 12/2023
KY AVG
40.7%
Rank
#31 / 192 | 185061 | ||||
| The Terrace Nursing & Rehabilitation Facility | NH SNF | Berea | 102
Facility
102
KY AVG
82
Rank
#94 / 341 |
95.9%
Facility
95.9%
KY AVG
84.3
Rank
#23 / 168 | +14% | 2.89
Facility
2.89
KY AVG
3.75
Rank
#158 / 189 | -49% | -23% | $0
Facility
$0
KY AVG
$65.4k
Rank
#1 / 195 | 5
Facility
5
KY AVG
13.5
Rank
#19 / 191 | 1.7
Facility
1.7
KY AVG
4.4
Rank
#9 / 191 | - | 98 | - |
2
Facility
2
KY AVG
41
Rank
#401 / 423 | - | $10.7MFiscal year ending 12/2023
Facility
$10.7MFiscal year ending 12/2023
KY AVG
$10.5M
Rank
#76 / 192 | $5.6MFiscal year ending 12/2023
Facility
$5.6MFiscal year ending 12/2023
KY AVG
$4.0M
Rank
#70 / 192 | 52.4%Fiscal year ending 12/2023
Facility
52.4%Fiscal year ending 12/2023
KY AVG
40.7%
Rank
#85 / 192 | 185103 | ||||
| Madison Health & Rehabilitation Center | NH HOS RC SNF | Richmond | 92
Facility
92
KY AVG
82
Rank
#128 / 341 |
89.1%
Facility
89.1%
KY AVG
84.3
Rank
#82 / 168 | +6% | 3.27
Facility
3.27
KY AVG
3.75
Rank
#91 / 189 | -58% | -13% | $11.8k
Facility
$11.8k
KY AVG
$65.4k
Rank
#147 / 195 | 16
Facility
16
KY AVG
13.5
Rank
#126 / 191 | 5.3
Facility
5.3
KY AVG
4.4
Rank
#137 / 191 | 2 | 82 | - |
36
Facility
36
KY AVG
41
Rank
#244 / 423 | Summit Care Management LLC | $7.1MFiscal year ending 12/2023
Facility
$7.1MFiscal year ending 12/2023
KY AVG
$10.5M
Rank
#138 / 192 | $4.9MFiscal year ending 12/2023
Facility
$4.9MFiscal year ending 12/2023
KY AVG
$4.0M
Rank
#63 / 192 | 69%Fiscal year ending 12/2023
Facility
69%Fiscal year ending 12/2023
KY AVG
40.7%
Rank
#3 / 192 | 185262 |
The Terrace Nursing & Rehabilitation Facility is located in Berea, Kentucky.
Here are the financial assistance programs available to residents in Kentucky.
The Terrace Nursing & Rehabilitation Facility has a walk score of 2. Car-dependent. Most errands require a car, with limited nearby walkable options.
The Terrace Nursing & Rehabilitation Facility's occupancy is 93.9%.
Yes, The Terrace Nursing & Rehabilitation Facility allows residents to bring their pets.
The Terrace Nursing & Rehabilitation Facility is registered as a for-profit.
Yes — there are 12 photos of The Terrace Nursing & Rehabilitation Facility in the photo gallery on this page.
The Terrace Nursing & Rehabilitation Facility is located at 1043 Brooklyn Blvd, Berea, KY 40403.
(859) 228-0551 will put you in contact with the team at The Terrace Nursing & Rehabilitation Facility.
Care Cost Calculator: See Prices in Your Area
Nursing Home Data Explorer
Don’t Wait Too Long: 7 Red Flag Signs Your Parent Needs Assisted Living Now
The True Cost of Assisted Living in 2025 – And How Families Are Paying For It
Understanding Senior Living Costs: Pricing Models, Discounts & Financial Assistance


