


Total health inspections
3
Tennessee average 3.5
Last Health inspection on Sep 2025
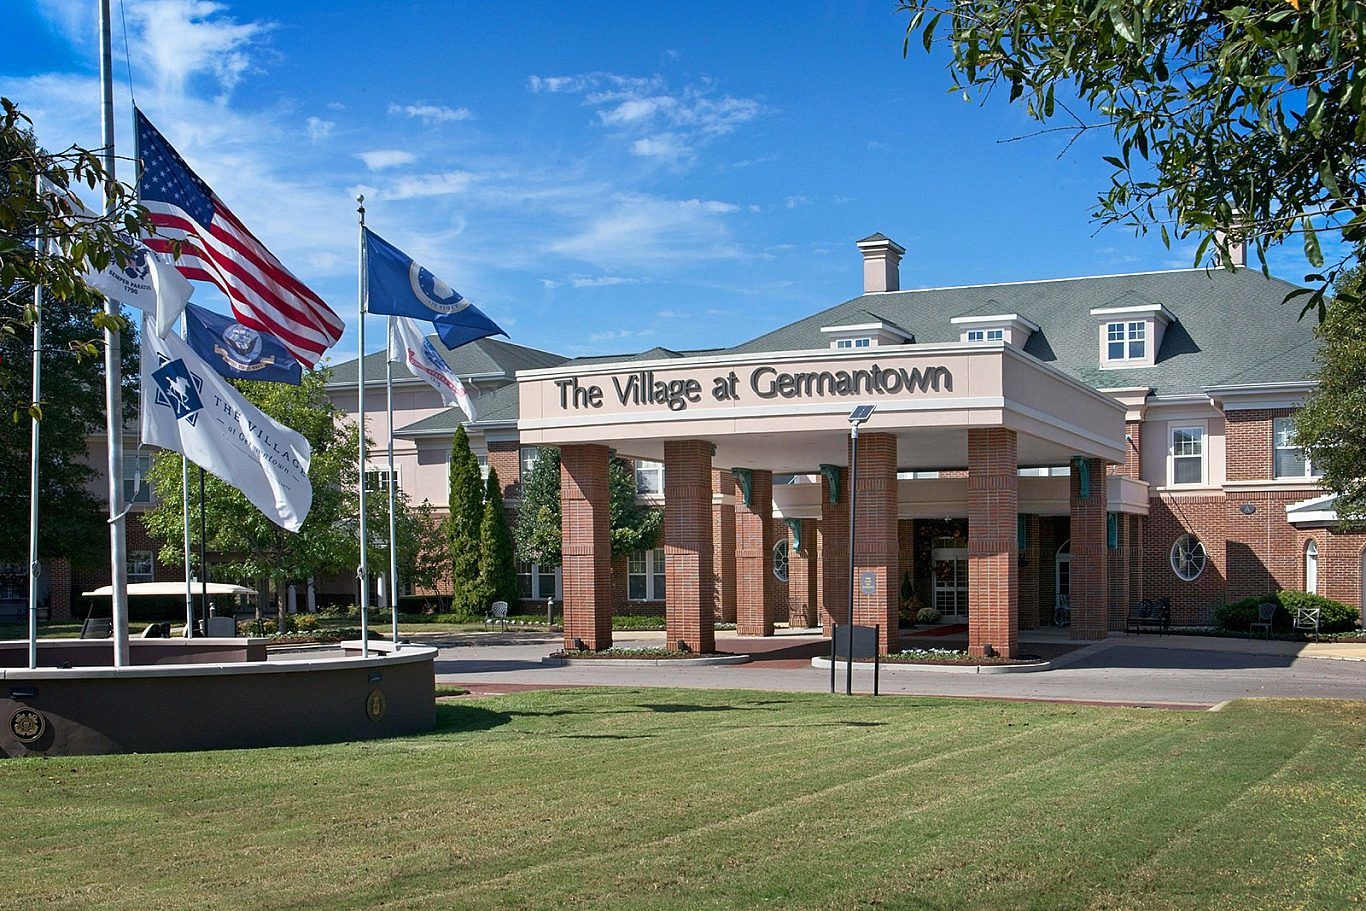

Located in Germantown, Tennessee, The Village at Germantown is a continuing care community in Shelby County. It’s less than a mile from the city center. Junaita Lavy owns the community, and Julie Elizabeth Repking is the administrator. Independent living, assisted living, skilled nursing, memory care, rehabilitation, and respite care are available on one campus. Residents can move between care levels as their needs change without relocating.
The 60-bed community currently houses 36 residents. Residents stay an average of 46 days, a pattern that reflects short-term rehabilitation stays alongside longer-term residents. The home’s occupancy rate is 86%, showing steady demand in the area. The community has been operating for 25 years, giving it a long history in Germantown.
Staffing is a notable strength. Residents receive nearly 6 hours of total nursing care per day. Registered nurses, licensed practical nurses, and nurse aides share this daily coverage. Registered nurses alone provide more than 1 hour of care each day, which supports residents who need regular clinical attention instead of occasional check-ins.
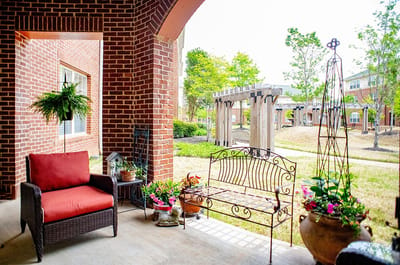
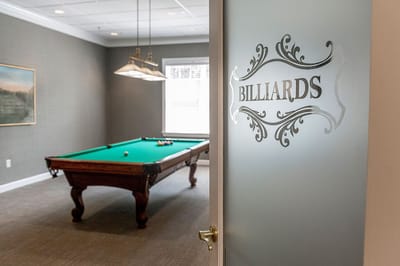
Daily life focuses on convenience and continuity. The on-site healthcare center includes 10 free healthcare-center days yearly. Amenities on-site include a fitness center and pool, spa services, and a beauty salon and barber shop. Life Changes Support Groups help residents and families manage transitions between different levels of care. Scheduled transportation is available for medical appointments.
Residents receive 20 meals each month, with guest meals and additional meal options available. Biweekly housekeeping and linen services are also available.
Medicare and private pay are accepted, giving families several ways to cover care costs. Families considering the community may ask how the campus manages transitions as residents’ care needs change because this flexibility is a central part of the community.
| Staff type | Hours / Day / Resident | vs state avg |
|---|---|---|
|
Registered Nurse (RN)
| 1h 5m per day | ▲ 76% State avg: 37m per day · National avg: 41m per day |
|
LPN / LVN
| 1h 42m per day | ▲ 56% State avg: 1h 5m per day · National avg: 52m per day |
|
Nurse Aide
| 4h 10m per day | ▲ 94% State avg: 2h 9m per day · National avg: 2h 20m per day |
|
Weekend Total Nursing
| 6h 11m per day | ▲ 84% State avg: 3h 21m per day · National avg: 3h 26m per day |
|
Physical Therapist
| 6m per day | ▲ 19% State avg: 5m per day · National avg: 4m per day |
|
Weekend RN
| 1h 2m per day | ▲ 159% State avg: 24m per day · National avg: 28m per day |
The Village at Germantown is administered by Julie Elizabeth Repking.
Key information about the people who lead and staff this community.
Tennessee average 3.5
Last Health inspection on Sep 2025
Tennessee average 15.4
Tennessee average 4.39
Health citations are formal notices following inspections when they fail to comply with safety and care standards.
All 16 citations resulted from standard inspections.
Tennessee average: 1.1
Tennessee average: 0.6
Reporting period: October 1 – December 31, 2025 (Q4 2025). Source: CMS Payroll-Based Journal report.
Manages medical care and health needs.
Assists with medical care and medications.
Helps with daily care and mobility.
Total hours from contractors
7,075 contractor hours this quarter
| Certified Nursing Assistant | 40 | 37 | 77 | 18,832 | 92 | 100% | 8.1 |
| Licensed Practical Nurse | 15 | 11 | 26 | 6,507 | 92 | 100% | 8.5 |
| Registered Nurse | 10 | 2 | 12 | 3,638 | 92 | 100% | 8.8 |
| RN Director of Nursing | 2 | 0 | 2 | 1,151 | 79 | 86% | 9 |
| Other Dietary Services Staff | 3 | 0 | 3 | 1,062 | 81 | 88% | 7.8 |
| Physical Therapy Aide | 0 | 7 | 7 | 1,059 | 80 | 87% | 7.1 |
| Speech Language Pathologist | 0 | 10 | 10 | 1,027 | 92 | 100% | 5.1 |
| Mental Health Service Worker | 2 | 0 | 2 | 970 | 63 | 68% | 8.1 |
| Clinical Nurse Specialist | 2 | 0 | 2 | 838 | 62 | 67% | 8.1 |
| Dietitian | 2 | 0 | 2 | 640 | 66 | 72% | 8.4 |
| Administrator | 2 | 0 | 2 | 506 | 60 | 65% | 8.3 |
| Physical Therapy Assistant | 0 | 4 | 4 | 475 | 77 | 84% | 5.7 |
| Respiratory Therapy Technician | 0 | 12 | 12 | 447 | 73 | 79% | 3.9 |
| Nurse Practitioner | 1 | 0 | 1 | 440 | 53 | 58% | 8.3 |
| Qualified Social Worker | 0 | 3 | 3 | 408 | 64 | 70% | 5.7 |
| Therapeutic Recreation Specialist | 0 | 1 | 1 | 188 | 40 | 43% | 4.7 |
| Qualified Activities Professional | 0 | 8 | 8 | 171 | 55 | 60% | 2.7 |
| Medical Director | 0 | 1 | 1 | 15 | 13 | 14% | 1.2 |
Includes penalties issued in 2025
Federal penalties imposed by CMS for regulatory violations, including civil money penalties (fines) and denials of payment for new Medicare/Medicaid admissions.
Source: CMS Penalties Database (Data as of Jan 2026)
Tennessee average: $86K
Tennessee average: 1.7
Tennessee average: 0.5
Penalties are imposed by CMS for violations of federal nursing home regulations.
1 penalty in the past 3 years
Sep 11, 2025 · 42 days
Last updated: Jan 2026
These measures show how residents usually do over time at this home, based on health outcomes and preventive care.
Tennessee average: 10.5
Tennessee average: 19.5
Tennessee average: 16.0%
Tennessee average: 20.7%
Tennessee average: 3.7%
Tennessee average: 5.4%
Tennessee average: 2.1%
Tennessee average: 6.3%
Tennessee average: 11.0%
Tennessee average: 16.5%
Tennessee average: 89.9%
Tennessee average: 94.5%
Tennessee average: 1.58
Tennessee average: 1.57
Tennessee average: 79.7%
Tennessee average: 1.7%
Tennessee average: 79.8%
Tennessee average: 22.2%
Tennessee average: 11.2%
Tennessee average: 0.8%
Tennessee average: 53.7%
Tennessee average: 50.6%
Quality measures are calculated from Minimum Data Set (MDS) assessments. For most measures, lower percentages indicate better care quality.
95% of new residents, usually for short-term rehab.
5% of new residents, often for short stays.
Source: CMS Long-Term Care Facility Characteristics (Data as of Jan 2026)
Residents meet regularly to discuss policies, care quality, and activities
Organized group of residents that meets regularly to discuss facility policies, quality of life, and activities.
Data sourced from CMS Long-Term Care Facility Characteristics quarterly report. Payer mix reflects the current resident census by primary payment source.
Historical financial and operational data for The Village at Germantown from 2011–2023, based on CMS SNF Cost Reports.
Key figures below are for fiscal year ending in 12/2023.
Based on CMS SNF Cost Report for fiscal year ending in 12/2023.
Most residents typically stay for a few weeks or months before returning home or moving on.
Most new residents arrive under Medicare (95% of admissions), and a typical Medicare stay runs around 1 months.
Coverage residents most often arrive under.
Coverage residents most often leave under.
![]() 0.6 miles from city center
0.6 miles from city center
![]() Estimated distance in miles from Germantown's city center to The Village at Germantown's address, calculated via Google Maps.
Estimated distance in miles from Germantown's city center to The Village at Germantown's address, calculated via Google Maps.
Add your location
Info below is compiled from CMS reports & the TN Dept. of Health (TDH), senior community websites & trusted data sources such as Walk Score & BBB.
Communities are listed from highest to lowest based on our ranking methodology.
| Memphis Jewish Home & Rehab | IL HOS NH PC RC SNF | Cordova | 160
Facility
160
TN AVG
88
Rank
#28 / 425 |
81.9%
Facility
81.9%
TN AVG
71.5
Rank
#93 / 272 | +15% | 5.02
Facility
5.02
TN AVG
3.63
Rank
#10 / 177 | +27% | +38% | $0
Facility
$0
TN AVG
$90.9k
Rank
#1 / 182 | 14
Facility
14
TN AVG
15.4
Rank
#85 / 181 | 4.7
Facility
4.7
TN AVG
4.4
Rank
#106 / 181 | 1 | 131 | - |
14
Facility
14
TN AVG
34
Rank
#424 / 551 | Bobby Meadows | $19.0MFiscal year ending 12/2023
Facility
$19.0MFiscal year ending 12/2023
TN AVG
$11.5M
Rank
#5 / 181 | $12.0MFiscal year ending 12/2023
Facility
$12.0MFiscal year ending 12/2023
TN AVG
$4.6M
Rank
#4 / 181 | 63.3%Fiscal year ending 12/2023
Facility
63.3%Fiscal year ending 12/2023
TN AVG
41%
Rank
#57 / 181 | 445293 | ||||
| Cordova Wellness and Rehabilitation Center | IL HOS MC NH RC SNF | Cordova | 240
Facility
240
TN AVG
88
Rank
#2 / 425 |
65.5%
Facility
65.5%
TN AVG
71.5
Rank
#184 / 272 | -8% | 3.34
Facility
3.34
TN AVG
3.63
Rank
#106 / 177 | -11% | -8% | $0
Facility
$0
TN AVG
$90.9k
Rank
#1 / 182 | 10
Facility
10
TN AVG
15.4
Rank
#57 / 181 | 5.0
Facility
5.0
TN AVG
4.4
Rank
#113 / 181 | - | 157 | - |
1
Facility
1
TN AVG
34
Rank
#519 / 551 | Cordova Holdco LLC | $20.5MFiscal year ending 12/2023
Facility
$20.5MFiscal year ending 12/2023
TN AVG
$11.5M
Rank
#12 / 181 | $8.7MFiscal year ending 12/2023
Facility
$8.7MFiscal year ending 12/2023
TN AVG
$4.6M
Rank
#25 / 181 | 42.4%Fiscal year ending 12/2023
Facility
42.4%Fiscal year ending 12/2023
TN AVG
41%
Rank
#112 / 181 | 445218 | ||||
| The Village at Germantown | IL AL MC NH SNF | Germantown | 60
Facility
60
TN AVG
88
Rank
#289 / 425 | - | - | 5.93
Facility
5.93
TN AVG
3.63
Rank
#5 / 177 | -22% | +64% | $11.2k
Facility
$11.2k
TN AVG
$90.9k
Rank
#131 / 182 | 16
Facility
16
TN AVG
15.4
Rank
#98 / 181 | 5.3
Facility
5.3
TN AVG
4.4
Rank
#131 / 181 | 2 | 49 | - |
63
Facility
63
TN AVG
34
Rank
#56 / 551 | Junaita Lavy | $7.8MFiscal year ending 12/2023
Facility
$7.8MFiscal year ending 12/2023
TN AVG
$11.5M
Rank
#7 / 181 | $13.6MFiscal year ending 12/2023
Facility
$13.6MFiscal year ending 12/2023
TN AVG
$4.6M
Rank
#6 / 181 | 173.3%Fiscal year ending 12/2023
Facility
173.3%Fiscal year ending 12/2023
TN AVG
41%
Rank
#38 / 181 | 445482 |
The Village at Germantown is located in Germantown, Tennessee.
Here are the financial assistance programs available to residents in Tennessee.
The Village at Germantown has a walk score of 63. Moderately walkable. Some errands can be accomplished on foot, with a mix of nearby amenities.
The Village at Germantown's occupancy is 86.0%.
The Village at Germantown has been operating for approximately 25 years, based on available licensing and registration records.
No, The Village at Germantown has a no-pet policy.
The Village at Germantown is registered as a for-profit in TN.
Julie Elizabeth Repking is the administrator of The Village at Germantown.
The Village at Germantown has 60 beds.
Care Cost Calculator: See Prices in Your Area
Nursing Home Data Explorer
Don’t Wait Too Long: 7 Red Flag Signs Your Parent Needs Assisted Living Now
The True Cost of Assisted Living in 2025 – And How Families Are Paying For It
Understanding Senior Living Costs: Pricing Models, Discounts & Financial Assistance


