

Total health inspections
7
Minnesota average 6
Last Health inspection on Sep 2025

We arrange tours, appointments, and even moving support so you don’t have to


| Staff type | Hours / day | vs state avg |
|---|---|---|
|
Registered Nurse (RN)
| 38m per day | ▼ 41% State avg: 1h 4m per day · National avg: 41m per day |
|
LPN / LVN
| 31m per day | ▼ 16% State avg: 37m per day · National avg: 52m per day |
|
Nurse Aide
| 2h 22m per day | ▼ 7% State avg: 2h 33m per day · National avg: 2h 20m per day |
|
Total Nursing (Weekend)
| 3h 19m per day | ▼ 10% State avg: 3h 41m per day · National avg: 3h 26m per day |
|
Physical Therapist
| 2m per day | ▼ 50% State avg: 4m per day · National avg: 4m per day |
|
RN (Weekend)
| 27m per day | ▼ 34% State avg: 41m per day · National avg: 28m per day |
Occupancy lower than 85% suggests more openings may be available.
This home supports both short-term rehab and long-term care, with residents staying for a wide range of durations.
41% of new residents, usually for short-term rehab.
55% of new residents, often for short stays.
4% of new residents, often for long-term daily care.
Key information about the people who lead and staff this community.
In Minnesota, the Department of Health, Health Regulation Division is the primary authority for conducting onsite inspections and reporting on the quality of care in residential facilities.
Read the full inspection reports for this facility, including detailed findings and corrective actions.
Show Inspection ReportsMinnesota average 6
Last Health inspection on Sep 2025
Minnesota average 23.2
Minnesota average 3.76
Health citations are formal notices following inspections when they fail to comply with safety and care standards.
17 of 26 citations resulted from standard inspections; 8 of 26 resulted from complaint investigations; and 1 of 26 came from combined inspections (standard and complaint).
Minnesota average: 0.7
Minnesota average: 0.5
Data sourced from CMS Health Deficiencies reports. Citation severity codes range from A (least serious) to L (most serious). Immediate Jeopardy (J-L) citations indicate situations where the facility's noncompliance has placed residents at risk of death or serious harm.
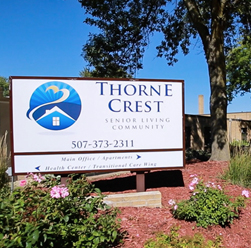
Thorne Crest Retirement Center is located in Albert Lea, Minnesota.
Here are the financial assistance programs available to residents in Minnesota.
![]() 0.0 miles from city center
0.0 miles from city center
![]() Estimated distance in miles from Albert Lea's city center to Thorne Crest Retirement Center's address, calculated via Google Maps.
Estimated distance in miles from Albert Lea's city center to Thorne Crest Retirement Center's address, calculated via Google Maps.
Add your location
This data corresponds to Q2 2025 and is based on CMS Payroll-Based Journal.
Minnesota average ratio: 2.22:1
Minnesota average: 7.5 hours
Manages medical care and health needs.
This role is partially covered by contractors.
Assists with medical care and medications.
This role is partially covered by contractors.
Helps with daily care and mobility.
This role is partially covered by contractors.
Total hours from contractors
6,670 contractor hours this quarter
| Certified Nursing Assistant | 19 | 101 | 120 | 8,672 | 91 | 100% | 7.2 |
| Licensed Practical Nurse | 5 | 6 | 11 | 2,175 | 91 | 100% | 8.6 |
| Registered Nurse | 4 | 18 | 22 | 1,481 | 91 | 100% | 7.4 |
| Other Dietary Services Staff | 4 | 0 | 4 | 1,083 | 91 | 100% | 6.2 |
| Administrator | 1 | 1 | 2 | 535 | 64 | 70% | 8 |
| Dietitian | 1 | 0 | 1 | 516 | 63 | 69% | 8.2 |
| Mental Health Service Worker | 1 | 0 | 1 | 508 | 64 | 70% | 7.9 |
| Clinical Nurse Specialist | 1 | 0 | 1 | 492 | 62 | 68% | 7.9 |
| Nurse Practitioner | 1 | 0 | 1 | 483 | 62 | 68% | 7.8 |
| Speech Language Pathologist | 0 | 1 | 1 | 155 | 21 | 23% | 7.4 |
| Occupational Therapy Aide | 0 | 1 | 1 | 78 | 16 | 18% | 4.9 |
| Occupational Therapy Assistant | 0 | 1 | 1 | 37 | 23 | 25% | 1.6 |
| Respiratory Therapy Technician | 0 | 1 | 1 | 22 | 9 | 10% | 2.4 |
| Physical Therapy Assistant | 0 | 1 | 1 | 5 | 6 | 7% | 0.8 |
| Physical Therapy Aide | 0 | 1 | 1 | 4 | 2 | 2% | 1.9 |
| Medical Director | 0 | 1 | 1 | 1 | 1 | 1% | 1 |
Source: CMS Long-Term Care Facility Characteristics (Data as of Jan 2026)
Residents meet regularly to discuss policies, care quality, and activities
Family members meet regularly to discuss policies, care quality, and activities
Part of a Continuing Care Retirement Community offering multiple care levels
Organized group of family members that meets regularly to discuss facility policies, resident care, and activities.
Organized group of residents that meets regularly to discuss facility policies, quality of life, and activities.
Data sourced from CMS Long-Term Care Facility Characteristics quarterly report. Payer mix reflects the current resident census by primary payment source.
These measures show how residents usually do over time at this home, based on health outcomes and preventive care.
Minnesota average: 11.1
Minnesota average: 22.6
Minnesota average: 18.9%
Minnesota average: 23.8%
Minnesota average: 25.0%
Minnesota average: 3.7%
Minnesota average: 5.4%
Minnesota average: 2.7%
Minnesota average: 4.1%
Minnesota average: 4.4%
Minnesota average: 17.2%
Minnesota average: 97.3%
Minnesota average: 96.0%
Minnesota average: 88.9%
Minnesota average: 1.9%
Minnesota average: 82.6%
Minnesota average: 23.1%
Minnesota average: 14.0%
Minnesota average: 0.8%
Minnesota average: 53.7%
Minnesota average: 50.6%
Quality measures are calculated from Minimum Data Set (MDS) assessments. For most measures, lower percentages indicate better care quality.
Federal penalties imposed by CMS for regulatory violations, including civil money penalties (fines) and denials of payment for new Medicare/Medicaid admissions.
Source: CMS Penalties Database (Data as of Jan 2026)
Minnesota average: $44K
Minnesota average: 2.0
Minnesota average: 0.4
Penalties are imposed by CMS for violations of federal nursing home regulations.
1 penalty in the past 3 years
Oct 15, 2024 · $43K
Last updated: Jan 2026
Historical financial and operational data for Thorne Crest Retirement Center based on CMS SNF Cost Reports.
Care Cost Calculator: See Prices in Your Area
Nursing Home Data Explorer
Don’t Wait Too Long: 7 Red Flag Signs Your Parent Needs Assisted Living Now
The True Cost of Assisted Living in 2025 – And How Families Are Paying For It
Understanding Senior Living Costs: Pricing Models, Discounts & Financial Assistance
Thorne Crest Retirement Center has a walk score of 84. Very walkable. Most errands can be accomplished on foot, and many essentials are within a short walk.
Yes — see the floorplan options available at Thorne Crest Retirement Center on this page.
Thorne Crest Retirement Center has 105 beds.
Yes — there are 5 photos of Thorne Crest Retirement Center in the photo gallery on this page.
Thorne Crest Retirement Center is located at 1201 Garfield Avenue.
(507) 373-2311 will put you in contact with the team at Thorne Crest Retirement Center.
Thorne Crest Retirement Center is in Freeborn County.


Thank you for your interest!
Our team will be in touch shortly to help with next steps.
