Nursing Home

Trinity Elms Health and Rehab

Nursing Home

Trinity Elms Health and Rehab

7449 Fair Oaks Dr, Clemmons, NC 27012 View map
Overview of Trinity Elms Health and Rehab

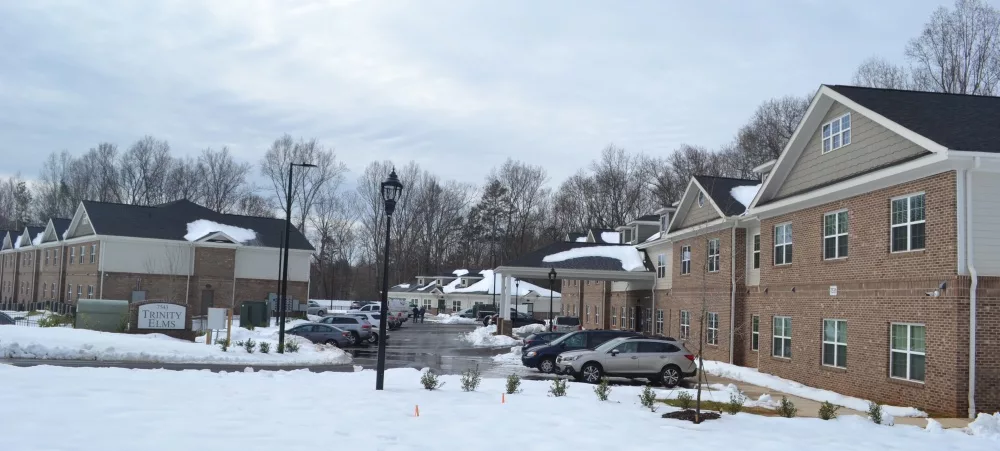
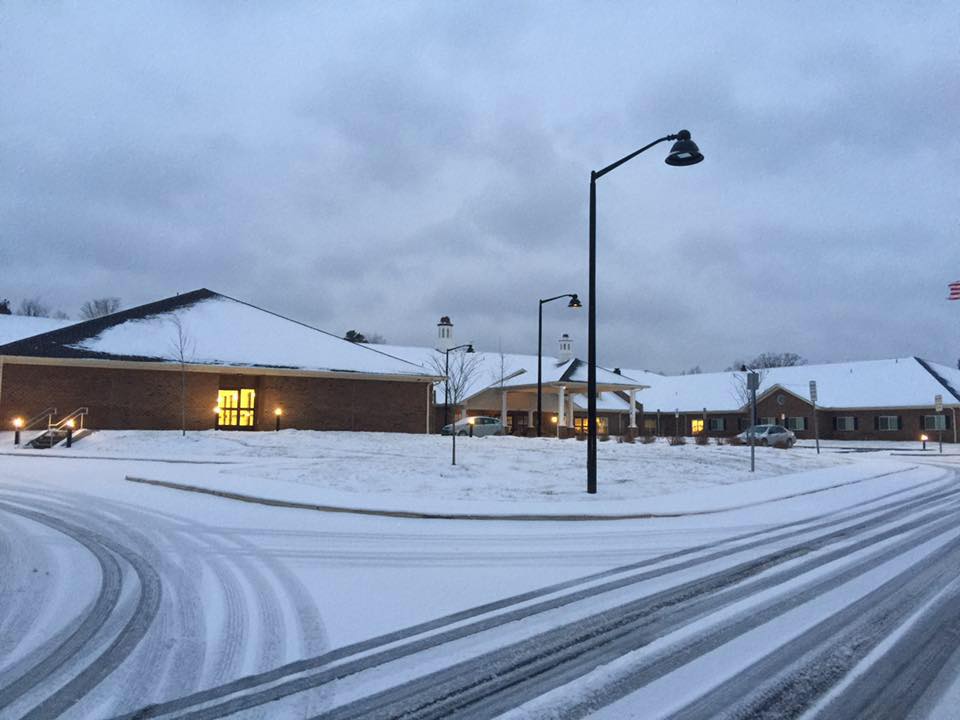
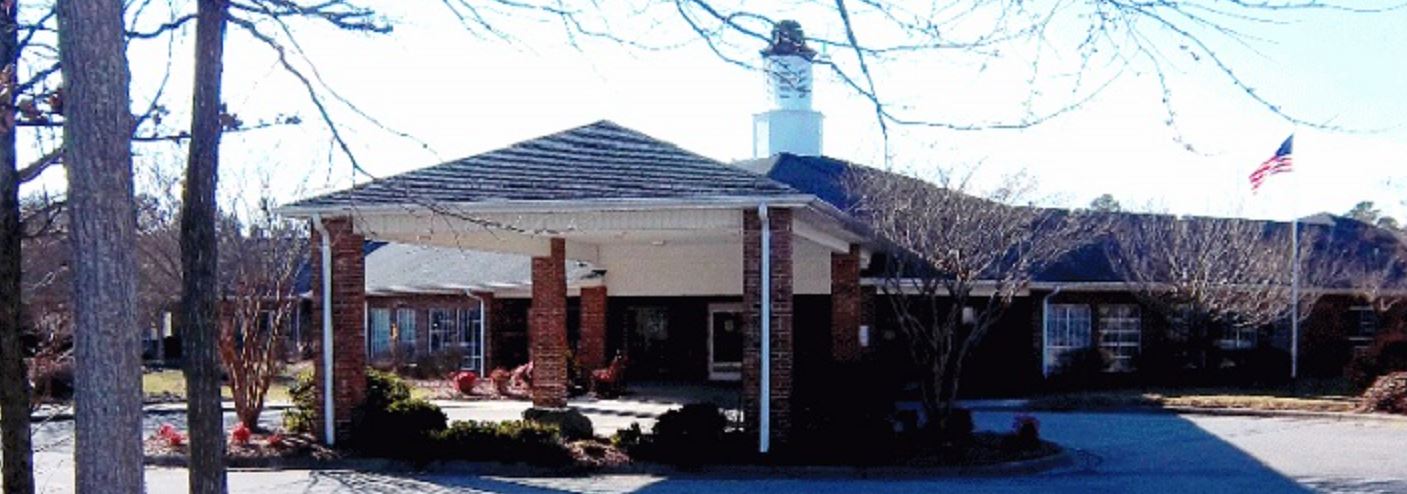
Situated in the picturesque surroundings of Clemmons, North Carolina, Trinity Elms encompasses a diverse array of services designed to cater to the multifaceted needs of its residents. This vibrant campus extends its offerings to include assisted living, memory care, skilled nursing care, rehabilitation, and independent living apartments. Operated by the not-for-profit Lutheran Services Carolinas, Trinity Elms boasts amenities that may otherwise be considered cost-prohibitive at for-profit facilities.

Trinity Elms Assisted Living’s staff is dedicated to walking alongside residents, providing them with the care and support required to preserve their cherished independence within a community that radiates warmth. Unique highlights include an inviting ice cream parlor, outdoor walking trails, and a serene indoor courtyard, all fostering a sense of belonging. Trinity Elms’ recognition further exemplifies this dedication to senior residents’ well-being and comfort as a 2016 Excellence in Action award winner, a testament to the high satisfaction rates experienced by its residents.

(336) 747-1153

Quality ratings

Measured by Centers for Medicare & Medicaid Services (CMS)

Overall rating Info Official CMS rating based on health inspections, staffing and quality measures.
2/5
North Carolina average: 2.8/5
Health Inspection Info Official CMS rating based on deficiencies found during state health inspections.
3/5
North Carolina average: 2.8/5
Staffing Info Official CMS rating based on nurse staffing hours per resident per day.
3/5
North Carolina average: 2.7/5
Quality Measures Info Official CMS rating based on clinical outcomes for residents.
1/5
North Carolina average: 3.2/5

Nursing care per resident

Info Average daily nursing hours per resident (adjusted for acuity). Higher values indicate more nursing time per resident.
4h 6m per day

This home provides 3% more nursing time per resident than the North Carolina average.

North Carolina average: 3h 59m per day

Staffing hours breakdown

Info Hours of care per resident per day, broken down by staff type. Data from CMS Medicare.
Staff type Facility State avg National avg
Registered Nurse (RN) Info Registered nurse hours per resident per day. 38m per day 35m per day 41m per day
Nurse Aide Info Nurse aide hours per resident per day. 2h 51m per day 2h 19m per day 2h 21m per day
Total Nursing (Weekend) Info Total number of nurse staff hours per resident per day on weekends. 4h 0m per day 3h 20m per day 3h 26m per day
Physical Therapist Info Physical therapist staff hours per resident per day. 4m per day 5m per day 4m per day
RN (Weekend) Info Registered nurse hours per resident per day on weekends. 32m per day 23m per day 29m per day

Capacity and availability

Medium-capacity home

Offers a balance of services and community atmosphere.

Total beds 100

This home usually has availability

Lower occupancy suggests more openings may be available.

Lower demand than the North Carolina average
Occupancy rate 81.7%
Residents per day (avg) 90
Occupancy rate
81.7%
Residents per day (avg)
90

Who this home usually serves

TYPE OF STAY

Mix of rehab and long-term care

This home supports both short-term rehab and long-term care, with residents staying for a wide range of durations.

Breakdown by payment type

Medicare

39% of new residents, usually for short-term rehab.

Typical stay 22 days

Private pay

54% of new residents, often for short stays.

Typical stay 2 - 3 months

Medicaid

7% of new residents, often for long-term daily care.

Typical stay 2 years

Finances and operations

Voluntary non-profit community
Operated by a church.
Home revenue
$16.2M
Surplus of revenue
$834.9K
Voluntary non-profit community Operated by a church.
Home revenue
$16,199,964.00
Surplus of revenue
$834,876.00
Payroll costs Info The portion of the home's budget spent on staff, including nurses, caregivers, and other employees who support care and operations.
$5.0M
30.8% of revenue
Other operating costs Info All remaining costs needed to run the home, such as food, utilities, building maintenance, supplies and administrative expenses.
$10.4M
Total costs $15.4M

Types of Care at Trinity Elms Health and Rehab

Assisted Living Independent Living Skilled Nursing
Contact Trinity Elms Health and Rehab

Health Inspection History

Inspections
Total health inspections 5

North Carolina average 4


Last Health inspection on Apr 2025

Total health citations 11
Citations per inspection
2.2

Health citations are formal notices following inspections when they fail to comply with safety and care standards.

7 of 11 citations resulted from standard inspections; 3 of 11 resulted from complaint investigations; and 1 of 11 came from combined inspections (standard and complaint).

Breakdown of citation severity (last 3 years)
Critical Health citations More info 2
54% worse than North Carolina average

North Carolina average: 1.3


Serious Health citations More info 0
100% better than North Carolina average

North Carolina average: 0.9

2 critical citations More info North Carolina average: 1.3

0 serious citations More info North Carolina average: 0.9

8 moderate citations More info North Carolina average: 17.1

1 minor citation More info North Carolina average: 1.6
Citations history (last 3 years)
Pharmacy moderate citation Apr 30, 2025
Corrected

Administration moderate citation Jan 17, 2025
Corrected

Pharmacy moderate citation Jan 17, 2025
Corrected

Quality of Care moderate citation Jan 17, 2025
Corrected

Compare Nursing Homes around Clemmons

The information below is reported by the North Carolina Department of Health and Human Services, Division of Health Service Regulation.
Trinity Elms Health and Rehab
SNF

Nursing Home 24/7 care needed

AL

Assisted Living For seniors needing help with daily tasks but not full-time nursing.

IL

Independent Living For self-sufficient seniors seeking community and minimal assistance.

N

Nursing

Clemmons
100
-
26
-
81.7%
$15,982,900.00
$4,985,173.00
31.2%
90.30
2/5
4.0944
3/5
3/5
1/5
2
11
2
+31%
+3%
+7%
Trinity Elms
SNF

Nursing Home 24/7 care needed

AL

Assisted Living For seniors needing help with daily tasks but not full-time nursing.

NC 27012
100
-
-
-
81.7%
$15,982,900.00
$4,985,173.00
31.2%
90
2/5
4.0944
3/5
3/5
1/5
2
11
2
+31%
+3%
+7%
Cedar Hills Center for Nursing and Rehabilitation
SNF

Nursing Home 24/7 care needed

AL

Assisted Living For seniors needing help with daily tasks but not full-time nursing.

N

Nursing

Clemmons
94
-
28
ACCORDIUS HEALTH AT CLEMMONS, LLC
85.5%
$10,188,508.00
$1,893,460.00
18.6%
80.90
1/5
3.6189
2/5
1/5
1/5
2
45
2
-63%
-9%
+12%
Always Best Care Senior Services
SNF

Nursing Home 24/7 care needed

AL

Assisted Living For seniors needing help with daily tasks but not full-time nursing.

HC

Home Care

N

Nursing

Kernersville
-
A+
30
-
-
-
-
-
-
-
-
-
-
-
-
-
-
-
-
-

Places of interest near Trinity Elms Health and Rehab

Address 1.7 miles from city center — 2.57 miles to nearest hospital (Davie Medical Center)

Address 7449 Fair Oaks Dr, Clemmons, NC 27012

Calculate Travel Distance to Trinity Elms Health and Rehab

Add your location

Address

Staffing Data

Source: CMS Payroll-Based Journal (Q2 2025)

161
Total Staff
131
Employees
30
Contractors
39,096
Total Hours (Quarter)
57
Avg Staff/Day
7.5
Avg Shift (hrs)
Nursing Staff Breakdown
Role Count Avg Shift (hrs) Uses Contractors?
Registered Nurse197.7 No
Licensed Practical Nurse258.3 No
Certified Nursing Assistant627.6 No
Staff by Category
Administration
3 staff
6.8hs shift avg
Nursing Staff
117 staff
7.8hs shift avg
Physicians & Practitioners
6 staff
8hs shift avg
Therapy Services
21 staff
5.9hs shift avg
Activities & Recreation
0 staff
0hs shift avg
Social Services
8 staff
6.4hs shift avg
Dietary Services
3 staff
7.9hs shift avg
Other Services
3 staff
7.4hs shift avg
Contractor Analysis
9.3%
of total hours from contractors
3,649 contractor hours this quarter
Respiratory Therapy Technician: 6 Physical Therapy Aide: 5 Speech Language Pathologist: 3 Qualified Social Worker: 8 Physical Therapy Assistant: 6 Medical Director: 1 Occupational Therapy Assistant: 1
Role Employees Contractors Total Staff Total Hours Days Worked % of Days Avg Shift (hrs)
Certified Nursing Assistant6206218,80591100%7.6
Licensed Practical Nurse250256,46391100%8.3
Medication Aide/Technician100102,88691100%8.5
Registered Nurse190191,53291100%7.7
Dental Services Staff3031,3696976%7.4
Qualified Social Worker0881,2167380%6.4
Clinical Nurse Specialist4041,1416774%8
Other Dietary Services Staff2029747785%7.9
Physical Therapy Assistant0669417077%7.3
Administrator2029366571%8
Speech Language Pathologist0336806571%6.5
Nurse Practitioner2024635864%8
RN Director of Nursing1014415560%8
Dietitian1014385662%7.8
Respiratory Therapy Technician0663726774%4.7
Physical Therapy Aide0553716571%4.3
Occupational Therapy Assistant011431213%3.5
Medical Director011282527%1.1

Facility Characteristics

Source: CMS Long-Term Care Facility Characteristics (Data as of Jan 2026)

Total census
89 residents
Residents by payment source
Medicare
9 residents (10.1%)
Medicaid
33 residents (37.1%)
Private pay or other
47 residents (52.8%)
Programs & Services
Residents' Group

Residents meet regularly to discuss policies, care quality, and activities

CCRC

Part of a Continuing Care Retirement Community offering multiple care levels

Active Resident Council

Organized group of residents that meets regularly to discuss facility policies, quality of life, and activities.

Quality of care over time

These measures show how residents usually do over time at this home, based on health outcomes and preventive care.

High-risk clinical events score Info A composite score based on pressure ulcers, falls with injury, weight loss, walking ability decline, and activities of daily living decline. 20.9
82% worse than North Carolina average

North Carolina average: 11.5

Functional decline score Info A composite score based on activities of daily living decline, walking ability decline, and incontinence. 35.7
73% worse than North Carolina average

North Carolina average: 20.6

Long-stay resident measures
Significantly below average North Carolina avg: 2.9 Info CMS star rating based on long-stay quality measure performance. 5 stars = significantly above average, 1 star = significantly below average.
Need for Help with Daily Activities Increased Info Percent of long-stay residents whose need for help with daily activities has increased 24.2%
38% worse than North Carolina average

North Carolina average: 17.5%

Walking Ability Worsened Info Percent of long-stay residents whose ability to move independently worsened 54.0%
132% worse than North Carolina average

North Carolina average: 23.3%

Low Risk Residents with Bowel/Bladder Incontinence Info Percent of low risk long-stay residents who lose control of their bowels or bladder 28.9%
35% worse than North Carolina average

North Carolina average: 21.4%

Falls with Major Injury Info Percent of long-stay residents experiencing one or more falls with major injury 4.1%
13% worse than North Carolina average

North Carolina average: 3.6%

High Risk Residents with Pressure Ulcers Info Percent of long-stay high risk residents with pressure ulcers 8.1%
28% worse than North Carolina average

North Carolina average: 6.3%

Urinary Tract Infection Info Percent of long-stay residents with a urinary tract infection 3.1%
19% worse than North Carolina average

North Carolina average: 2.6%

Lost Too Much Weight Info Percent of long-stay residents who lose too much weight 14.0%
90% worse than North Carolina average

North Carolina average: 7.4%

Depressive Symptoms Info Percent of long-stay residents who have depressive symptoms 0.7%
83% better than North Carolina average

North Carolina average: 4.4%

Antipsychotic Use Info Percent of long-stay residents who received an antipsychotic medication 15.5%
16% worse than North Carolina average

North Carolina average: 13.4%

Pneumococcal Vaccine Info Percent of long-stay residents assessed and appropriately given the pneumococcal vaccine 98.6%
8% better than North Carolina average

North Carolina average: 91.6%

Influenza Vaccine Info Percent of long-stay residents assessed and appropriately given the seasonal influenza vaccine 100.0%
6% better than North Carolina average

North Carolina average: 94.1%

Hospitalizations per 1,000 days Info Number of hospitalizations per 1,000 long-stay resident days. 0.99
44% better than North Carolina average

North Carolina average: 1.77

ED visits per 1,000 days Info Number of outpatient emergency department visits per 1,000 long-stay resident days. 1.95
7% worse than North Carolina average

North Carolina average: 1.82

Short-stay resident measures
Significantly below average North Carolina avg: 2.7 Info CMS star rating based on short-stay quality measure performance. 5 stars = much above average, 1 star = much below average.
Pneumococcal Vaccine Info Percent of short-stay residents assessed and appropriately given the pneumococcal vaccine 82.4%
In line with North Carolina average

North Carolina average: 79.9%

Antipsychotic medication increase Info Percent of short-stay residents who newly received an antipsychotic medication 1.3%
13% better than North Carolina average

North Carolina average: 1.5%

Influenza Vaccine Info Percent of short-stay residents assessed and appropriately given the seasonal influenza vaccine 83.1%
6% better than North Carolina average

North Carolina average: 78.1%

Re-hospitalized after SNF stay Info Percentage of short-stay residents who were re-hospitalized after their nursing home admission. 31.9%
39% worse than North Carolina average

North Carolina average: 22.9%

Emergency department visits Info Percentage of short-stay residents who had an outpatient emergency department visit. 21.8%
65% worse than North Carolina average

North Carolina average: 13.2%

Falls with major injury Info Percentage of SNF residents who experience falls with major injury during their stay. 0.9%
14% worse than North Carolina average

North Carolina average: 0.8%

Ability to care for self at discharge Info Percentage of residents at or above expected ability to care for themselves at discharge. 50.6%
6% worse than North Carolina average

North Carolina average: 53.7%

Successful return to home or community Info Rate of successful return to home or community from a skilled nursing facility. 46.8%
7% worse than North Carolina average

North Carolina average: 50.6%

Penalties and fines

Federal penalties imposed by CMS for regulatory violations, including civil money penalties (fines) and denials of payment for new Medicare/Medicaid admissions.

Source: CMS Penalties Database (Data as of Jan 2026)

Total fines amount $16K
79% lower than North Carolina average

North Carolina average: $76K

Number of fines 2
15% fewer fines than North Carolina average

North Carolina average: 2.3

Payment Denials Info Serious action where Medicare and/or Medicaid temporarily stops payments for new residents until issues are fixed. 0
100% fewer payment denials than North Carolina average

North Carolina average: 0.4

Fines amount comparison
This facility $16K
North Carolina average $76K
Penalty History

Penalties are imposed by CMS for violations of federal nursing home regulations.

Civil Money Penalty Info Fines imposed for noncompliance, which can be assessed per day or per instance of violation. Aug 20, 2024
$8K
Civil Money Penalty Info Fines imposed for noncompliance, which can be assessed per day or per instance of violation. Aug 20, 2024
$8K

Last updated: Jan 2026

Guides for Better Senior Living

Care Cost Calculator: See Prices in Your Area

Nursing Home Data Explorer

Don’t Wait Too Long: 7 Red Flag Signs Your Parent Needs Assisted Living Now

The True Cost of Assisted Living in 2025 – And How Families Are Paying For It

Understanding Senior Living Costs: Pricing Models, Discounts & Financial Assistance

Financial Aid for North Carolina Seniors

Get financial aid guidance

Community Alternatives Program for Disabled Adults

NC Medicaid CAP/DA

Age 65+ or disabled, North Carolina resident, Medicaid- eligible, nursing home-level care need.

~$2,829/month (300% FBR, individual).

$2,000 (individual), $3,000 (couple).

High demand; waitlists common in urban areas.

North Carolina Senior Care Options

NC SCO (via NFCSP)

Caregiver of someone 60+ (or with dementia), North Carolina resident.

No strict limit; prioritizes low-income.

Not applicable.

Limited slots; rural/urban balance.

Program of All-Inclusive Care for the Elderly (PACE)

North Carolina PACE (e.g., PACE of the Triad)

Age 55+, NC resident (specific counties), NFLOC, safe with PACE support.

~$2,829/month (Medicaid-eligible); private pay option available.

$2,000 (individual), $3,000 (couple) for Medicaid enrollees.

Available in 10+ counties (e.g., Guilford, Wake); multiple providers (e.g., PACE of the Southern Piedmont).

In-Home Aide Services

North Carolina In-Home Aide Services

Age 60+, NC resident, unable to perform 1+ ADL, at risk of nursing home placement.

No strict cap; prioritizes low-income (~$24,980/year).

Not assessed; need-based.

Family can be aides; varies by county funding.

Medicare Savings Program (MSP)

North Carolina Medicare Savings Program

Age 65+ or disabled, NC resident, Medicare Part A/B.

~$2,510/month (QMB), ~$3,380/month (SLMB), ~$3,598/month (QI)—individual.

$9,430 (individual), $14,130 (couple).

Three tiers; no waitlist; includes Extra Help for Part D.

Low-Income Energy Assistance Program (LIHEAP)

North Carolina LIHEAP

Age 60+ prioritized, NC resident, low-income household.

~$3,970/month (individual, 185% FPL).

Not assessed; income-focused.

Covers oil, gas, electric; emergency aid via Crisis Intervention Program (CIP).

Senior Community Service Employment Program (SCSEP)

North Carolina SCSEP

Age 55+, unemployed, low-income, NC resident.

~$1,983/month (125% FPL).

Not specified; income-focused.

Priority for veterans, rural residents; AARP partnership.

VA Aid and Attendance (A&A) and Housebound Benefits

North Carolina VA Aid and Attendance/Housebound

Age 65+ or disabled veteran/spouse, NC resident, wartime service, need for ADL help (A&A) or homebound.

Net income < ~$1,984/month (veteran with dependent, A&A); pension offsets income.

~$155,356 (net worth limit).

High veteran demand in rural/urban areas.

Urgent Repair Program (URP)

North Carolina Urgent Repair Program

Age 60+ prioritized, NC resident, homeowner, low-income.

~$30,258/year (50% AMI, varies by county).

Not strictly assessed; home value considered.

Forgivable at $2,000/year; statewide via local partners.

State/County Special Assistance (SA)

North Carolina Special Assistance

Age 65+ (or disabled), NC resident, in licensed adult care home, low-income.

~$1,255/month (individual, 100% FPL); varies by facility rate.

$2,000 (individual).

Covers assisted living; counties supplement state funds.

Tour Icon
Planning a tour? Check our touring checklist.
Chat Icon
Thinking of living here? We can help you speak to a current resident