Trinity Elms Health and Rehab
Nursing Home, Assisted Living, Independent Living & Memory Care · Clemmons, NC
CMS overall rating Info CMS (the Centers for Medicare & Medicaid Services) is the federal agency that rates nursing home quality. Its Overall Rating runs from 1 to 5 stars, combining health inspections, staffing, and quality measures, with inspections weighted most heavily.

Trinity Elms Health and Rehab

Nursing Home, Assisted Living, Independent Living & Memory Care · Clemmons, NC
CMS overall rating Info CMS (the Centers for Medicare & Medicaid Services) is the federal agency that rates nursing home quality. Its Overall Rating runs from 1 to 5 stars, combining health inspections, staffing, and quality measures, with inspections weighted most heavily.
Calculator: See prices in your area
Trinity Elms Health and Rehab accepts Medicare, Medicaid, and private pay.

Overview of Trinity Elms Health and Rehab

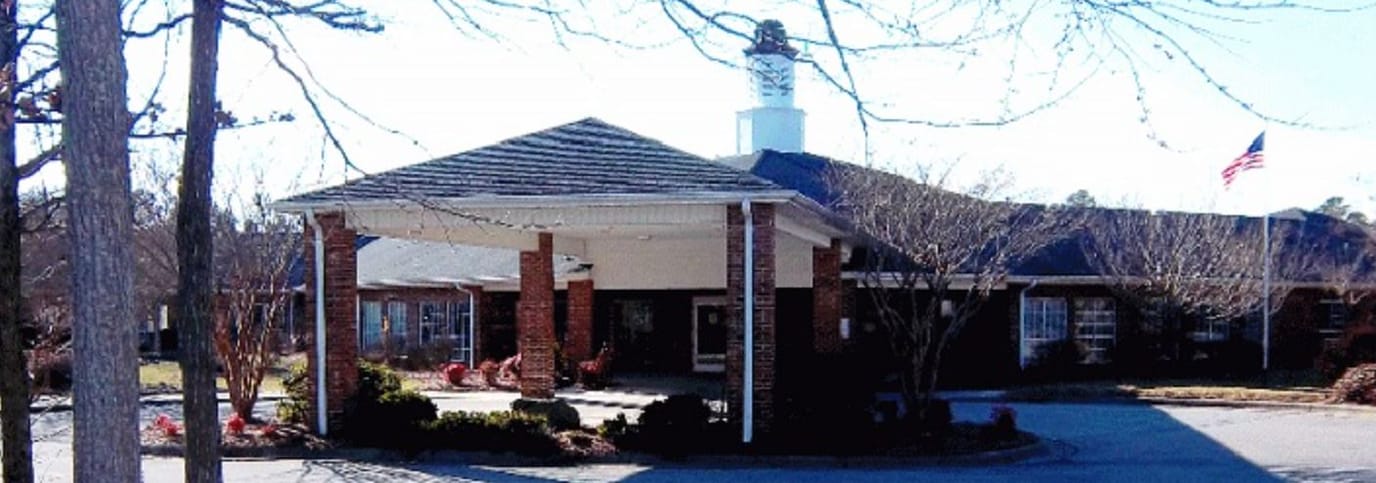
Situated in the picturesque surroundings of Clemmons, North Carolina, Trinity Elms encompasses a diverse array of services designed to cater to the multifaceted needs of its residents. This vibrant campus extends its offerings to include assisted living, memory care, skilled nursing care, rehabilitation, and independent living apartments. Operated by the not-for-profit Lutheran Services Carolinas, Trinity Elms boasts amenities that may otherwise be considered cost-prohibitive at for-profit facilities.

Trinity Elms Assisted Living’s staff is dedicated to walking alongside residents, providing them with the care and support required to preserve their cherished independence within a community that radiates warmth. Unique highlights include an inviting ice cream parlor, outdoor walking trails, and a serene indoor courtyard, all fostering a sense of belonging. Trinity Elms’ recognition further exemplifies this dedication to senior residents’ well-being and comfort as a 2016 Excellence in Action award winner, a testament to the high satisfaction rates experienced by its residents.

(336) 747-1153

Quality ratings

Measured by Centers for Medicare & Medicaid Services (CMS)

Overall rating Info The Overall CMS Rating combines results from health inspections, staffing levels and quality measures. Health inspections carry the most weight. Staffing and quality scores can increase or decrease the final rating based on performance compared to state and national standards.
▼ 28.5% Below NC avg. ▼ 28.5% Below NC avg.NC average: 2.8Click the badge to see the full State ranking.Click here to see the full State ranking.
Health Inspection Info Based on the results of the facility's three most recent standard inspections and any complaint investigations. CMS reviews the number, scope, and severity of deficiencies, with more recent findings weighted more heavily.
▲ 6.2% Above NC avg. ▲ 6.2% Above NC avg.NC average: 2.8Click the badge to see the full State ranking.Click here to see the full State ranking.
Staffing Info Measures average nursing staff hours per resident per day, including Registered Nurses (RNs) and total nursing staff. Ratings are adjusted based on the level of care residents require and are compared to state and national benchmarks.
▲ 50.4% Above NC avg. ▲ 50.4% Above NC avg.NC average: 2.7Click the badge to see the full State ranking.Click here to see the full State ranking.
Quality Measures Info Based on clinical and physical health indicators reported to CMS, such as hospital readmissions, falls, pressure ulcers, and improvements in mobility. These measures reflect how well residents' health needs are being managed.
▼ 68.5% Below NC avg. ▼ 68.5% Below NC avg.NC average: 3.2Click the badge to see the full State ranking.Click here to see the full State ranking.

Staffing hours breakdown

Info Daily nursing hours per resident by staff type, reported to CMS. Higher is generally better — compare this facility to state and national averages to see where staffing stands.

Hours per resident per day — compared to North Carolina state averages

Total nursing care / resident Info This home is ranked 36th out of 90 homes in North Carolina for nurse hours. Total adjusted nursing hours per resident per day, combining RN, LPN, and aide time. CMS adjusts this for case-mix so facilities can be fairly compared.
4h 6m per day
Rank #36 / 90Nurse hours — State benchmarkedThis home is ranked 36th out of 90 homes in North Carolina. Shows adjusted nurse hours per resident per day benchmarked to the North Carolina average, with a ranking across 90 North Carolina facilities. More hours mean more direct care. The national average is about 3.5 hrs; below 3.0 is a red flag.Ranking totals vary by category as each rank only includes facilities that report data for that metric. Homes missing that data point aren't included in the ranking.Click the rank badge to see the full State ranking.Click here to see the full State ranking.
This facility North Carolina avg (3h 59m per day)
vs North Carolina avg
+3%

2 of 6 metrics below state avg

Standout metric Weekend RN is +58% above state avg
Staff type Hours / Day / Resident vs state avg
Registered Nurse (RN) Info RNs hold the highest nursing license and can assess residents, interpret test results, and direct care plans. More RN hours per day often signals stronger clinical oversight and faster response to health changes. 32m per day ▼ 10% State avg: 35m per day · National avg: 41m per day
LPN / LVN Info Licensed Practical Nurses (LPNs) or Licensed Vocational Nurses (LVNs) deliver routine hands-on care — medication administration, wound dressing, and monitoring vital signs. They work under RN supervision and make up a large share of daily bedside care. 56m per day ▲ 8% State avg: 52m per day · National avg: 52m per day
Nurse Aide Info Certified Nurse Aides (CNAs) provide the most direct day-to-day assistance: bathing, dressing, feeding, and mobility. Nurse aide hours are typically the largest staffing category and directly affect residents' quality of life. 2h 49m per day ▲ 22% State avg: 2h 19m per day · National avg: 2h 21m per day
Weekend Total Nursing Info Combined nursing hours (RN + LPN + Nurse Aide) per resident per day on weekends. Staffing often drops on weekends — this figure reveals whether the facility maintains adequate coverage outside of weekday hours. 4h 2m per day ▲ 21% State avg: 3h 20m per day · National avg: 3h 26m per day
Physical Therapist Info Hours per resident per day provided by licensed Physical Therapists (PTs) or PT Assistants. PT services help residents recover mobility after injury or illness and are especially important for post-acute (short-stay) rehabilitation. 4m per day ▼ 11% State avg: 5m per day · National avg: 4m per day
Weekend RN Info Registered nurse hours specifically on weekends. Facilities sometimes reduce RN presence on Saturdays and Sundays — a low weekend RN figure compared to weekday hours can indicate reduced clinical oversight when most administrative staff are absent. 36m per day ▲ 58% State avg: 23m per day · National avg: 29m per day

Capacity and availability

This home usually has availability

Higher occupancy than the North Carolina average: 76.4%
Occupancy rate
81.7% Rank #91 / 264Occupancy rate — State benchmarkedThis home is ranked 91st out of 264 homes in North Carolina. Shows this facility's occupancy rate versus the North Carolina average, with its Statewide rank out of 264. Higher occupancy signals strong local demand and financial stability.Ranking totals vary by category as each rank only includes facilities that report data for that metric. Homes missing that data point aren't included in the ranking.Click the rank badge to see the full State ranking.Click here to see the full State ranking.
Avg. Length of Stay
113 days
Bed community size
100-bed community Rank #79 / 390Bed count — State benchmarkedThis home is ranked 79th out of 390 homes in North Carolina. Shows this facility's certified or reported bed count compared to other North Carolina facilities. Larger communities may offer more amenities, programs, and on-site services for residents and families.Ranking totals vary by category as each rank only includes facilities that report data for that metric. Homes missing that data point aren't included in the ranking.Click the rank badge to see the full State ranking.Click here to see the full State ranking.
A larger shared setting that may offer more common spaces and organized community services.
Walk Score
Walk Score: 26 / 100 Rank #339 / 572Walk Score — State benchmarkedThis home is ranked 339th out of 572 homes in North Carolina. Shows how walkable this facility's neighborhood is compared to the average Walk Score across North Carolina facilities. Higher scores benefit residents, families, and staff.Ranking totals vary by category as each rank only includes facilities that report data for that metric. Homes missing that data point aren't included in the ranking.Click the rank badge to see the full State ranking.Click here to see the full State ranking.
Somewhat walkable. A few nearby services may be reachable on foot, but most trips require transportation.

About this community

Contact Trinity Elms Health and Rehab

Staffing Data

Reporting period: October 1 – December 31, 2025 (Q4 2025). Source: CMS Payroll-Based Journal report.

Total staff 192
Employees 158
Contractors 34
Staff to resident ratio 2.16 : 1
20% more staff per resident than North Carolina average
North Carolina average ratio: 1.80 : 1 North Carolina average ratio: 1.80 : 1See full North Carolina ranking
Avg staff/day 60
Average shift 7.8 hours
0% compared with North Carolina average
North Carolina average: 8 hours North Carolina average shift: 8 hoursSee full North Carolina ranking
Total staff hours (quarter) 43,058

Nursing staff breakdown

Q4 2025 · Oct 1 – Dec 31 More info This data comes from the CMS Payroll-Based Journal report covering October 1 – December 31, 2025.
Registered Nurse

Manages medical care and health needs.

RN Staff Info All 20 RN Staff are full-time employees. No contractors work on this role. 20
Average shift length Info Average shift length. Calculated as total hours divided by days worked and average staff per day. 8.4 hours
Licensed Practical Nurse

Assists with medical care and medications.

LPN Staff Info All 30 LPN Staff are full-time employees. No contractors work on this role. 30
Average shift length Info Average shift length. Calculated as total hours divided by days worked and average staff per day. 8.4 hours
Certified Nursing Assistant

Helps with daily care and mobility.

CNA Staff Info All 78 CNA Staff are full-time employees. No contractors work on this role. 78
Average shift length Info Average shift length. Calculated as total hours divided by days worked and average staff per day. 7.8 hours

Contractor staffing

Q4 2025 · Oct 1 – Dec 31 More info This data comes from the CMS Payroll-Based Journal report covering October 1 – December 31, 2025.

Total hours from contractors

9.8%

4,223 contractor hours this quarter

Qualified Social Worker: 8 Physical Therapy Assistant: 8 Physical Therapy Aide: 6 Respiratory Therapy Technician: 5 Speech Language Pathologist: 5 Medical Director: 1 Occupational Therapy Assistant: 1

Staff by category

Q4 2025 · Oct 1 – Dec 31 More info This data comes from the CMS Payroll-Based Journal report covering October 1 – December 31, 2025.
Certified Nursing Assistant 78 0 78 19,701 92 100% 7.8
Licensed Practical Nurse 30 0 30 6,493 92 100% 8.4
Medication Aide/Technician 11 0 11 3,516 92 100% 7.9
Registered Nurse 20 0 20 2,654 92 100% 8.4
Qualified Social Worker 0 8 8 1,381 80 87% 7
Dental Services Staff 4 0 4 1,335 70 76% 6.7
Other Dietary Services Staff 3 0 3 1,313 79 86% 7.6
RN Director of Nursing 2 0 2 1,186 70 76% 9.4
Clinical Nurse Specialist 5 0 5 1,183 82 89% 8.6
Physical Therapy Assistant 0 8 8 1,036 75 82% 7.2
Administrator 2 0 2 848 65 71% 8
Speech Language Pathologist 0 5 5 812 72 78% 6
Respiratory Therapy Technician 0 5 5 609 78 85% 6.7
Nurse Practitioner 1 0 1 496 62 67% 8
Physical Therapy Aide 0 6 6 293 55 60% 4.4
Occupational Therapy Aide 1 0 1 71 23 25% 3.1
Occupational Therapy Assistant 0 1 1 59 10 11% 5.9
Dietitian 1 0 1 42 7 8% 5.9
Medical Director 0 1 1 33 22 24% 1.5
78 Certified Nursing Assistant
% of Days 100%
30 Licensed Practical Nurse
% of Days 100%
11 Medication Aide/Technician
% of Days 100%
20 Registered Nurse
% of Days 100%
8 Qualified Social Worker
% of Days 87%
4 Dental Services Staff
% of Days 76%
3 Other Dietary Services Staff
% of Days 86%
2 RN Director of Nursing
% of Days 76%
5 Clinical Nurse Specialist
% of Days 89%
8 Physical Therapy Assistant
% of Days 82%
2 Administrator
% of Days 71%
5 Speech Language Pathologist
% of Days 78%
5 Respiratory Therapy Technician
% of Days 85%
1 Nurse Practitioner
% of Days 67%
6 Physical Therapy Aide
% of Days 60%
1 Occupational Therapy Aide
% of Days 25%
1 Occupational Therapy Assistant
% of Days 11%
1 Dietitian
% of Days 8%
1 Medical Director
% of Days 24%

Penalties and fines

Includes penalties issued in 2024

Federal penalties imposed by CMS for regulatory violations, including civil money penalties (fines) and denials of payment for new Medicare/Medicaid admissions.

Source: CMS Penalties Database (Data as of Jan 2026)

Total fines amount $16K Rank #62 / 97Federal fines — State benchmarkedThis home is ranked 62nd out of 97 homes in North Carolina. Shows this facility's cumulative CMS federal fine dollars versus the North Carolina average among facilities with fines, and where it ranks among 97 facilities in the pool. Lower total dollars mean a better rank.Ranking totals vary by category as each rank only includes facilities that report data for that metric. Homes missing that data point aren't included in the ranking.Click the rank badge to see the full State ranking.Click here to see the full State ranking.
79% lower than North Carolina average

North Carolina average: $76K

Number of fines 2
15% fewer fines than North Carolina average

North Carolina average: 2.3

Payment Denials Info Serious action where Medicare and/or Medicaid temporarily stops payments for new residents until issues are fixed. 0
100% fewer payment denials than North Carolina average

North Carolina average: 0.4

Fines amount comparison
This facility $16K
North Carolina average $76K
Penalty History

Penalties are imposed by CMS for violations of federal nursing home regulations.

2 penalties in the past 3 years

Multiple penalties were reported in the last 3 years.

Civil Money Penalty Info Fines imposed for noncompliance, which can be assessed per day or per instance of violation. Aug 20, 2024
$8K
Civil Money Penalty Info Fines imposed for noncompliance, which can be assessed per day or per instance of violation. Aug 20, 2024
$8K

Last updated: Jan 2026

Quality of care over time

These measures show how residents usually do over time at this home, based on health outcomes and preventive care.

High-risk clinical events score Info A composite score based on pressure ulcers, falls with injury, weight loss, walking ability decline, and activities of daily living decline. 20.9
82% worse than North Carolina average

North Carolina average: 11.5

Functional decline score Info A composite score based on activities of daily living decline, walking ability decline, and incontinence. 35.7
73% worse than North Carolina average

North Carolina average: 20.6

Long-stay resident measures
Significantly below average North Carolina avg: 2.9 Info CMS star rating based on long-stay quality measure performance. 5 stars = significantly above average, 1 star = significantly below average.
Need for Help with Daily Activities Increased Info Percent of long-stay residents whose need for help with daily activities has increased 24.2%
38% worse than North Carolina average

North Carolina average: 17.5%

Walking Ability Worsened Info Percent of long-stay residents whose ability to move independently worsened 54.0%
132% worse than North Carolina average

North Carolina average: 23.3%

Low Risk Residents with Bowel/Bladder Incontinence Info Percent of low risk long-stay residents who lose control of their bowels or bladder 28.9%
35% worse than North Carolina average

North Carolina average: 21.4%

Falls with Major Injury Info Percent of long-stay residents experiencing one or more falls with major injury 4.1%
13% worse than North Carolina average

North Carolina average: 3.6%

High Risk Residents with Pressure Ulcers Info Percent of long-stay high risk residents with pressure ulcers 8.1%
28% worse than North Carolina average

North Carolina average: 6.3%

Urinary Tract Infection Info Percent of long-stay residents with a urinary tract infection 3.1%
19% worse than North Carolina average

North Carolina average: 2.6%

Lost Too Much Weight Info Percent of long-stay residents who lose too much weight 14.0%
90% worse than North Carolina average

North Carolina average: 7.4%

Depressive Symptoms Info Percent of long-stay residents who have depressive symptoms 0.7%
83% better than North Carolina average

North Carolina average: 4.4%

Antipsychotic Use Info Percent of long-stay residents who received an antipsychotic medication 15.5%
16% worse than North Carolina average

North Carolina average: 13.4%

Pneumococcal Vaccine Info Percent of long-stay residents assessed and appropriately given the pneumococcal vaccine 98.6%
8% better than North Carolina average

North Carolina average: 91.6%

Influenza Vaccine Info Percent of long-stay residents assessed and appropriately given the seasonal influenza vaccine 100.0%
6% better than North Carolina average

North Carolina average: 94.1%

Hospitalizations per 1,000 days Info Number of hospitalizations per 1,000 long-stay resident days. 0.99
44% better than North Carolina average

North Carolina average: 1.77

ED visits per 1,000 days Info Number of outpatient emergency department visits per 1,000 long-stay resident days. 1.95
7% worse than North Carolina average

North Carolina average: 1.82

Short-stay resident measures
Significantly below average North Carolina avg: 2.9 Info CMS star rating based on short-stay quality measure performance. 5 stars = much above average, 1 star = much below average.
Pneumococcal Vaccine Info Percent of short-stay residents assessed and appropriately given the pneumococcal vaccine 82.4%
In line with North Carolina average

North Carolina average: 79.9%

Antipsychotic medication increase Info Percent of short-stay residents who newly received an antipsychotic medication 1.3%
13% better than North Carolina average

North Carolina average: 1.5%

Influenza Vaccine Info Percent of short-stay residents assessed and appropriately given the seasonal influenza vaccine 83.1%
6% better than North Carolina average

North Carolina average: 78.1%

Re-hospitalized after SNF stay Info Percentage of short-stay residents who were re-hospitalized after their nursing home admission. 31.9%
39% worse than North Carolina average

North Carolina average: 22.9%

Emergency department visits Info Percentage of short-stay residents who had an outpatient emergency department visit. 21.8%
65% worse than North Carolina average

North Carolina average: 13.2%

Falls with major injury Info Percentage of SNF residents who experience falls with major injury during their stay. 0.9%
14% worse than North Carolina average

North Carolina average: 0.8%

Ability to care for self at discharge Info Percentage of residents at or above expected ability to care for themselves at discharge. 50.6%
6% worse than North Carolina average

North Carolina average: 53.7%

Successful return to home or community Info Rate of successful return to home or community from a skilled nursing facility. 46.8%
7% worse than North Carolina average

North Carolina average: 50.6%

Breakdown by payment type

Medicare

39% of new residents, usually for short-term rehab.

Typical stay 22 days

Private pay

54% of new residents, often for short stays.

Typical stay 2 - 3 months

Medicaid

7% of new residents, often for long-term daily care.

Typical stay 2 years

Facility Characteristics

Source: CMS Long-Term Care Facility Characteristics (Data as of Jan 2026)

Total residents 89
Medicare
9
10.1% of residents
Medicaid
33
37.1% of residents
Private pay or other
47
52.8% of residents
Programs & Services
Residents Group

Residents meet regularly to discuss policies, care quality, and activities

CCRC

Part of a Continuing Care Retirement Community offering multiple care levels

Active Resident Council

Organized group of residents that meets regularly to discuss facility policies, quality of life, and activities.

Finances and operations

Based on CMS SNF Cost Report for fiscal year ending in 09/2023.

Governmental community
Operated by state authorities.
Net patient revenue Info Net patient revenue — what the home actually collects for resident care, after contractual allowances, bad debt and discounts are subtracted from its gross charges (CMS cost report, Worksheet G-3). It covers resident care only; money the home earns from other sources is shown separately as "Other income."
$10.6M
Net patient income Info Net patient income: net patient revenue minus the home's total operating expenses. A positive figure means it earns more from resident care than it spends to deliver it; a negative figure means the opposite. It excludes non-operating "other income."
$617.8K
Governmental community Operated by state authorities.
Net patient revenue Info Net patient revenue — what the home actually collects for resident care, after contractual allowances, bad debt and discounts are subtracted from its gross charges (CMS cost report, Worksheet G-3). It covers resident care only; money the home earns from other sources is shown separately as "Other income."
$10.6M Rank #42 / 97Revenue — State benchmarkedThis home is ranked 42nd out of 97 homes in North Carolina. Shows this facility's annual revenue compared to the North Carolina average. Higher revenue generally means more resources for staffing and capital — read alongside Payroll %.Ranking totals vary by category as each rank only includes facilities that report data for that metric. Homes missing that data point aren't included in the ranking.Click the rank badge to see the full State ranking.Click here to see the full State ranking.
Net patient income Info Net patient income: net patient revenue minus the home's total operating expenses. A positive figure means it earns more from resident care than it spends to deliver it; a negative figure means the opposite. It excludes non-operating "other income."
$617.8K
Other income Info Money the home earns outside of resident care — such as investments, grants, rentals and other non-operating sources (CMS cost report, Worksheet G-3). It is tracked separately from net patient revenue: it is not part of that figure, and it is not included in net patient income.
$217.1K
Payroll costs Info Staff salaries plus wage-related costs — benefits such as payroll taxes, health insurance and retirement — from the home's own accounting records (CMS cost report, Worksheet A). Contract or agency labor is counted separately, under other operating costs. Rank #56 / 97Payroll — State benchmarkedThis home is ranked 56th out of 97 homes in North Carolina. Shows total annual staff payroll benchmarked to the North Carolina average. Higher payroll investment relative to peers often signals better staffing and less reliance on cheaper contract labor.Ranking totals vary by category as each rank only includes facilities that report data for that metric. Homes missing that data point aren't included in the ranking.Click the rank badge to see the full State ranking.Click here to see the full State ranking.
$5.7M 54.2% of net patient revenue Info Payroll as a share of revenue: staff salaries and wage-related benefits divided by net patient revenue. A higher figure means more of each revenue dollar goes to staff pay. Rank #62 / 97Payroll % — State benchmarkedThis home is ranked 62nd out of 97 homes in North Carolina. Shows payroll as a percentage of revenue versus the North Carolina average. Well-run North Carolina facilities typically land around 49–62% — the top third Statewide. Below 25% may signal understaffing or heavy agency use — read with Staffing ratings.Ranking totals vary by category as each rank only includes facilities that report data for that metric. Homes missing that data point aren't included in the ranking.Click the rank badge to see the full State ranking.Click here to see the full State ranking.
Other operating costs Info Everything it costs to run the home apart from payroll — food, utilities, supplies, maintenance, contract labor and administration. Calculated as total operating expense minus payroll (staff salaries and wage-related benefits).
$4.2M
Total costs Info The home's total operating expense for the year — all the costs of running it, salaries included (CMS cost report, Worksheet G-3).
$10.0M

Who this home usually serves

TYPE OF STAY

Mix of rehab and long-term care

This home supports both short-term rehab and long-term care, with residents staying for a wide range of durations.

Most new residents arrive under private pay (54% of admissions), and a typical private pay stay runs around 2 - 3 months.

Admissions
275 total

Coverage residents most often arrive under.

Medicare 39%
Private pay 54%
Medicaid 7%
Discharges
264 total

Coverage residents most often leave under.

Medicare 32%
Private pay 55%
Medicaid 13%

Places of interest near Trinity Elms Health and Rehab

Address 1.7 miles from city center Info Estimated distance in miles from Clemmons's city center to Trinity Elms Health and Rehab's address, calculated via Google Maps. — 2.57 miles to nearest hospital (Davie Medical Center)

Calculate Travel Distance to Trinity Elms Health and Rehab

Add your location

Address

Compare Nursing Home around Clemmons

The information below is reported by the North Carolina Department of Health and Human Services, Division of Health Service Regulation.

2 facilities compared · CMS & NC Dept. of Health data

Trinity Elms Health and Rehab
NH
AL
IL
MC
Clemmons (Fair Oaks Drive)
100
Facility 100
NC AVG 72
Rank #79 / 390
81.7%
Facility 81.7%
NC AVG 76.4%
Rank #91 / 264
+7%
4.09
Facility 4.09
NC AVG 3.98
Rank #36 / 90
+14% +3%
$15.6k
Facility $15.6k
NC AVG $74.6k
Rank #62 / 97
11
Facility 11
NC AVG 20.9
Rank #35 / 95
2.2
Facility 2.2
NC AVG 5.0
Rank #22 / 95
2 90 -
26
Facility 26
NC AVG 33
Rank #339 / 572
-
$10.6M
Facility $10.6M
NC AVG $13.2M
Rank #42 / 97
$5.7M
Facility $5.7M
NC AVG $4.9M
Rank #56 / 97
54.2%
Facility 54.2%
NC AVG 39.8%
Rank #62 / 97
345565
Cedar Hills Center for Nursing and Rehabilitation
NH
AL
Clemmons (Meadowbrook)
94
Facility 94
NC AVG 72
Rank #112 / 390
85.5%
Facility 85.5%
NC AVG 76.4%
Rank #72 / 264
+12%
3.62
Facility 3.62
NC AVG 3.98
Rank #64 / 90
-76% -9%
$11.3k
Facility $11.3k
NC AVG $74.6k
Rank #79 / 97
45
Facility 45
NC AVG 20.9
Rank #89 / 95
9.0
Facility 9.0
NC AVG 5.0
Rank #91 / 95
2 85 -
28
Facility 28
NC AVG 33
Rank #328 / 572
Accordius Health At Clemmons, LLC
$9.7M
Facility $9.7M
NC AVG $13.2M
Rank #78 / 97
$2.1M
Facility $2.1M
NC AVG $4.9M
Rank #66 / 97
22%
Facility 22%
NC AVG 39.8%
Rank #14 / 97
345131

Financial Assistance for
Nursing Home in North Carolina

Trinity Elms Health and Rehab is located in Clemmons, North Carolina.
Here are the financial assistance programs available to residents in North Carolina.

Get Financial aid guidance

Community Alternatives Program for Disabled Adults

NC Medicaid CAP/DA

Age 65+ or disabled
General North Carolina resident, Medicaid- eligible, nursing home-level care need.
Income Limits (2025) ~$2,829/month 300% FBR, individual
Asset Limits $2,000 (individual), $3,000 (couple).
NC

High demand; waitlists common in urban areas.

Benefits
Personal care (5-7 hours/day) Respite (240 hours/year) Adult day care ($60/day) Home modifications ($1,500 avg.)

North Carolina Senior Care Options

NC SCO (via NFCSP)

Age Caregiver of someone 60+ (or with dementia)
General North Carolina resident.
Income Limits No strict limit; prioritizes low-income.
Asset Limits Not applicable.
NC

Limited slots; rural/urban balance.

Benefits
In-home respite (4-6 hours/day) Adult day care (~$60/day) Short-term facility care (up to 5 days)

Program of All-Inclusive Care for the Elderly (PACE)

North Carolina PACE (e.g., PACE of the Triad)

Age 55+
General NC resident (specific counties), NFLOC, safe with PACE support.
Income Limits (2025) ~$2,829/month (Medicaid-eligible); private pay option available.
Asset Limits $2,000 (individual), $3,000 (couple) for Medicaid enrollees.
NC

Available in 10+ counties (e.g., Guilford, Wake); multiple providers (e.g., PACE of the Southern Piedmont).

Benefits
Personal care (5-7 hours/day) Medical care Meals Transportation Respite Therapies

In-Home Aide Services

North Carolina In-Home Aide Services

Age 60+
General NC resident, unable to perform 1+ ADL, at risk of nursing home placement.
Income Limits (2025) No strict cap; prioritizes low-income ~$24,980/year
Asset Limits Not assessed; need-based.
NC

Family can be aides; varies by county funding.

Benefits
Personal care (5-20 hours/week) Meal prep Respite (~5 days/year) Errands

Medicare Savings Program (MSP)

North Carolina Medicare Savings Program

Age 65+ or disabled
General NC resident, Medicare Part A/B.
Income Limits (2025) ~$2,510/month (QMB), ~$3,380/month (SLMB), ~$3,598/month (QI)—individual.
Asset Limits $9,430 (individual), $14,130 (couple).
NC

Three tiers; no waitlist; includes Extra Help for Part D.

Benefits
Covers Part B premiums ($174.70/month) Deductibles ($240/year) Copays (~20%)

VA Aid and Attendance (A&A) and Housebound Benefits

North Carolina VA Aid and Attendance/Housebound

Age 65+ or disabled veteran/spouse
General NC resident, wartime service, need for ADL help (A&A) or homebound.
Income Limits (2025) Net income < ~$1,984/month (veteran with dependent, A&A); pension offsets income.
Asset Limits ~$155,356 net worth limit
NC

High veteran demand in rural/urban areas.

Benefits
Cash (~$1,433-$2,642/month veteran, ~$951-$1,318 spouse) for care costs (e.g., in-home, assisted living)

Urgent Repair Program (URP)

North Carolina Urgent Repair Program

Age 60+ prioritized
General NC resident, homeowner, low-income.
Income Limits (2025) ~$30,258/year 50% AMI, varies by county
Asset Limits Not strictly assessed; home value considered.
NC

Forgivable at $2,000/year; statewide via local partners.

Benefits
Repairs (~$8,000-$12,000 avg.) for safety (e.g., roofs, heating, accessibility)

State/County Special Assistance (SA)

North Carolina Special Assistance

Age 65+ (or disabled)
General NC resident, in licensed adult care home, low-income.
Income Limits (2025) ~$1,255/month (individual, 100% FPL); varies by facility rate.
Asset Limits $2,000 individual
NC

Covers assisted living; counties supplement state funds.

Benefits
Cash (~$1,200-$1,500/month) for room/board; Medicaid covers care services

Frequently Asked Questions about Trinity Elms Health and Rehab

What neighborhood is Trinity Elms Health and Rehab in?

Trinity Elms Health and Rehab is in the Fair Oaks Drive neighborhood.

Is Trinity Elms Health and Rehab in a walkable area?

Trinity Elms Health and Rehab has a walk score of 26. Somewhat walkable. A few nearby services may be reachable on foot, but most trips require transportation.

What is the occupancy rate at Trinity Elms Health and Rehab?

Trinity Elms Health and Rehab's occupancy is 81.7%.

Are there photos of Trinity Elms Health and Rehab?

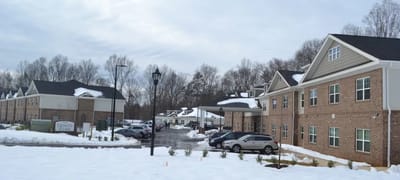
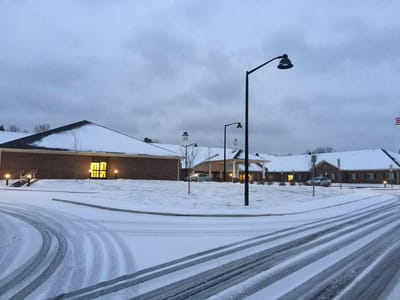
Yes — there are 3 photos of Trinity Elms Health and Rehab in the photo gallery on this page.

What is the phone number of Trinity Elms Health and Rehab?

(336) 747-1153 will put you in contact with the team at Trinity Elms Health and Rehab.

Is Trinity Elms Health and Rehab Medicare or Medicaid certified?

Yes — Trinity Elms Health and Rehab is a CMS-certified provider of Medicare and Medicaid.

Guides for Better Senior Living

Care Cost Calculator: See Prices in Your Area

Nursing Home Data Explorer

Don’t Wait Too Long: 7 Red Flag Signs Your Parent Needs Assisted Living Now

The True Cost of Assisted Living in 2025 – And How Families Are Paying For It

Understanding Senior Living Costs: Pricing Models, Discounts & Financial Assistance