


Total health inspections
8
California average 12.5
Last Health inspection on May 2025

We arrange tours, appointments, and even moving support so you don’t have to
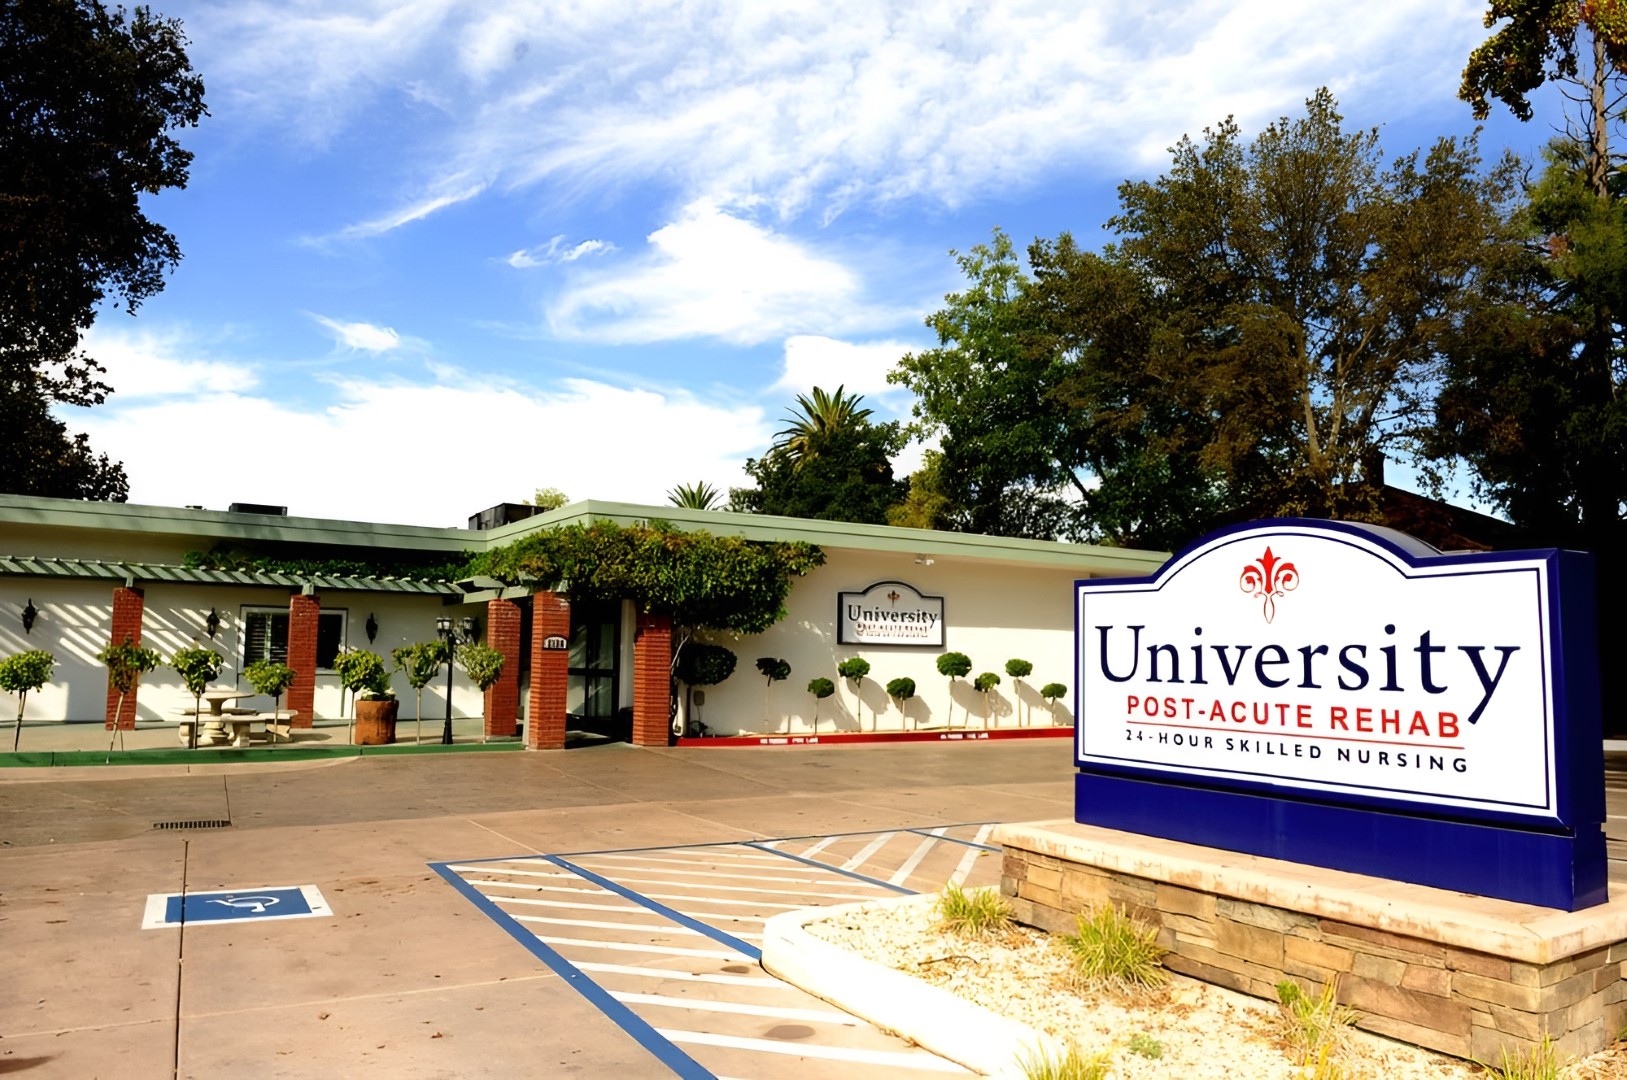

Receive the utmost care for your needs from University Post-Acute, a distinguished community located near UC Davis Medical Center in Sacramento, CA, providing memory care, skilled nursing, and rehabilitation. With exceptional care tailored to residents’ special needs, residents enjoy comfort and convenience like no other. The community is 5-star Medicare certified, striving to accommodate up to 59 residents with its cozy and nurturing environment.
Promoting an active and well-engaged lifestyle, enriching activities, and engaging programs are conducted for residents’ leisure and wellness. The community also provides social services to ensure residents enjoy a worry-free discharge and jump back into their lives. Residents maintain their dignity and live up to their potential with the community’s top-notch services and state-of-the-art amenities.
 Official CMS rating based on health inspections, staffing and quality measures.
Official CMS rating based on deficiencies found during state health inspections.
Official CMS rating based on nurse staffing hours per resident per day.
Official CMS rating based on clinical outcomes for residents.
Average daily nursing hours per resident (adjusted for acuity). Higher values indicate more nursing time per resident.
Hours of care per resident per day, broken down by staff type. Data from CMS Medicare.
Registered nurse hours per resident per day.
Licensed Practical Nurse / Licensed Vocational Nurse hours per resident per day.
Nurse aide hours per resident per day.
Total number of nurse staff hours per resident per day on weekends.
Physical therapist staff hours per resident per day.
Registered nurse hours per resident per day on weekends.
Official CMS rating based on health inspections, staffing and quality measures.
Official CMS rating based on deficiencies found during state health inspections.
Official CMS rating based on nurse staffing hours per resident per day.
Official CMS rating based on clinical outcomes for residents.
Average daily nursing hours per resident (adjusted for acuity). Higher values indicate more nursing time per resident.
Hours of care per resident per day, broken down by staff type. Data from CMS Medicare.
Registered nurse hours per resident per day.
Licensed Practical Nurse / Licensed Vocational Nurse hours per resident per day.
Nurse aide hours per resident per day.
Total number of nurse staff hours per resident per day on weekends.
Physical therapist staff hours per resident per day.
Registered nurse hours per resident per day on weekends.
May offer a more intimate, personalized care environment.
Occupancy is moderate, suggesting balanced demand.
Most residents typically stay for a few weeks or months before returning home or moving on.
62% of new residents, usually for short-term rehab.
31% of new residents, often for short stays.
7% of new residents, often for long-term daily care.
The portion of the home's budget spent on staff, including nurses, caregivers, and other employees who support care and operations.
All remaining costs needed to run the home, such as food, utilities, building maintenance, supplies and administrative expenses.
Accept Medicaid: Yes
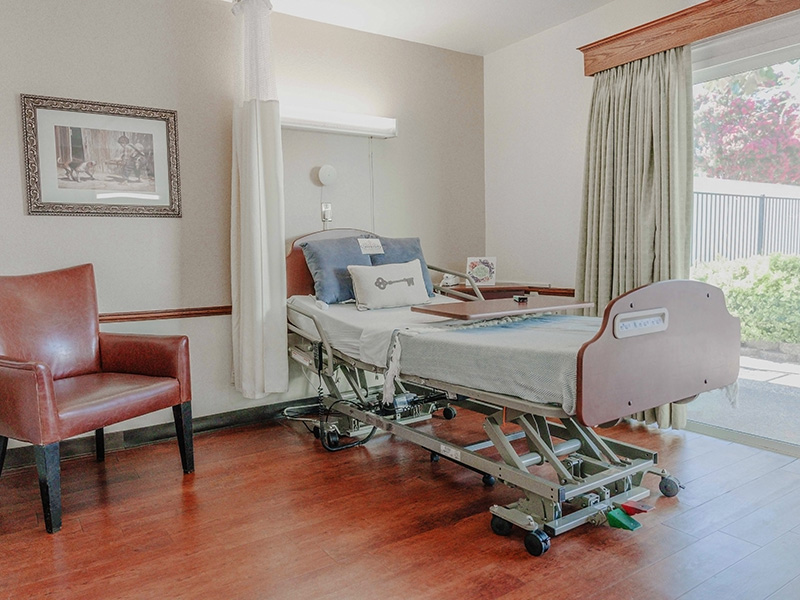
Total Residents: 52 Residents
Housing Options: Private / Semi-private Rooms
Building Type: Single-story
Dining Services
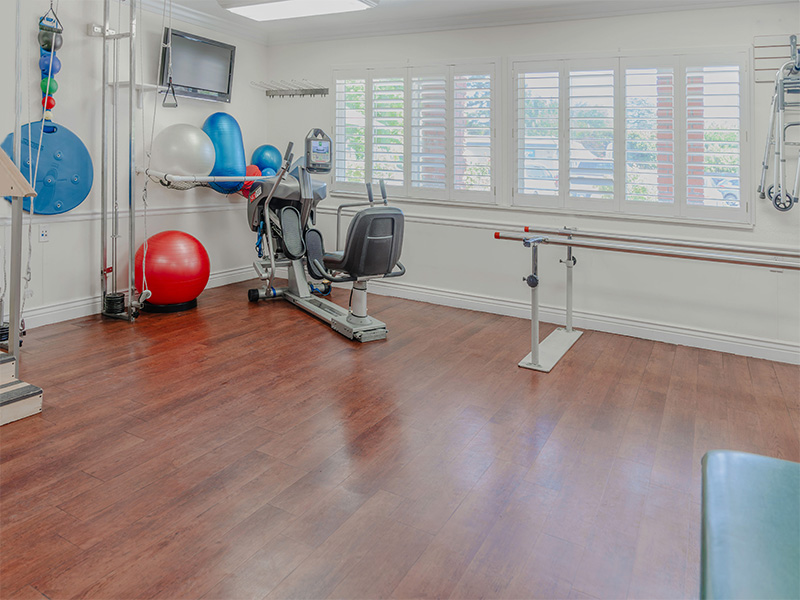
Exercise Programs

Health Programs
Memory Care Specialized care for those with Memory Loss, Alzheimer's, or dementia, ensuring safety and support.
Nursing Homes 24/7 care needed
Nursing Homes 24/7 care needed
Nursing Homes 24/7 care needed
Nursing Homes 24/7 care needed
 University Post-Acute Rehab
  Sherwood Healthcare Center
  Saylor Lane Health Care Center
![]() 2.8 miles from city center
2.8 miles from city center
![]() 2120 Stockton Blvd, Sacramento, CA 95817
2120 Stockton Blvd, Sacramento, CA 95817
Add your location
Source: CMS Payroll-Based Journal (Q2 2025)
| Role ⓘ | Count ⓘ | Avg Shift (hrs) ⓘ | Uses Contractors? ⓘ |
|---|---|---|---|
| Registered Nurse | 17 | 7.6 | No |
| Licensed Practical Nurse | 10 | 7.7 | No |
| Certified Nursing Assistant | 53 | 7.7 | No |
| Role ⓘ | Employees ⓘ | Contractors ⓘ | Total Staff ⓘ | Total Hours ⓘ | Days Worked ⓘ | % of Days ⓘ | Avg Shift (hrs) ⓘ |
|---|---|---|---|---|---|---|---|
| Certified Nursing Assistant | 53 | 0 | 53 | 12,692 | 91 | 100% | 7.7 |
| Registered Nurse | 17 | 0 | 17 | 4,774 | 91 | 100% | 7.6 |
| Licensed Practical Nurse | 10 | 0 | 10 | 2,949 | 91 | 100% | 7.7 |
| Respiratory Therapy Technician | 4 | 0 | 4 | 1,072 | 75 | 82% | 6.8 |
| Physical Therapy Assistant | 3 | 0 | 3 | 1,014 | 65 | 71% | 7.7 |
| Physical Therapy Aide | 4 | 0 | 4 | 1,014 | 74 | 81% | 7.2 |
| Clinical Nurse Specialist | 3 | 0 | 3 | 962 | 64 | 70% | 7.8 |
| RN Director of Nursing | 3 | 0 | 3 | 659 | 72 | 79% | 7.8 |
| Speech Language Pathologist | 2 | 0 | 2 | 528 | 52 | 57% | 6.9 |
| Administrator | 1 | 0 | 1 | 512 | 64 | 70% | 8 |
| Nurse Practitioner | 1 | 0 | 1 | 512 | 64 | 70% | 8 |
| Dietitian | 1 | 0 | 1 | 512 | 64 | 70% | 8 |
| Mental Health Service Worker | 1 | 0 | 1 | 512 | 64 | 70% | 8 |
| Other Dietary Services Staff | 2 | 0 | 2 | 452 | 54 | 59% | 7.9 |
| Dental Services Staff | 1 | 0 | 1 | 434 | 56 | 62% | 7.8 |
| Qualified Social Worker | 1 | 0 | 1 | 203 | 37 | 41% | 5.5 |
California average 12.5
Last Health inspection on May 2025
Health citations are formal notices following inspections when they fail to comply with safety and care standards.
22 of 27 citations resulted from standard inspections; and 5 of 27 resulted from complaint investigations.
California average: 0.4
California average: 1
Data sourced from CMS Health Deficiencies reports. Citation severity codes range from A (least serious) to L (most serious). Immediate Jeopardy (J-L) citations indicate situations where the facility's noncompliance has placed residents at risk of death or serious harm.
Source: CMS Long-Term Care Facility Characteristics (Data as of Jan 2026)
Active councils help families stay involved in care decisions and facility operations.
These measures show how residents usually do over time at this home, based on health outcomes and preventive care.
California average: 6.6
California average: 11.3
California average: 11.1%
California average: 12.0%
California average: 11.3%
California average: 1.7%
California average: 5.0%
California average: 1.2%
California average: 4.2%
California average: 6.7%
California average: 10.1%
California average: 98.5%
California average: 98.2%
California average: 2.25
California average: 1.59
California average: 94.0%
California average: 1.5%
California average: 93.2%
California average: 23.2%
California average: 11.2%
California average: 0.8%
California average: 53.7%
California average: 50.6%
Quality measures are calculated from Minimum Data Set (MDS) assessments. For most measures, lower percentages indicate better care quality.
Federal penalties imposed by CMS for regulatory violations, including civil money penalties (fines) and denials of payment for new Medicare/Medicaid admissions.
Source: CMS Penalties Database (Data as of Jan 2026)
California average: $55K
California average: 2.4
California average: 0.5
Penalties are imposed by CMS for violations of federal nursing home regulations.
Last updated: Jan 2026
Historical financial and operational data for University Post-Acute Rehab based on CMS SNF Cost Reports.
Loading trend charts...
Care Cost Calculator: See Prices in Your Area
Nursing Home Data Explorer
Don’t Wait Too Long: 7 Red Flag Signs Your Parent Needs Assisted Living Now
The True Cost of Assisted Living in 2025 – And How Families Are Paying For It
Understanding Senior Living Costs: Pricing Models, Discounts & Financial Assistance

We help families find affordable senior communities and unlock same day discounts, Medicaid, and Medicare options tailored to your needs.
Contact us Today
Touring a community? Use this expert-backed checklist to stay organized, ask the right questions, and find the perfect fit.
We'll send you a PDF version of the touring checklist.


