Explore Open Rooms

1 Contact details
2 What type of senior care service are you looking for?
3 What budget do you have in mind for senior care?
4 How soon do you need to find care?
5 Additional details

Thank you for your interest!

Our team will be in touch shortly to help with next steps.

Nursing Home in Modesto

CMS overall rating Info The Overall CMS Rating combines results from health inspections, staffing levels and quality measures. Health inspections carry the most weight. Staffing and quality scores can increase or decrease the final rating based on performance compared to state and national standards.

Valley Skilled Nursing

515 E Orangeburg Ave, Modesto, CA 95350 View map
Overview of Valley Skilled Nursing

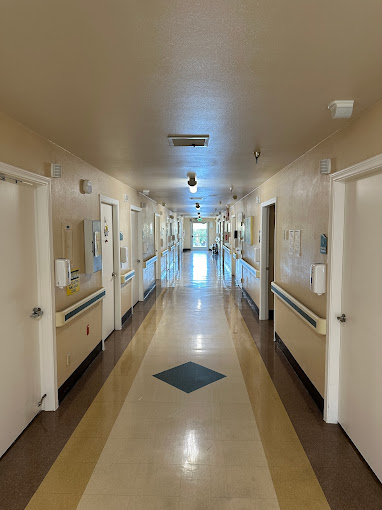
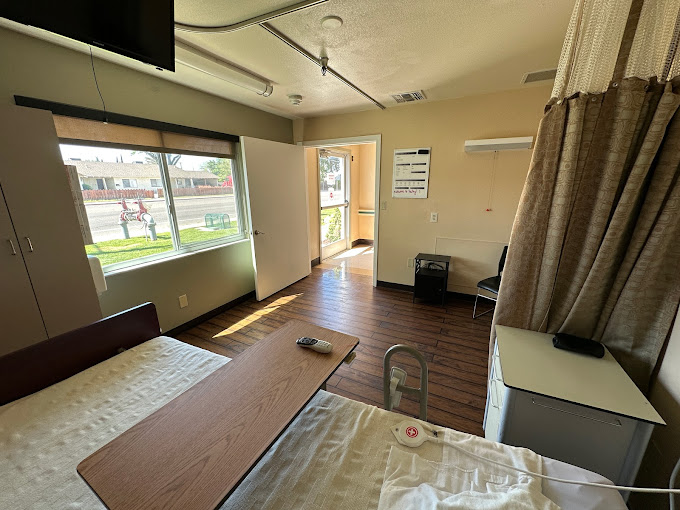
Valley Skilled Nursing, located in Modesto CA, is a skilled nursing and rehabilitation facility providing a variety of medical services to its residents and patients. Their skilled nursing program ensures that their long-term residents and patients receive 24/7 nursing care and supervision, incontinence care, memory care, and medication management, along with regular assistance with daily living activities.
Valley Skilled Nursing also provides diabetic care for residents living with diabete, here they receive regular blood glucose monitoring, menu planning, as well as insulin administration and tracking. The residents care program also includes a dietary program to ensure that they receive the proper nutrition they need as well as supplements. For residents in their final stages of life, hospice care is also available.

(209) 529-0516

Quality ratings

Measured by Centers for Medicare & Medicaid Services (CMS)

Overall rating Info The Overall CMS Rating combines results from health inspections, staffing levels and quality measures. Health inspections carry the most weight. Staffing and quality scores can increase or decrease the final rating based on performance compared to state and national standards.
3/5
California average: 3.6/5
Health Inspection Info Based on the results of the facility's three most recent standard inspections and any complaint investigations. CMS reviews the number, scope, and severity of deficiencies, with more recent findings weighted more heavily.
3/5
California average: 3.2/5
Staffing Info Measures average nursing staff hours per resident per day, including Registered Nurses (RNs) and total nursing staff. Ratings are adjusted based on the level of care residents require and are compared to state and national benchmarks.
2/5
California average: 3.5/5
Quality Measures Info Based on clinical and physical health indicators reported to CMS, such as hospital readmissions, falls, pressure ulcers, and improvements in mobility. These measures reflect how well residents' health needs are being managed.
4/5
California average: 4.3/5

Nursing care per resident

Info This shows how many total hours of nursing staff time are available per resident each day. Higher numbers usually mean more staff support.
3h 23m per day

This home provides 23% less nursing time per resident than the California average.

California average: 4h 23m per day

Staffing hours breakdown

Info Hours of care per resident per day, broken down by staff type. Data from CMS Medicare.
Staff type Facility State avg National avg
Registered Nurse (RN) Info Registered nurse hours per resident per day. 19m per day 39m per day 41m per day
Nurse Aide Info Nurse aide hours per resident per day. 2h 35m per day 2h 39m per day 2h 21m per day
Total Nursing (Weekend) Info Total number of nurse staff hours per resident per day on weekends. 3h 40m per day 4h 5m per day 3h 26m per day
Physical Therapist Info Physical therapist staff hours per resident per day. 15m per day 5m per day 4m per day
RN (Weekend) Info Registered nurse hours per resident per day on weekends. 16m per day 30m per day 29m per day

Capacity and availability

Smaller home

May offer a more intimate, personalized care environment.

Total beds 70

This home usually has availability

Lower occupancy suggests more openings may be available.

Lower demand than the California average
Occupancy rate 62.2%
Residents per day (avg) 52
Occupancy rate
62.2%
Residents per day (avg)
52

Who this home usually serves

TYPE OF STAY

Mostly short-term rehab stays

Most residents typically stay for a few weeks or months before returning home or moving on.

Might be optimal for
Short stays Recovery Medicare-covered care

Breakdown by payment type

Medicare

88% of new residents, usually for short-term rehab.

Typical stay 1 - 2 months

Private pay

11% of new residents, often for short stays.

Typical stay 1 - 2 months

Finances and operations

Privately-owned community
Home revenue
$12.4M
Profit
$123.7K
Privately-owned community
Home revenue
$12,404,504.00
Profit
$123,717.00
Payroll costs Info The portion of the home's budget spent on staff, including nurses, caregivers, and other employees who support care and operations.
$4.9M
39.8% of revenue
Other operating costs Info All remaining costs needed to run the home, such as food, utilities, building maintenance, supplies and administrative expenses.
$7.3M
Total costs $12.3M
Walk Score
Walk Score: 65 / 100
Moderately walkable. Some errands can be accomplished on foot, with a mix of nearby amenities.
BBB Rating
BBB Rating: A+ (Not Accredited)
An independent rating from the Better Business Bureau based on factors such as complaint history, transparency, and business practices.
How BBB ratings work

Additional Licensing Details

CMS Certification Number55869

Types of Care at Valley Skilled Nursing

Nursing Home
Contact Valley Skilled Nursing

Inspection History

In California, the Department of Social Services (for assisted living facilities) and the Department of Public Health (for nursing homes) conduct inspections to ensure resident safety and regulatory compliance.

Health Inspection History

Inspections
Total health inspections 11

California average 12.5


Last Health inspection on Jun 2025

Total health citations 46

California average 50.2

Citations per inspection
4.18

California average 4.65


Health citations are formal notices following inspections when they fail to comply with safety and care standards.

34 of 46 citations resulted from standard inspections; and 12 of 46 resulted from complaint investigations.

Breakdown of citation severity (last 3 years)
Critical Health citations More info 0
100% better than California average

California average: 0.4


Serious Health citations More info 0
100% better than California average

California average: 1

0 critical citations More info California average: 0.4

0 serious citations More info California average: 1

44 moderate citations More info California average: 47.2

2 minor citations More info California average: 1.5
Citations history (last 3 years)
Resident Rights moderate citation Info Issues related to resident's rights, including dignity, privacy, and the ability to make decisions about their care. Jun 13, 2025
Corrected

Care Planning moderate citation Info Issues related to creating and updating personalized care plans for residents based on their needs and conditions. May 06, 2025
Corrected

Pharmacy moderate citation Info Issues related to medication management, including how drugs are stored, administered, and monitored. Apr 09, 2025
Corrected

Care Planning moderate citation Info Issues related to creating and updating personalized care plans for residents based on their needs and conditions. Apr 09, 2025
Corrected

Compare Nursing Homes around Modesto The information below is reported by the California Department of Social Services and Department of Public Health.

5 facilities compared · CMS & CA Dept. of Health data · Updated Apr 2026

Filter by care type
English Oaks Convalescent & Rehabilitation Hospital
MC

Memory Care Secured, specialized care for people living with Alzheimer's or dementia. Staff trained in cognitive impairment, with higher staff-to-resident ratios and an environment designed to reduce confusion and wandering risk.

NH

Nursing Home Licensed facility providing 24/7 skilled nursing care for residents with complex, ongoing medical needs. Staffed by RNs, LPNs, and CNAs. Inspected and star-rated annually by CMS. Accepts Medicare (short-term rehab) and Medicaid (long-term care).

Modesto
180
80.2%
-5%
4.27
-45%
+1%
0
56
4.7
1
162
-
69
Hill, Deanna
$27.3M
$12.4M
45.3%
555190
Valley Skilled Nursing
NH

Nursing Home Licensed facility providing 24/7 skilled nursing care for residents with complex, ongoing medical needs. Staffed by RNs, LPNs, and CNAs. Inspected and star-rated annually by CMS. Accepts Medicare (short-term rehab) and Medicaid (long-term care).

Modesto
70
62.2%
-27%
3.38
-6%
-20%
0
46
4.2
0
52
A+
65
-
$12.3M
$4.9M
40.1%
55869
Golden Modesto
NH

Nursing Home Licensed facility providing 24/7 skilled nursing care for residents with complex, ongoing medical needs. Staffed by RNs, LPNs, and CNAs. Inspected and star-rated annually by CMS. Accepts Medicare (short-term rehab) and Medicaid (long-term care).

Modesto
120
77.7%
-8%
4.42
-33%
+5%
14
77
3.1
10
107
-
74
-
$11.4M
$4.5M
39.5%
56301
Almond Vista Healthcare
NH

Nursing Home Licensed facility providing 24/7 skilled nursing care for residents with complex, ongoing medical needs. Staffed by RNs, LPNs, and CNAs. Inspected and star-rated annually by CMS. Accepts Medicare (short-term rehab) and Medicaid (long-term care).

Modesto
175
88.1%
+4%
4.01
-45%
-5%
6
63
6.3
7
165
-
76
-
$29.7M
$12.0M
40.6%
555118
Garden City Healthcare Center
NH

Nursing Home Licensed facility providing 24/7 skilled nursing care for residents with complex, ongoing medical needs. Staffed by RNs, LPNs, and CNAs. Inspected and star-rated annually by CMS. Accepts Medicare (short-term rehab) and Medicaid (long-term care).

Modesto
104
92.9%
+10%
3.89
-9%
-8%
2
60
5.0
2
95
A+
63
Moradkhani, Lawrence
$24.3M
$7.9M
32.7%
55185

Places of interest near Valley Skilled Nursing

Address 2.3 miles from city center — 0.49 miles to nearest hospital (Aegis Treatment Centers | Modesto)
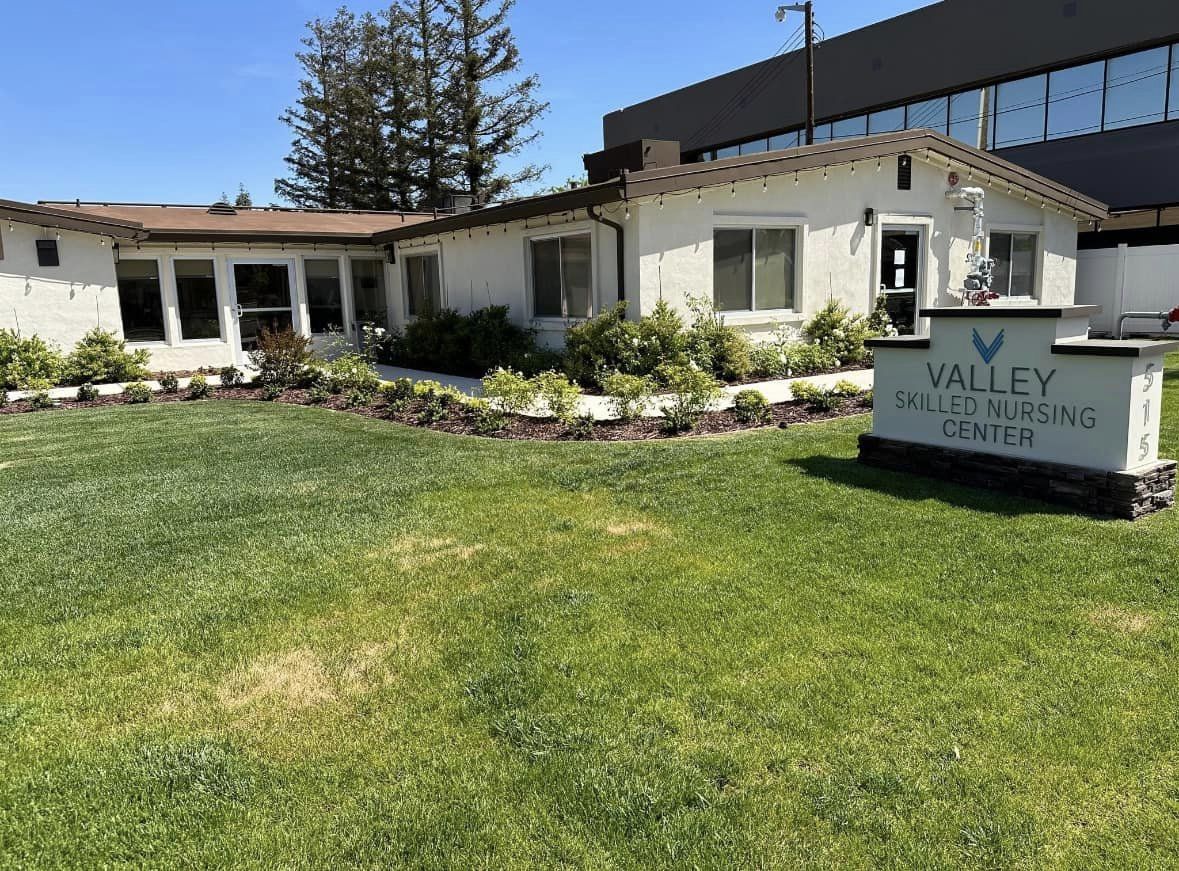
Address 515 E Orangeburg Ave, Modesto, CA 95350

Calculate Travel Distance to Valley Skilled Nursing

Add your location

Address

Staffing Data (Q2 2025)

This data corresponds to Q2 2025 and is based on CMS Payroll-Based Journal.

Total staff 87
Employees 85
Contractors 2
Staff to resident ratio 1.67:1
1672977% better than California average

California average ratio: 0.00:1

Avg staff/day 34
Average shift 8.6 hours
12% better than California average

California average: 7.7 hours

Total staff hours (quarter) 26,659
Nursing staff breakdown
Registered Nurse

Manages medical care and health needs.

Total count 7
Average shift length Info Average shift length. Calculated as total hours divided by days worked and average staff per day. 7.6 hours

No contractors work on this role.

Licensed Practical Nurse

Assists with medical care and medications.

Total count 13
Average shift length Info Average shift length. Calculated as total hours divided by days worked and average staff per day. 9.8 hours

No contractors work on this role.

Certified Nursing Assistant

Helps with daily care and mobility.

Total count 31
Average shift length Info Average shift length. Calculated as total hours divided by days worked and average staff per day. 10.2 hours

No contractors work on this role.

Contractor staffing

Total hours from contractors

0.6%

167 contractor hours this quarter

Medical Director: 1 Occupational Therapy Assistant: 1
Staff by category
Certified Nursing Assistant3103112,55991100%10.2
Licensed Practical Nurse130133,98891100%9.8
RN Director of Nursing4041,9446774%8
Registered Nurse7071,5639099%7.6
Respiratory Therapy Technician5051,1166774%7.2
Physical Therapy Aide6061,0128593%5.4
Other Dietary Services Staff2027978998%8.1
Occupational Therapy Aide2027816571%7
Speech Language Pathologist4046027279%6
Administrator1015206571%8
Physical Therapy Assistant6064756470%5.7
Dietitian1014355560%7.9
Nurse Practitioner1013364246%8
Mental Health Service Worker1013304246%7.9
Occupational Therapy Assistant0111071213%8.9
Medical Director011602629%2.3
Qualified Social Worker101342527%1.4
31 Certified Nursing Assistant
% of Days 100%
13 Licensed Practical Nurse
% of Days 100%
4 RN Director of Nursing
% of Days 74%
7 Registered Nurse
% of Days 99%
5 Respiratory Therapy Technician
% of Days 74%
6 Physical Therapy Aide
% of Days 93%
2 Other Dietary Services Staff
% of Days 98%
2 Occupational Therapy Aide
% of Days 71%
4 Speech Language Pathologist
% of Days 79%
1 Administrator
% of Days 71%
6 Physical Therapy Assistant
% of Days 70%
1 Dietitian
% of Days 60%
1 Nurse Practitioner
% of Days 46%
1 Mental Health Service Worker
% of Days 46%
1 Occupational Therapy Assistant
% of Days 13%
1 Medical Director
% of Days 29%
1 Qualified Social Worker
% of Days 27%

Facility Characteristics

Source: CMS Long-Term Care Facility Characteristics (Data as of Jan 2026)

Total census
52 residents
Residents by payment source
Medicare
25 residents (48.1%)
Medicaid
18 residents (34.6%)
Private pay or other
9 residents (17.3%)
Programs & Services
Residents' Group

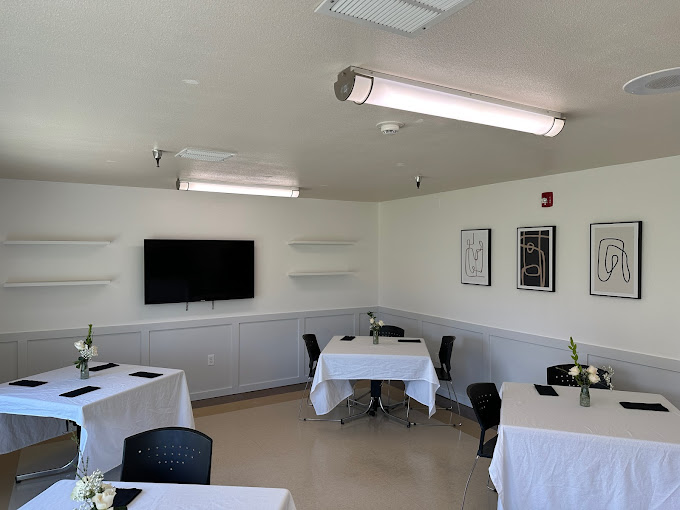
Residents meet regularly to discuss policies, care quality, and activities

Active Resident Council

Organized group of residents that meets regularly to discuss facility policies, quality of life, and activities.

Quality of care over time

These measures show how residents usually do over time at this home, based on health outcomes and preventive care.

High-risk clinical events score Info A composite score based on pressure ulcers, falls with injury, weight loss, walking ability decline, and activities of daily living decline. 4.9
27% better than California average

California average: 6.6

Functional decline score Info A composite score based on activities of daily living decline, walking ability decline, and incontinence. 7.8
31% better than California average

California average: 11.3

Long-stay resident measures
Above average California avg: 4.3 Info CMS star rating based on long-stay quality measure performance. 5 stars = significantly above average, 1 star = significantly below average.
Need for Help with Daily Activities Increased Info Percent of long-stay residents whose need for help with daily activities has increased 7.1%
35% better than California average

California average: 11.1%

Walking Ability Worsened Info Percent of long-stay residents whose ability to move independently worsened 8.7%
28% better than California average

California average: 12.0%

Low Risk Residents with Bowel/Bladder Incontinence Info Percent of low risk long-stay residents who lose control of their bowels or bladder 7.7%
32% better than California average

California average: 11.3%

Falls with Major Injury Info Percent of long-stay residents experiencing one or more falls with major injury 1.2%
30% better than California average

California average: 1.7%

High Risk Residents with Pressure Ulcers Info Percent of long-stay high risk residents with pressure ulcers 5.9%
19% worse than California average

California average: 5.0%

Urinary Tract Infection Info Percent of long-stay residents with a urinary tract infection 0.0%
100% better than California average

California average: 1.2%

Lost Too Much Weight Info Percent of long-stay residents who lose too much weight 1.4%
67% better than California average

California average: 4.2%

Depressive Symptoms Info Percent of long-stay residents who have depressive symptoms 32.1%
379% worse than California average

California average: 6.7%

Antipsychotic Use Info Percent of long-stay residents who received an antipsychotic medication 1.4%
87% better than California average

California average: 10.1%

Pneumococcal Vaccine Info Percent of long-stay residents assessed and appropriately given the pneumococcal vaccine 100.0%
In line with California average

California average: 98.5%

Influenza Vaccine Info Percent of long-stay residents assessed and appropriately given the seasonal influenza vaccine 100.0%
In line with California average

California average: 98.2%

Hospitalizations per 1,000 days Info Number of hospitalizations per 1,000 long-stay resident days. 2.01
11% better than California average

California average: 2.25

ED visits per 1,000 days Info Number of outpatient emergency department visits per 1,000 long-stay resident days. 2.64
66% worse than California average

California average: 1.59

Short-stay resident measures
Average California avg: 3.5 Info CMS star rating based on short-stay quality measure performance. 5 stars = much above average, 1 star = much below average.
Pneumococcal Vaccine Info Percent of short-stay residents assessed and appropriately given the pneumococcal vaccine 99.3%
6% better than California average

California average: 94.0%

Antipsychotic medication increase Info Percent of short-stay residents who newly received an antipsychotic medication 2.9%
101% worse than California average

California average: 1.5%

Influenza Vaccine Info Percent of short-stay residents assessed and appropriately given the seasonal influenza vaccine 99.4%
7% better than California average

California average: 93.2%

Re-hospitalized after SNF stay Info Percentage of short-stay residents who were re-hospitalized after their nursing home admission. 22.4%
In line with California average

California average: 23.2%

Emergency department visits Info Percentage of short-stay residents who had an outpatient emergency department visit. 14.8%
32% worse than California average

California average: 11.2%

Falls with major injury Info Percentage of SNF residents who experience falls with major injury during their stay. 0.0%
100% better than California average

California average: 0.8%

Ability to care for self at discharge Info Percentage of residents at or above expected ability to care for themselves at discharge. 84.4%
57% better than California average

California average: 53.7%

Successful return to home or community Info Rate of successful return to home or community from a skilled nursing facility. 45.4%
10% worse than California average

California average: 50.6%

Guides for Better Senior Living

Care Cost Calculator: See Prices in Your Area

Nursing Home Data Explorer

Don’t Wait Too Long: 7 Red Flag Signs Your Parent Needs Assisted Living Now

The True Cost of Assisted Living in 2025 – And How Families Are Paying For It

Understanding Senior Living Costs: Pricing Models, Discounts & Financial Assistance

Financial Aid for California Seniors

Get financial aid guidance

Multipurpose Senior Services Program

MSSP (Medi-Cal Waiver)

Age 65+, California resident, Medi-Cal eligible, nursing home risk.

~$2,829/month (300% FBR, individual).

$2,000 (individual), $3,000 (couple).

County-managed; waitlists possible.

In-Home Supportive Services (IHSS)

California IHSS

Age 65+, California resident, Medicaid-eligible or low-income.

~$1,732/month (individual, Medi-Cal threshold).

$2,000 (individual).

Can hire family as caregivers.

Multipurpose Senior Services Program (MSSP)

CA MSSP

Age 65+, California resident, Medi-Cal-eligible, nursing home-eligible but community-capable.

~$2,829/month (300% FBR, individual).

$2,000 (individual).

Available in 38 counties; waitlists common.

Property Tax Postponement Program (PTP)

CA PTP

Age 62+, California resident, own and live in home, 40% equity.

~$51,500/year (household, adjusted annually).

Equity-based; no strict asset cap.

Deferred taxes accrue interest (5% as of 2024); repaid upon sale/death.

Assisted Living Waiver (ALW)

CA ALW

Age 65+ or disabled, California resident, Medi-Cal-eligible, nursing home-eligible.

~$2,829/month (300% FBR, individual).

$2,000 (individual).

Available in 15 counties (e.g., LA, Sacramento); waitlists common.

California CARES Program

CA CARES

Caregivers of California residents 60+ needing help with 3+ daily activities; no caregiver age limit.

No strict limit; cost-sharing above ~$2,500/month threshold.

Not applicable; need-based.

High demand in urban areas; complements IHSS respite.

Low-Income Home Energy Assistance Program (LIHEAP)

CA LIHEAP

Age 60+ priority, California resident, low-income, utility/heating need.

~$2,510/month (200% of poverty level, individual).

Not applicable; income-focused.

High demand in inland/coastal extremes; weatherization capped at $5,000/home.

Tour Icon
Planning a tour? Check our touring checklist.
Chat Icon
Thinking of living here? We can help you speak to a current resident