Explore Open Rooms
1 Contact details
2 What type of senior care service are you looking for?
3 What budget do you have in mind for senior care?
4 How soon do you need to find care?
5 Additional details

Thank you for your interest!

Our team will be in touch shortly to help with next steps.

Nursing Home in Cameron County

CMS overall rating Info The Overall CMS Rating combines results from health inspections, staffing levels and quality measures. Health inspections carry the most weight. Staffing and quality scores can increase or decrease the final rating based on performance compared to state and national standards.

Veranda Rehabilitation and Healthcare

Overview of Veranda Rehabilitation and Healthcare

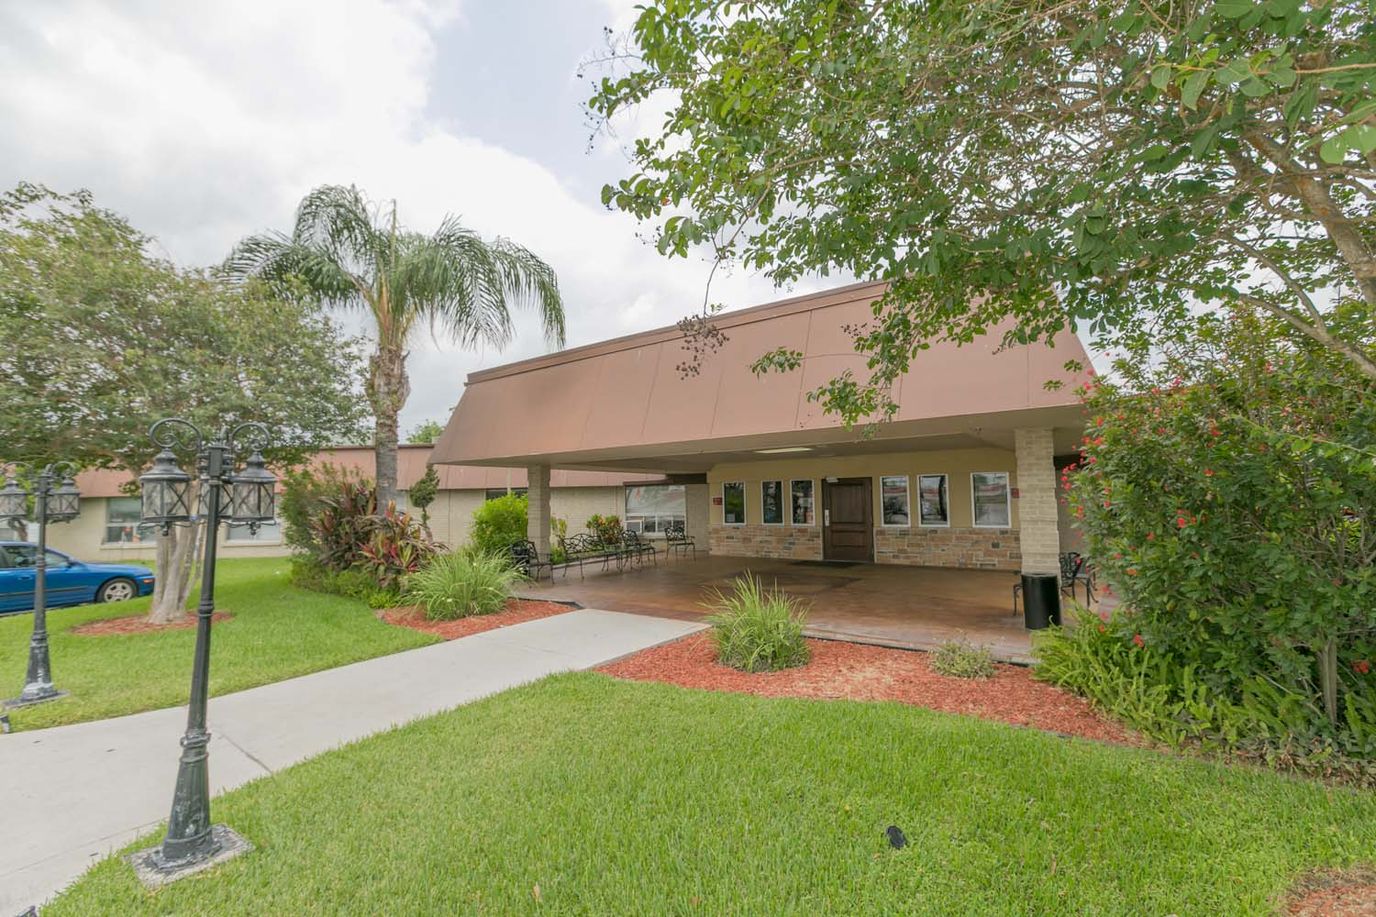
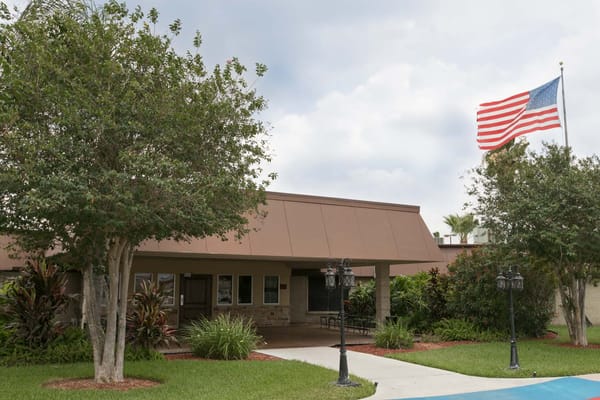
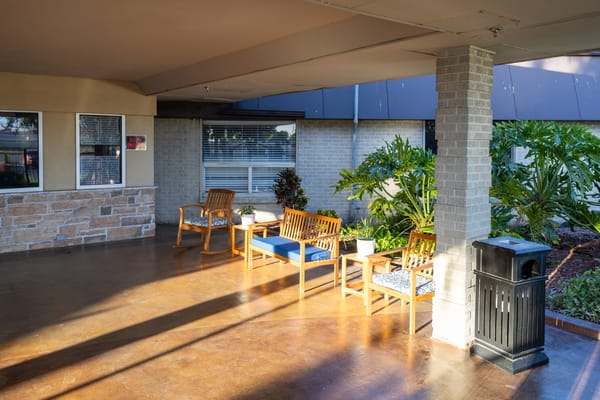
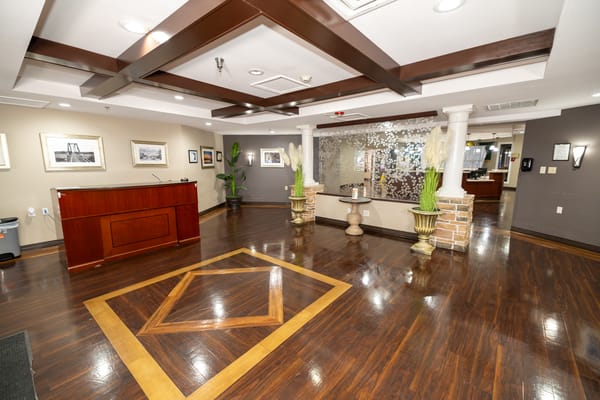
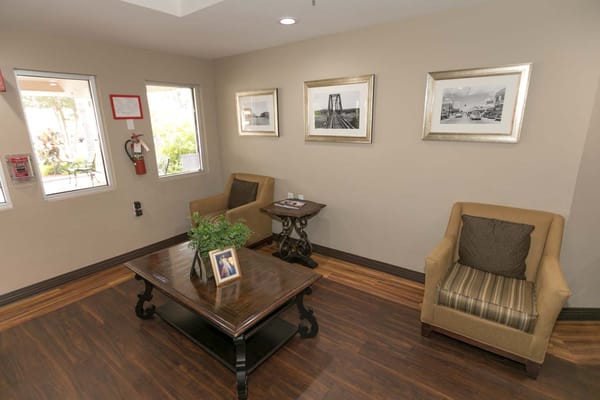
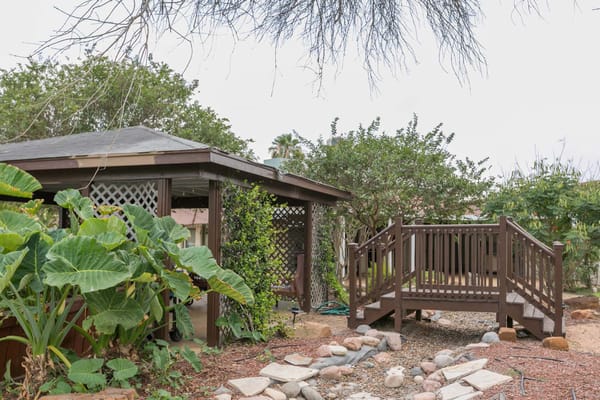
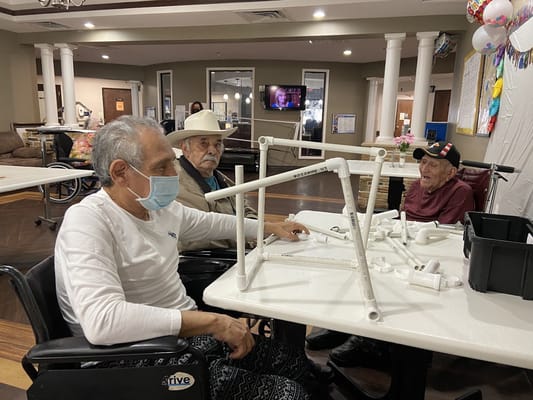
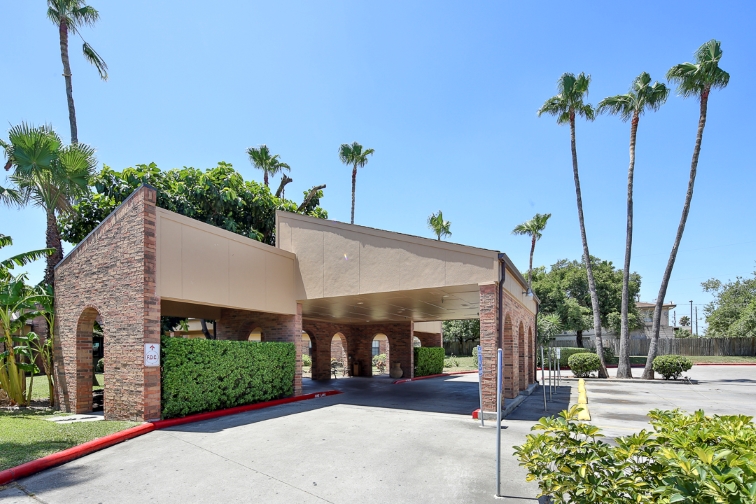
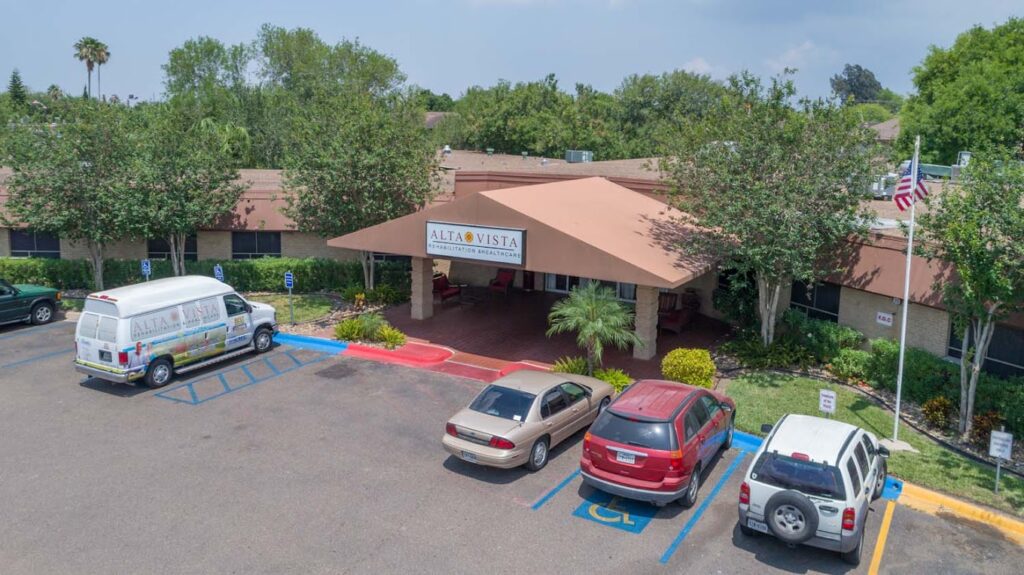
Located in the beautiful neighborhood of Harlingen, TX, Veranda Rehabilitation and Healthcare is an esteemed senior living community that offers memory care, skilled nursing, short-term rehabilitation care, and long-term care services. Having a well-trained and compassionate team, residents can receive the caliber of care and services catering to their immediate needs and concerns.

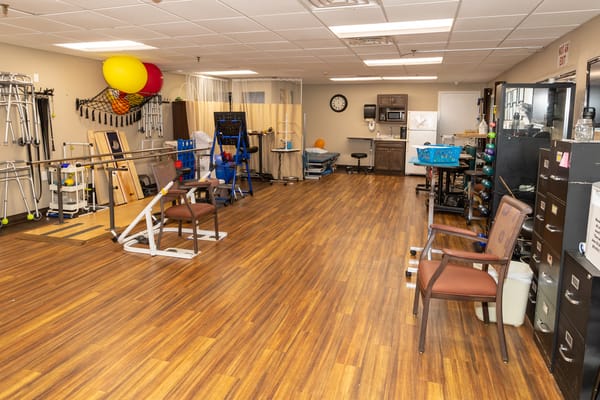
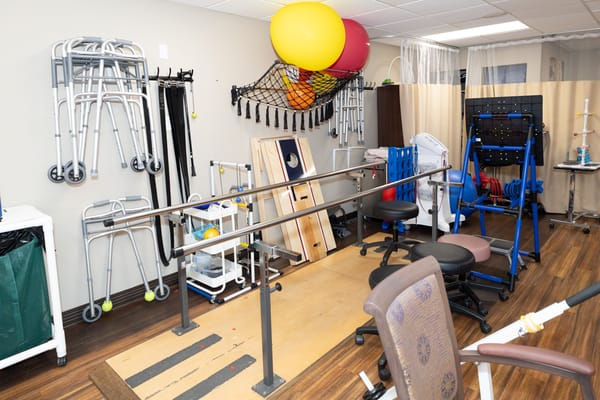
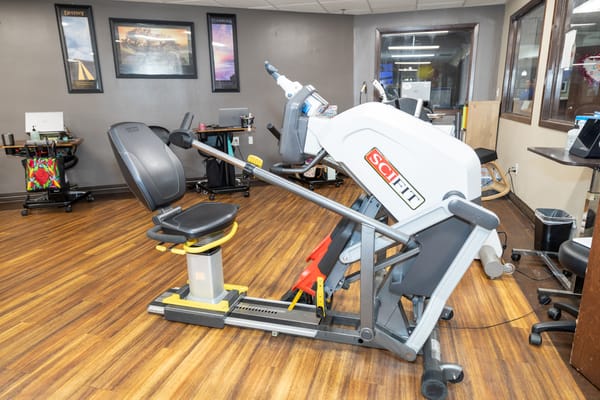
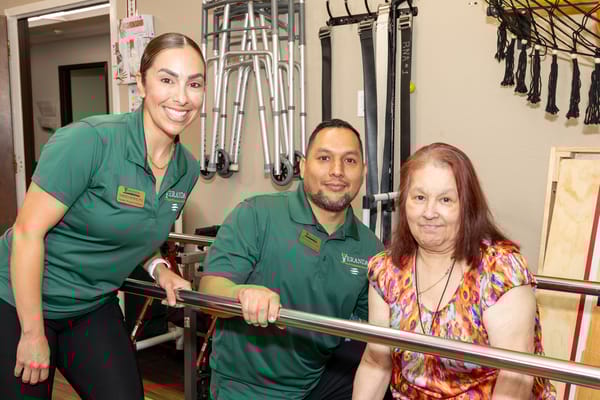
Explore its state-of-the-art services from its well-knowledgeable and experienced rehabilitation team composed of physical therapists, occupational therapists, speech therapists, language pathologists, and rehab aide/technicians. The community is dedicated to elevating its return to home goal with a person-centered and holistic approach. With this, residents are taken care of well by determining the best treatment action plan and letting them maximize their living arrangements. At Veranda Rehabilitation and Healthcare, seniors are assured of extraordinary care and support.

Quality ratings

Measured by Centers for Medicare & Medicaid Services (CMS)

Overall rating Info The Overall CMS Rating combines results from health inspections, staffing levels and quality measures. Health inspections carry the most weight. Staffing and quality scores can increase or decrease the final rating based on performance compared to state and national standards.
5/5
Texas average: 3.0/5
Health Inspection Info Based on the results of the facility's three most recent standard inspections and any complaint investigations. CMS reviews the number, scope, and severity of deficiencies, with more recent findings weighted more heavily.
4/5
Texas average: 2.9/5
Staffing Info Measures average nursing staff hours per resident per day, including Registered Nurses (RNs) and total nursing staff. Ratings are adjusted based on the level of care residents require and are compared to state and national benchmarks.
2/5
Texas average: 2.4/5
Quality Measures Info Based on clinical and physical health indicators reported to CMS, such as hospital readmissions, falls, pressure ulcers, and improvements in mobility. These measures reflect how well residents' health needs are being managed.
5/5
Texas average: 4.0/5

Nursing care per resident

Info This shows how many total hours of nursing staff time are available per resident each day. Higher numbers usually mean more staff support.
2h 58m per day

This home provides 22% less nursing time per resident than the Texas average.

Texas average: 3h 47m per day

Staffing hours breakdown

Info Hours of care per resident per day, broken down by staff type. Data from CMS Medicare.
Staff type Facility State avg National avg
Registered Nurse (RN) Info Registered nurse hours per resident per day. 32m per day 26m per day 41m per day
Nurse Aide Info Nurse aide hours per resident per day. 1h 58m per day 2h 1m per day 2h 21m per day
Total Nursing (Weekend) Info Total number of nurse staff hours per resident per day on weekends. 2h 29m per day 2h 59m per day 3h 26m per day
Physical Therapist Info Physical therapist staff hours per resident per day. 7m per day 4m per day 4m per day
RN (Weekend) Info Registered nurse hours per resident per day on weekends. 21m per day 21m per day 29m per day

Capacity and availability

Medium-capacity home

Offers a balance of services and community atmosphere.

Total beds 100

This home usually has availability

Lower occupancy suggests more openings may be available.

Lower demand than the Texas average
Occupancy rate 81.2%
Residents per day (avg) 87
Occupancy rate
81.2%
Residents per day (avg)
87

Who this home usually serves

TYPE OF STAY

Mix of rehab and long-term care

This home supports both short-term rehab and long-term care, with residents staying for a wide range of durations.

Breakdown by payment type

Medicare

28% of new residents, usually for short-term rehab.

Typical stay 1 - 2 months

Private pay

58% of new residents, often for short stays.

Typical stay 1 - 2 months

Medicaid

15% of new residents, often for long-term daily care.

Typical stay 1 - 2 years

Finances and operations

Governmental community
Operated by state authorities.
Home revenue
$13.9M
Surplus of revenue
$2.6M
Governmental community Operated by state authorities.
Home revenue
$13.9M
Surplus of revenue
$2.6M
Payroll costs Info The portion of the home's budget spent on staff, including nurses, caregivers, and other employees who support care and operations.
$5.0M
36.2% of revenue
Other operating costs Info All remaining costs needed to run the home, such as food, utilities, building maintenance, supplies and administrative expenses.
$6.2M
Total costs $11.2M
Bed community size
100-bed community
A larger shared setting that may offer more common spaces and organized community services.
Years in operation
54 years in operation
A longer operating history, which may indicate experience navigating regulations and delivering ongoing care.
Walk Score
Walk Score: 33 / 100
Somewhat walkable. A few nearby services may be reachable on foot, but most trips require transportation.

Services

Medicare/medicaid

About this community

License Details

Facility TypeNursing
StatusActive
IssuanceJanuary 4, 2025
ExpirationJanuary 4, 2028
CountyCAMERON

Additional Licensing Details

License Number307272
Year Opened9/1/1971

Ownership & Operating Entity

Veranda Rehabilitation and Healthcare is administrated by Randy O Elkins.

Management CompanyHARLINGEN HEALTHCARE, INC
OwnerFANNIN COUNTY HOSPITAL AUTHORITY
Ownership TypeHOSPITAL DISTRICT/AUTHORITY

Type Of Units

Medicaid and Medicare
100 units
Total beds
100 units

Staffing

Key information about the people who lead and staff this community.

Leadership

Administrator Email [email protected]

Payment & Insurance

2 services
Accept Medicaid
Accept Medicare

Therapy & Rehabilitation

1 service
Rehabilitation Services

Staffing & Medical

3 services
Doctor on Staff
Skilled Nursing
24-Hour Staffing

Amenities & Lifestyle

0 amenities
ActivitiesMonthly activity calendar packed with options designed to help residents stay active.
Specific ProgramsIn-House Therapy, Skilled Nursing, Stay Active, Videos & Photos
Religious ServicesYes

Dining & Nutrition

Food DescriptionNutritious satisfying menus are provided.

What does this home offer?

Accepts Medicaid icon

Accept Medicaid: Yes

Total residents icon

Total Residents: 100

Building type icon
Building type icon

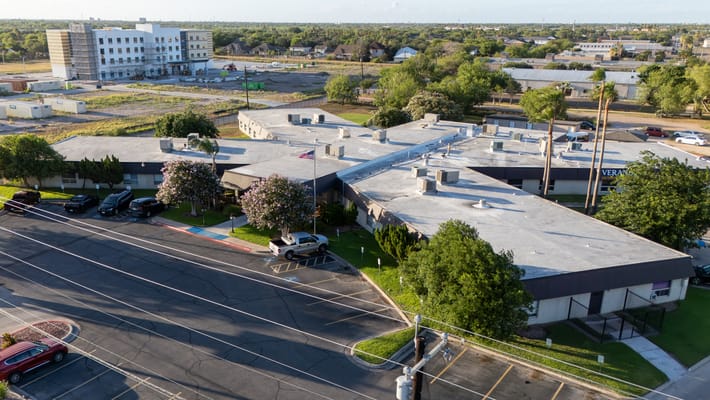
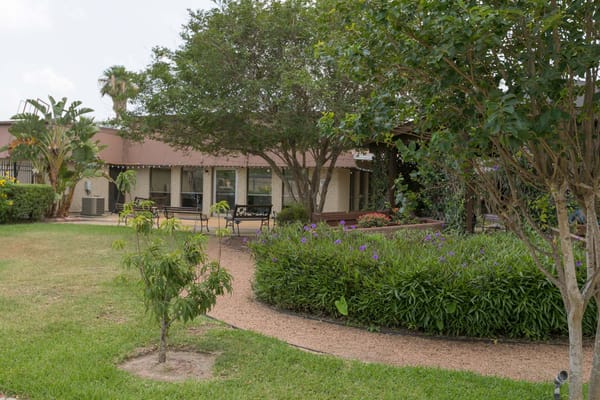
Building Type: Single-story

Types of Care at Veranda Rehabilitation and Healthcare

Nursing Home

Contact Veranda Rehabilitation and Healthcare

Access & Eligibility

Ways to qualify for care at this community, including accepted programs and payment options.

Medicaid Accepted

This facility is certified for eligible Medicaid services.

Medicare Accepted

This facility is certified for eligible Medicare services.

Payment & Funding Options

Medicaid Medicare

Inspection History

In Texas, the Health and Human Services Commission (HHSC) is the primary regulatory body that conducts unannounced inspections and publishes quality reports for all long-term care homes.

6 visits/inspections

6 visits/inspections triggered by complaints

3 routine inspections

Results

6 with issues

0 without issues

Latest inspection

Date November 5, 2025
Routine

18 deficiencies

Deficiencies indicate regulatory issues. A higher number implies the facility had several areas requiring improvement.

Texas average: 32 deficiencies

Health Inspection History

Inspections
Total health inspections 5

Texas average 7.4


Last Health inspection on Jun 2025

Total health citations 12

Texas average 25.9

Citations per inspection
2.4

Texas average 3.67


Health citations are formal notices following inspections when they fail to comply with safety and care standards.

4 of 12 citations resulted from standard inspections; 4 of 12 resulted from complaint investigations; and 4 of 12 came from combined inspections (standard and complaint).

Breakdown of citation severity (last 3 years)
Critical Health citations More info 1
50% better than Texas average

Texas average: 2


Serious Health citations More info 0
100% better than Texas average

Texas average: 0.4

1 critical citation More info Texas average: 2

0 serious citations More info Texas average: 0.4

11 moderate citations More info Texas average: 23

0 minor citations More info Texas average: 0.4
Citations history (last 3 years)
Abuse/Neglect moderate citation Info Issues related to protecting resident's from harm, including abuse, neglect, or mistreatment. Jun 25, 2025
Corrected

Environmental moderate citation Info Issues related to building safety, cleanliness, maintenance, and overall living conditions. Jun 25, 2025
Corrected

Infection Control moderate citation Info Issues related to preventing and controlling infections, including hygiene practices and safety protocols. Jun 25, 2025
Corrected

Care Planning moderate citation Info Issues related to creating and updating personalized care plans for residents based on their needs and conditions. Jun 25, 2025
Corrected

Compare Nursing Homes around Cameron County The information below is reported by the Texas Health and Human Services Commission.

5 facilities compared · CMS & TX Dept. of Health data · Updated Apr 2026

Filter by care type
Veranda Rehabilitation and Healthcare
NH

Nursing Home Licensed facility providing 24/7 skilled nursing care for residents with complex, ongoing medical needs. Staffed by RNs, LPNs, and CNAs. Inspected and star-rated annually by CMS. Accepts Medicare (short-term rehab) and Medicaid (long-term care).

Harlingen
100
81.2%
+28%
2.96
-31%
-18%
1
12
2.4
1
87
-
33
Harlingen Healthcare, Inc.
$13.9M
$5.0M
36.2%
455925
Ebony Lake Nursing and Rehabilitation Center
NH

Nursing Home Licensed facility providing 24/7 skilled nursing care for residents with complex, ongoing medical needs. Staffed by RNs, LPNs, and CNAs. Inspected and star-rated annually by CMS. Accepts Medicare (short-term rehab) and Medicaid (long-term care).

Brownsville
122
59.3%
-7%
2.98
+11%
-18%
0
15
2.5
0
88
-
63
Regency Ihs Of Ebony Lake Llc
$6.1M
$2.8M
46.2%
675635
Alta Vista Rehabilitation and Healthcare
NH

Nursing Home Licensed facility providing 24/7 skilled nursing care for residents with complex, ongoing medical needs. Staffed by RNs, LPNs, and CNAs. Inspected and star-rated annually by CMS. Accepts Medicare (short-term rehab) and Medicaid (long-term care).

Brownsville
100
82.0%
+29%
3.26
-36%
-10%
2
16
2.7
4
80
-
71
Brownsville Care Associates, Inc
$12.1M
$4.5M
36.9%
455625
Mid Valley Nursing & Rehabilitation
NH

Nursing Home Licensed facility providing 24/7 skilled nursing care for residents with complex, ongoing medical needs. Staffed by RNs, LPNs, and CNAs. Inspected and star-rated annually by CMS. Accepts Medicare (short-term rehab) and Medicaid (long-term care).

Mercedes
123
75.3%
+19%
2.72
-77%
-25%
2
22
2.8
4
80
-
25
Roel, Alice
$11.7M
$3.5M
29.6%
676414
Brownsville Nursing and Rehabilitation Center
NH

Nursing Home Licensed facility providing 24/7 skilled nursing care for residents with complex, ongoing medical needs. Staffed by RNs, LPNs, and CNAs. Inspected and star-rated annually by CMS. Accepts Medicare (short-term rehab) and Medicaid (long-term care).

Brownsville
120
81.2%
+28%
2.64
+20%
-27%
2
40
4.0
3
111
-
34
Regency Ihs Of Brownsville Llc
$9.2M
$3.2M
35.2%
676083

Places of interest near Veranda Rehabilitation and Healthcare

Address 2.8 miles from city center

Calculate Travel Distance to Veranda Rehabilitation and Healthcare

Add your location

Address

Staffing Data (Q2 2025)

This data corresponds to Q2 2025 and is based on CMS Payroll-Based Journal.

Total staff 116
Employees 114
Contractors 2
Staff to resident ratio 1.33:1
11% worse than Texas average

Texas average ratio: 1.51:1

Avg staff/day 50
Average shift 8.2 hours
0% compared with Texas average

Texas average: 8.1 hours

Total staff hours (quarter) 37,509
Nursing staff breakdown
Registered Nurse

Manages medical care and health needs.

Total count 6
Average shift length Info Average shift length. Calculated as total hours divided by days worked and average staff per day. 10.5 hours

No contractors work on this role.

Licensed Practical Nurse

Assists with medical care and medications.

Total count 11
Average shift length Info Average shift length. Calculated as total hours divided by days worked and average staff per day. 10.1 hours

No contractors work on this role.

Certified Nursing Assistant

Helps with daily care and mobility.

Total count 34
Average shift length Info Average shift length. Calculated as total hours divided by days worked and average staff per day. 8.1 hours

No contractors work on this role.

Contractor staffing

Total hours from contractors

0.1%

49 contractor hours this quarter

Occupational Therapy Aide: 1 Medical Director: 1
Staff by category
Certified Nursing Assistant3403412,66291100%8.1
Licensed Practical Nurse110114,51891100%10.1
Speech Language Pathologist100103,2936875%7.6
Physical Therapy Aide8082,7037380%7.4
Medication Aide/Technician7072,05791100%8.4
Registered Nurse6061,8988796%10.5
Qualified Social Worker6061,8207380%7.3
Physical Therapy Assistant5051,5077279%7.6
Dental Services Staff3031,4336673%7.9
RN Director of Nursing4041,2106470%9
Clinical Nurse Specialist6061,0856470%9.1
Other Dietary Services Staff2027608796%8.5
Respiratory Therapy Technician4046687178%6.9
Administrator1015206571%8
Nurse Practitioner2025116268%8.1
Nurse Aide in Training4044132932%8
Dietitian1014044651%8.8
Occupational Therapy Aide0114155%8.3
Medical Director011855%1.6
34 Certified Nursing Assistant
% of Days 100%
11 Licensed Practical Nurse
% of Days 100%
10 Speech Language Pathologist
% of Days 75%
8 Physical Therapy Aide
% of Days 80%
7 Medication Aide/Technician
% of Days 100%
6 Registered Nurse
% of Days 96%
6 Qualified Social Worker
% of Days 80%
5 Physical Therapy Assistant
% of Days 79%
3 Dental Services Staff
% of Days 73%
4 RN Director of Nursing
% of Days 70%
6 Clinical Nurse Specialist
% of Days 70%
2 Other Dietary Services Staff
% of Days 96%
4 Respiratory Therapy Technician
% of Days 78%
1 Administrator
% of Days 71%
2 Nurse Practitioner
% of Days 68%
4 Nurse Aide in Training
% of Days 32%
1 Dietitian
% of Days 51%
1 Occupational Therapy Aide
% of Days 5%
1 Medical Director
% of Days 5%

Facility Characteristics

Source: CMS Long-Term Care Facility Characteristics (Data as of Jan 2026)

Total census
87 residents
Residents by payment source
Medicare
22 residents (25.3%)
Medicaid
61 residents (70.1%)
Private pay or other
4 residents (4.6%)
Programs & Services
Residents' Group

Residents meet regularly to discuss policies, care quality, and activities

Active Resident Council

Organized group of residents that meets regularly to discuss facility policies, quality of life, and activities.

Quality of care over time

These measures show how residents usually do over time at this home, based on health outcomes and preventive care.

High-risk clinical events score Info A composite score based on pressure ulcers, falls with injury, weight loss, walking ability decline, and activities of daily living decline. 12.0
39% worse than Texas average

Texas average: 8.6

Functional decline score Info A composite score based on activities of daily living decline, walking ability decline, and incontinence. 20.1
25% worse than Texas average

Texas average: 16.0

Long-stay resident measures
Significantly above average Texas avg: 4.2 Info CMS star rating based on long-stay quality measure performance. 5 stars = significantly above average, 1 star = significantly below average.
Need for Help with Daily Activities Increased Info Percent of long-stay residents whose need for help with daily activities has increased 18.1%
12% worse than Texas average

Texas average: 16.2%

Walking Ability Worsened Info Percent of long-stay residents whose ability to move independently worsened 29.3%
81% worse than Texas average

Texas average: 16.2%

Low Risk Residents with Bowel/Bladder Incontinence Info Percent of low risk long-stay residents who lose control of their bowels or bladder 12.8%
18% better than Texas average

Texas average: 15.7%

Falls with Major Injury Info Percent of long-stay residents experiencing one or more falls with major injury 1.4%
58% better than Texas average

Texas average: 3.2%

High Risk Residents with Pressure Ulcers Info Percent of long-stay high risk residents with pressure ulcers 2.2%
51% better than Texas average

Texas average: 4.4%

Urinary Tract Infection Info Percent of long-stay residents with a urinary tract infection 0.7%
13% better than Texas average

Texas average: 0.8%

Lost Too Much Weight Info Percent of long-stay residents who lose too much weight 9.1%
162% worse than Texas average

Texas average: 3.5%

Depressive Symptoms Info Percent of long-stay residents who have depressive symptoms 10.9%
278% worse than Texas average

Texas average: 2.9%

Antipsychotic Use Info Percent of long-stay residents who received an antipsychotic medication 1.4%
82% better than Texas average

Texas average: 7.9%

Pneumococcal Vaccine Info Percent of long-stay residents assessed and appropriately given the pneumococcal vaccine 100.0%
In line with Texas average

Texas average: 97.3%

Influenza Vaccine Info Percent of long-stay residents assessed and appropriately given the seasonal influenza vaccine 100.0%
In line with Texas average

Texas average: 97.9%

Hospitalizations per 1,000 days Info Number of hospitalizations per 1,000 long-stay resident days. 2.23
5% worse than Texas average

Texas average: 2.13

ED visits per 1,000 days Info Number of outpatient emergency department visits per 1,000 long-stay resident days. 0.86
58% better than Texas average

Texas average: 2.07

Short-stay resident measures
Significantly above average Texas avg: 2.9 Info CMS star rating based on short-stay quality measure performance. 5 stars = much above average, 1 star = much below average.
Pneumococcal Vaccine Info Percent of short-stay residents assessed and appropriately given the pneumococcal vaccine 100.0%
11% better than Texas average

Texas average: 90.4%

Antipsychotic medication increase Info Percent of short-stay residents who newly received an antipsychotic medication 0.4%
70% better than Texas average

Texas average: 1.4%

Influenza Vaccine Info Percent of short-stay residents assessed and appropriately given the seasonal influenza vaccine 100.0%
14% better than Texas average

Texas average: 88.0%

Re-hospitalized after SNF stay Info Percentage of short-stay residents who were re-hospitalized after their nursing home admission. 20.0%
23% better than Texas average

Texas average: 25.9%

Emergency department visits Info Percentage of short-stay residents who had an outpatient emergency department visit. 4.7%
61% better than Texas average

Texas average: 12.0%

Falls with major injury Info Percentage of SNF residents who experience falls with major injury during their stay. 1.9%
145% worse than Texas average

Texas average: 0.8%

Ability to care for self at discharge Info Percentage of residents at or above expected ability to care for themselves at discharge. 53.6%
In line with Texas average

Texas average: 53.7%

Successful return to home or community Info Rate of successful return to home or community from a skilled nursing facility. 45.8%
9% worse than Texas average

Texas average: 50.6%

Penalties and fines

Federal penalties imposed by CMS for regulatory violations, including civil money penalties (fines) and denials of payment for new Medicare/Medicaid admissions.

Source: CMS Penalties Database (Data as of Jan 2026)

Total fines amount $8K
90% lower than Texas average

Texas average: $80K

Number of fines 1
60% fewer fines than Texas average

Texas average: 2.5

Payment Denials Info Serious action where Medicare and/or Medicaid temporarily stops payments for new residents until issues are fixed. 0
100% fewer payment denials than Texas average

Texas average: 0.2

Fines amount comparison
This facility $8K
Texas average $80K
Penalty History

Penalties are imposed by CMS for violations of federal nursing home regulations.

Civil Money Penalty Info Fines imposed for noncompliance, which can be assessed per day or per instance of violation. Apr 12, 2024
$8K

Last updated: Jan 2026

Guides for Better Senior Living

Care Cost Calculator: See Prices in Your Area

Nursing Home Data Explorer

Don’t Wait Too Long: 7 Red Flag Signs Your Parent Needs Assisted Living Now

The True Cost of Assisted Living in 2025 – And How Families Are Paying For It

Understanding Senior Living Costs: Pricing Models, Discounts & Financial Assistance

Financial Aid for Texas Seniors

Get financial aid guidance

Community Care for the Aged and Disabled (CCAD)

TX Medicaid CCAD

Age 65+ or disabled, Texas resident, Medicaid-eligible, care need (not always nursing home level).

~$2,829/month (300% FBR, individual).

$2,000 (individual), $3,000 (couple).

Large state; rural access challenges.

Texas Community Care Services

TX CCS

Age 60+, Texas resident, at risk of decline.

~$2,000/month (individual, varies).

$5,000 (individual).

Limited funding; high demand in urban areas.

Area Agency on Aging (AAA) Services

Texas AAA Services

Age 60+, TX resident; no income/asset limits.

None; donations encouraged.

Not assessed.

28 AAAs; includes Meals on Wheels in some areas.

Medicare Savings Program (MSP)

Texas Medicare Savings Program

Age 65+ or disabled, TX resident, Medicare Part A/B.

~$2,510/month (QMB), ~$3,380/month (SLMB), ~$3,598/month (QI)—individual.

$9,430 (individual), $14,130 (couple).

Includes Extra Help for Part D; no waitlist.

Low-Income Home Energy Assistance Program (LIHEAP)

Texas Comprehensive Energy Assistance Program (CEAP)

Age 60+ prioritized, TX resident, low-income.

~$3,970/month (185% FPL).

Not assessed.

Priority for elderly/disabled; covers gas, electric, propane.

Family Caregiver Support Program (FCSP)

Texas Family Caregiver Support Program

Caregivers of 60+ needing care or 55+ caregivers of others; TX resident; 2+ ADLs.

No strict cap; prioritizes low-income (~$24,980/year).

Not assessed.

High rural demand; includes grandparent caregivers.

Senior Community Service Employment Program (SCSEP)

Texas SCSEP

Age 55+, unemployed, low-income, TX resident.

~$1,983/month (125% FPL).

Not specified.

Priority for veterans, rural residents; AARP partnership.

VA Aid and Attendance (A&A) and Housebound Benefits

Texas VA Aid and Attendance/Housebound

Age 65+ or disabled veteran/spouse, TX resident, wartime service, ADL help (A&A) or homebound.

Net income < ~$1,984/month (veteran with dependent, A&A); pension offsets income.

~$155,356 (net worth).

High veteran population; supports rural/urban needs.

Property Tax Exemption for Seniors

Texas Senior Property Tax Exemption

Age 65+, TX resident, homeowner (homestead).

None; tax-based eligibility.

Not assessed.

$25,000+ exemption; optional freeze in some counties; saves ~$500-$1,000/year.

Senior Farmers’ Market Nutrition Program (SFMNP)

Texas SFMNP

Age 60+, TX resident, low-income.

~$2,322/month (185% FPL).

Not assessed.

Vouchers (~$50/season); serves ~20,000 via 28 AAAs.