


Total staff
84
Employees
58
Contractors
26
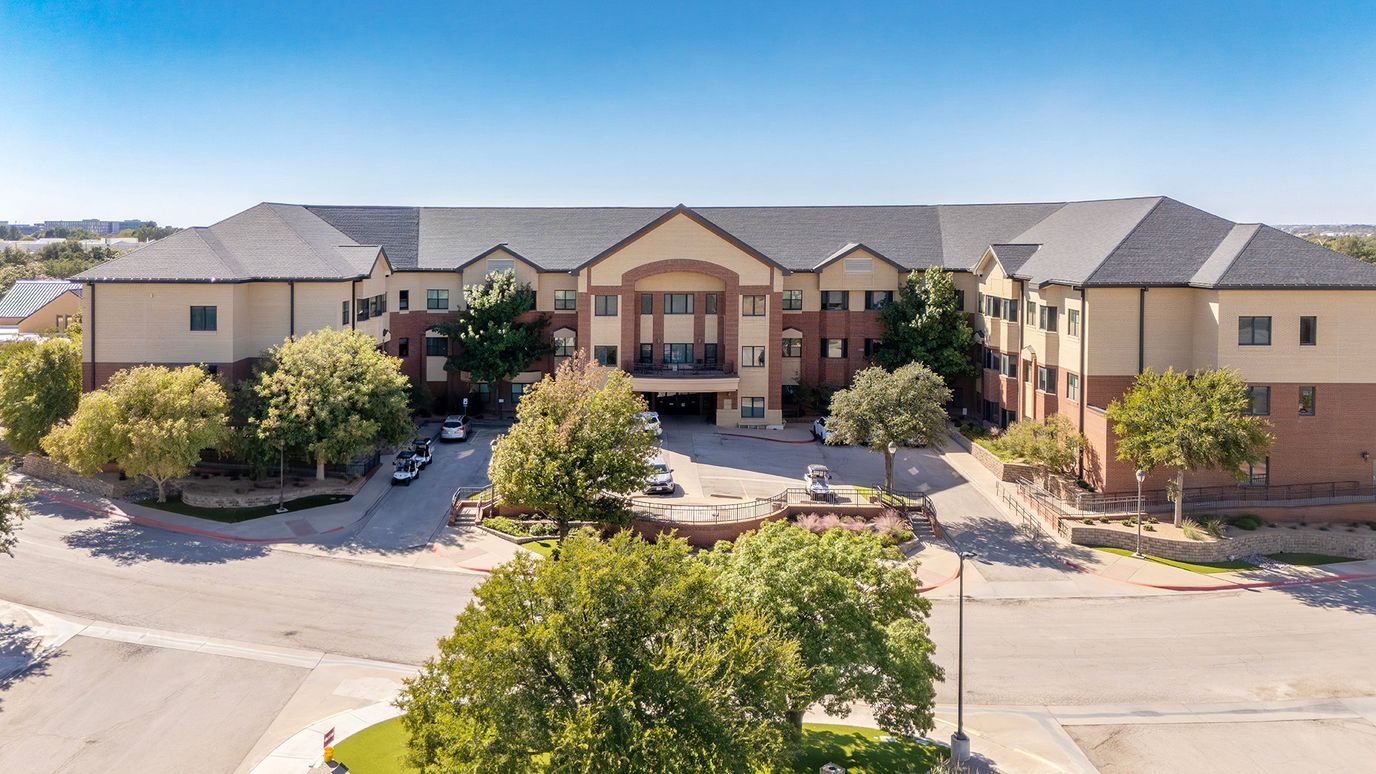
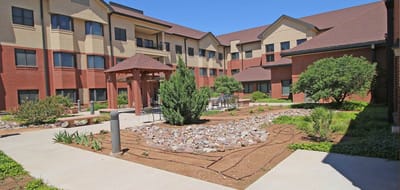

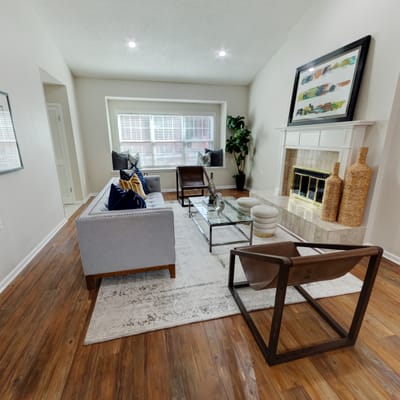


Vogel Center Assisted Living with Memory Support, located on the south wing of Helen Greathouse is a senior living community specializing in providing assisted living with specialized memory care services to residents in early stages of Alzheimers and other forms of dementia. The community’s unwavering commitment to residents’ well-being is reflected in the meticulous services they provide their residents. From three nutritious, appetizing meals served daily, a quick response emergency call system, and round-the-clock presence of professional, licensed nursing staff, residents and families are provided a peace of mind.
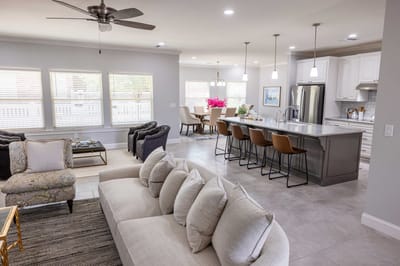
At Vogel Center, life is more than routine; it’s a vibrant tapestry of engaging experiences. Residents partake in daily planned activities that cater to diverse interests, enhancing social connections and providing mental stimulation. The community’s commitment to holistic well-being is evident in the comprehensive services offered, including dietary consulting, medication assistance, and bathing, dressing, and mobility assistance provided by dedicated staff. Daily housekeeping, including bathroom cleaning and bed making, ensures a clean and comfortable living environment, while weekly laundry services cater to both linens and personal clothing, allowing residents to focus on enjoying their days at The Vogel Center.
Staffing hours
![]() Daily nursing hours per resident by staff type, reported to CMS. Higher is generally better — compare this facility to state and national averages to see where staffing stands.
Daily nursing hours per resident by staff type, reported to CMS. Higher is generally better — compare this facility to state and national averages to see where staffing stands.
Hours per resident per day vs Texas averages
Total nursing care
![]() This home is ranked 14th out of 233 homes in Texas for nurse hours. Total adjusted nursing hours per resident per day, combining RN, LPN, and aide time. CMS adjusts this for case-mix so facilities can be fairly compared.
This home is ranked 14th out of 233 homes in Texas for nurse hours. Total adjusted nursing hours per resident per day, combining RN, LPN, and aide time. CMS adjusts this for case-mix so facilities can be fairly compared.
5h 12m
43% above state avg3 of 6 metrics below state avg
Reporting period: October 1 – December 31, 2025 (Q4 2025). Source: CMS Payroll-Based Journal report.
Manages medical care and health needs.
Assists with medical care and medications.
Helps with daily care and mobility.
Total hours from contractors
1,225 contractor hours this quarter
| Certified Nursing Assistant | 39 | 0 | 39 | 9,200 | 92 | 100% | 7.9 |
| Licensed Practical Nurse | 9 | 3 | 12 | 3,114 | 92 | 100% | 9.6 |
| Physical Therapy Aide | 0 | 3 | 3 | 628 | 70 | 76% | 4.9 |
| Nurse Practitioner | 1 | 0 | 1 | 488 | 61 | 66% | 8 |
| Other Dietary Services Staff | 1 | 0 | 1 | 467 | 63 | 68% | 7.4 |
| Administrator | 1 | 0 | 1 | 464 | 58 | 63% | 8 |
| Dietitian | 1 | 0 | 1 | 448 | 58 | 63% | 7.7 |
| RN Director of Nursing | 1 | 0 | 1 | 424 | 53 | 58% | 8 |
| Mental Health Service Worker | 1 | 0 | 1 | 408 | 51 | 55% | 8 |
| Registered Nurse | 4 | 1 | 5 | 366 | 47 | 51% | 7.5 |
| Respiratory Therapy Technician | 0 | 5 | 5 | 148 | 67 | 73% | 1.3 |
| Speech Language Pathologist | 0 | 5 | 5 | 139 | 66 | 72% | 1.6 |
| Physical Therapy Assistant | 0 | 4 | 4 | 119 | 53 | 58% | 2.1 |
| Physician Assistant | 0 | 1 | 1 | 45 | 54 | 59% | 0.8 |
| Qualified Social Worker | 0 | 2 | 2 | 33 | 26 | 28% | 1.2 |
| Occupational Therapy Aide | 0 | 1 | 1 | 24 | 4 | 4% | 6.1 |
| Occupational Therapy Assistant | 0 | 1 | 1 | 18 | 5 | 5% | 3.6 |
Federal penalties imposed by CMS for regulatory violations, including civil money penalties (fines) and denials of payment for new Medicare/Medicaid admissions.
Source: CMS Penalties Database
No penalties in the past 3 years
No civil money penalties or payment denials were reported in the last 3 years.
These measures show how residents usually do over time at this home, based on health outcomes and preventive care.
Texas average: 8.6
Texas average: 16.0
Texas average: 16.2%
Texas average: 15.7%
Texas average: 3.2%
Texas average: 4.4%
Texas average: 0.8%
Texas average: 3.5%
Texas average: 2.9%
Texas average: 7.9%
Texas average: 97.3%
Texas average: 97.9%
Texas average: 90.4%
Texas average: 1.4%
Texas average: 88.0%
Texas average: 25.9%
Texas average: 12.0%
Texas average: 0.8%
Texas average: 53.7%
Texas average: 50.6%
Quality measures are calculated from Minimum Data Set (MDS) assessments. For most measures, lower percentages indicate better care quality.
45% of new residents, usually for short-term rehab.
55% of new residents, often for short stays.
Source: CMS Long-Term Care Facility Characteristics (Data as of Jan 2026)
Residents meet regularly to discuss policies, care quality, and activities
Part of a Continuing Care Retirement Community offering multiple care levels
Organized group of residents that meets regularly to discuss facility policies, quality of life, and activities.
Data sourced from CMS Long-Term Care Facility Characteristics quarterly report. Payer mix reflects the current resident census by primary payment source.
Historical financial and operational data for Vogel Center Assisted Living With Memory Support from 2012–2024, based on CMS SNF Cost Reports.
Key figures below are for fiscal year ending in 05/2024.
Based on CMS SNF Cost Report for fiscal year ending in 05/2024.
Pets Allowed
This home supports both short-term rehab and long-term care, with residents staying for a wide range of durations.
Most new residents arrive under private pay (55% of admissions), and a typical private pay stay runs around 3 - 4 months.
Coverage residents most often arrive under.
Coverage residents most often leave under.
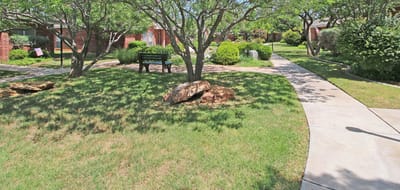
![]() 5.0 miles from city center
5.0 miles from city center
![]() Estimated distance in miles from Midland's city center to Vogel Center Assisted Living With Memory Support's address, calculated via Google Maps.
Estimated distance in miles from Midland's city center to Vogel Center Assisted Living With Memory Support's address, calculated via Google Maps.
Add your location
Info below is compiled from CMS reports & the TX Health & Human Services Commission (HHSC), senior community websites & trusted data sources such as Walk Score & BBB.
Communities are listed from highest to lowest based on our ranking methodology.
| Vogel Center Assisted Living With Memory Support | NH AL IL MC SNF | Midland (Trinity Towers Manor) | 44
Facility
44
TX AVG
78
Rank
#708 / 981 |
91.6%
Facility
91.6%
TX AVG
66.3
Rank
#16 / 175 | +38% | 5.19
Facility
5.19
TX AVG
3.63
Rank
#14 / 233 | -22% | +43% | $0
Facility
$0
TX AVG
$81.8k
Rank
#1 / 238 | 10
Facility
10
TX AVG
25.9
Rank
#21 / 235 | 3.3
Facility
3.3
TX AVG
3.7
Rank
#125 / 235 | - | 40 | - |
47
Facility
47
TX AVG
42
Rank
#586 / 1346 | Manor Park, Inc | $2.8MFiscal year ending 05/2024
Facility
$2.8MFiscal year ending 05/2024
TX AVG
$9.3M
Rank
#214 / 219 | $14.3MFiscal year ending 05/2024
Facility
$14.3MFiscal year ending 05/2024
TX AVG
$5.4M
Rank
#9 / 219 | 513.4%Fiscal year ending 05/2024
Facility
513.4%Fiscal year ending 05/2024
TX AVG
71.6%
Rank
#1 / 200 | 676015 | ||||
| Ashton Medical Lodge | NH MC SNF | Midland (Western Hills) | 144
Facility
144
TX AVG
78
Rank
#73 / 981 |
88.9%
Facility
88.9%
TX AVG
66.3
Rank
#30 / 175 | +34% | 2.99
Facility
2.99
TX AVG
3.63
Rank
#201 / 233 | +15% | -18% | $13.4k
Facility
$13.4k
TX AVG
$81.8k
Rank
#86 / 238 | 26
Facility
26
TX AVG
25.9
Rank
#156 / 235 | 3.7
Facility
3.7
TX AVG
3.7
Rank
#158 / 235 | 1 | 128 | - |
14
Facility
14
TX AVG
42
Rank
#1181 / 1346 | Stephen Bowerman | $14.6M*Fiscal year ending 09/2022These figures are from this home's most recent complete cost report — an older period than most facilities report. Compare with that in mind. | $7.3M*Fiscal year ending 09/2022These figures are from this home's most recent complete cost report — an older period than most facilities report. Compare with that in mind. | 50%*Fiscal year ending 09/2022These figures are from this home's most recent complete cost report — an older period than most facilities report. Compare with that in mind. | 676430 |
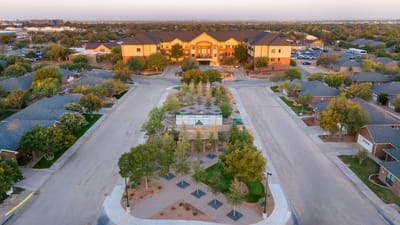
Vogel Center Assisted Living With Memory Support is located in Midland, Texas.
Here are the financial assistance programs available to residents in Texas.
Vogel Center Assisted Living With Memory Support is in the Trinity Towers Manor neighborhood.
Vogel Center Assisted Living With Memory Support has a walk score of 47. Somewhat walkable. A few nearby services may be reachable on foot, but most trips require transportation.
Vogel Center Assisted Living With Memory Support's occupancy is 37.0%.
Yes, Vogel Center Assisted Living With Memory Support allows residents to bring their pets.
Vogel Center Assisted Living With Memory Support is registered as a non-profit.
Yes — there are 9 photos of Vogel Center Assisted Living With Memory Support in the photo gallery on this page.
Vogel Center Assisted Living With Memory Support is located at 2208 N Loop 250 W, Midland, TX 79707.
Care Cost Calculator: See Prices in Your Area
Nursing Home Data Explorer
Don’t Wait Too Long: 7 Red Flag Signs Your Parent Needs Assisted Living Now
The True Cost of Assisted Living in 2025 – And How Families Are Paying For It
Understanding Senior Living Costs: Pricing Models, Discounts & Financial Assistance


