


Total staff
391
Employees
228
Contractors
163
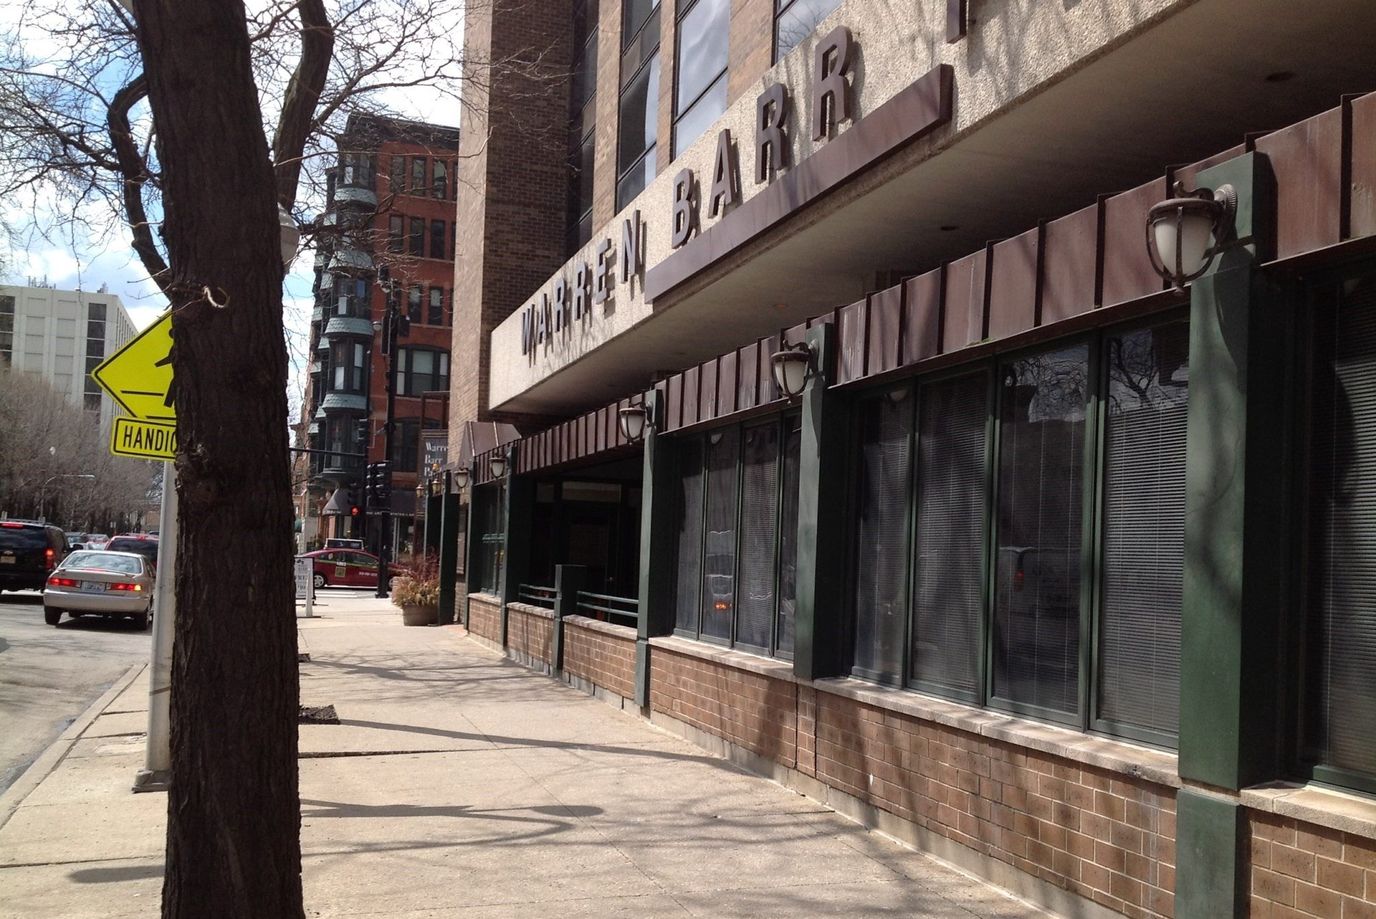
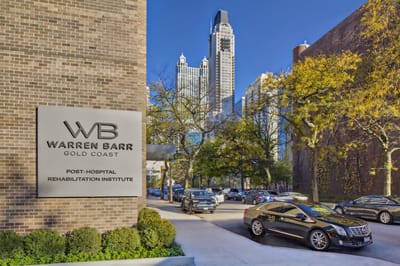


Positioned in downtown Chicago’s walkable Gold Coast neighborhood, Warren Barr Gold Coast operates as a 271-bed skilled nursing facility serving a balanced population of short-term rehabilitation and longer-stay residents. The Jack Rajchenbach Family Trust owns the community; Kate administers day-to-day operations.
With an average resident stay of 47 days and incoming admissions split nearly equally between Medicare (48 percent) and private-pay (48 percent) patients, the facility balances acute post-hospital transitions alongside extended care needs.
Ann & Robert H. Lurie Children’s Hospital sits 0.5 miles away.
CMS health inspections place the facility 8.1 percent above state performance, with an overall rating 19 percent higher than the Illinois average. Long-stay quality measures earn a 5-star CMS rating; hospitalizations run 26 percent below state averages. Joint Commission awarded both Gold Seal of Approval for Post-Acute Care and Nursing Care Accreditation; the facility earned recognition as Best Nursing Home 2024.
Registered nurses average 1 hour 9 minutes per resident daily, nearly 60 percent above Illinois benchmarks. Weekend RN presence, at 1 hour 10 minutes per resident, more than doubles the state norm, reflecting intentional coverage outside standard business hours. Physical therapy runs at 6 minutes per resident per day, double the state average. The facility fields 124 RNs, 58 LPNs, and 141 CNAs, yielding a staff-to-resident ratio 14 percent better than the state benchmark.
Operating financials show a $2.5 million loss against $53 million in gross revenue. Federal enforcement is light: $27,000 in cumulative fines across three actions; 81 percent below the state average.
Eight specialized programs address post-acute complexity: orthopedic and cardiac rehabilitation, post-transplant management, peritoneal dialysis, LVAD support, pulmonary care, and specialized wound management.
The facility serves short-term rehabilitation and complex post-acute care placements where specialized programming and elevated clinical staffing are operational priorities.
Staffing hours
![]() Daily nursing hours per resident by staff type, reported to CMS. Higher is generally better — compare this facility to state and national averages to see where staffing stands.
Daily nursing hours per resident by staff type, reported to CMS. Higher is generally better — compare this facility to state and national averages to see where staffing stands.
Hours per resident per day vs Illinois averages
Total nursing care
![]() This home is ranked 71st out of 155 homes in Illinois for nurse hours. Total adjusted nursing hours per resident per day, combining RN, LPN, and aide time. CMS adjusts this for case-mix so facilities can be fairly compared.
This home is ranked 71st out of 155 homes in Illinois for nurse hours. Total adjusted nursing hours per resident per day, combining RN, LPN, and aide time. CMS adjusts this for case-mix so facilities can be fairly compared.
2h 58m
4% below state avg1 of 6 metrics below state avg
Reporting period: October 1 – December 31, 2025 (Q4 2025). Source: CMS Payroll-Based Journal report.
Manages medical care and health needs.
Assists with medical care and medications.
Helps with daily care and mobility.
Total hours from contractors
11,242 contractor hours this quarter
| Certified Nursing Assistant | 138 | 3 | 141 | 40,942 | 92 | 100% | 7.2 |
| Registered Nurse | 42 | 82 | 124 | 15,727 | 92 | 100% | 8.2 |
| Licensed Practical Nurse | 22 | 36 | 58 | 9,317 | 92 | 100% | 8.3 |
| Clinical Nurse Specialist | 12 | 0 | 12 | 5,158 | 91 | 99% | 5.9 |
| Dental Services Staff | 5 | 0 | 5 | 2,412 | 90 | 98% | 5.7 |
| Physical Therapy Assistant | 0 | 14 | 14 | 2,210 | 88 | 96% | 7 |
| Speech Language Pathologist | 0 | 7 | 7 | 2,123 | 75 | 82% | 7.7 |
| Respiratory Therapy Technician | 0 | 5 | 5 | 1,965 | 77 | 84% | 7.7 |
| Other Dietary Services Staff | 4 | 0 | 4 | 1,779 | 90 | 98% | 7.3 |
| Physical Therapy Aide | 0 | 9 | 9 | 1,011 | 70 | 76% | 7.3 |
| Qualified Social Worker | 0 | 7 | 7 | 777 | 72 | 78% | 7.2 |
| Administrator | 1 | 0 | 1 | 512 | 90 | 98% | 5.7 |
| Nurse Practitioner | 1 | 0 | 1 | 512 | 90 | 98% | 5.7 |
| RN Director of Nursing | 1 | 0 | 1 | 512 | 90 | 98% | 5.7 |
| Mental Health Service Worker | 1 | 0 | 1 | 480 | 84 | 91% | 5.7 |
| Dietitian | 1 | 0 | 1 | 285 | 51 | 55% | 5.6 |
Includes penalties issued in 2023-2025
Federal penalties imposed by CMS for regulatory violations, including civil money penalties (fines) and denials of payment for new Medicare/Medicaid admissions.
Source: CMS Penalties Database (Data as of Jan 2026)
Illinois average: $143K
Illinois average: 3.0
Illinois average: 1.1
Penalties are imposed by CMS for violations of federal nursing home regulations.
3 penalties in the past 3 years
Multiple penalties were reported in the last 3 years.
Last updated: Jan 2026
These measures show how residents usually do over time at this home, based on health outcomes and preventive care.
Illinois average: 9.7
Illinois average: 18.6
Illinois average: 15.5%
Illinois average: 18.4%
Illinois average: 21.6%
Illinois average: 3.4%
Illinois average: 5.3%
Illinois average: 1.8%
Illinois average: 6.5%
Illinois average: 48.1%
Illinois average: 20.2%
Illinois average: 89.2%
Illinois average: 91.6%
Illinois average: 2.05
Illinois average: 2.25
Illinois average: 68.3%
Illinois average: 2.3%
Illinois average: 63.0%
Illinois average: 26.2%
Illinois average: 14.0%
Illinois average: 0.8%
Illinois average: 53.7%
Illinois average: 50.6%
Quality measures are calculated from Minimum Data Set (MDS) assessments. For most measures, lower percentages indicate better care quality.
48% of new residents, usually for short-term rehab.
48% of new residents, often for short stays.
4% of new residents, often for long-term daily care.
Source: CMS Long-Term Care Facility Characteristics (Data as of Jan 2026)
Data sourced from CMS Long-Term Care Facility Characteristics quarterly report. Payer mix reflects the current resident census by primary payment source.
Historical financial and operational data for Warren Barr Gold Coast from 2011–2023, based on CMS SNF Cost Reports.
Key figures below are for fiscal year ending in 12/2023.
Based on CMS SNF Cost Report for fiscal year ending in 12/2023.
This home supports both short-term rehab and long-term care, with residents staying for a wide range of durations.
New residents most often arrive under Medicare (48% of admissions), and a typical Medicare stay runs around 23 days.
Coverage residents most often arrive under.
Coverage residents most often leave under.
![]() 1.6 miles from city center
1.6 miles from city center
![]() Estimated distance in miles from Chicago's city center to Warren Barr Gold Coast's address, calculated via Google Maps.
— 0.09 miles to nearest hospital (Medically Speaking Sc)
Estimated distance in miles from Chicago's city center to Warren Barr Gold Coast's address, calculated via Google Maps.
— 0.09 miles to nearest hospital (Medically Speaking Sc)
Add your location
Info below is compiled from CMS reports & the IL Dept. of Public Health (IDPH), senior community websites & trusted data sources such as Walk Score & BBB.
Communities are listed from highest to lowest based on our ranking methodology.
| Mercy Circle Senior Living | NH AL IL MC SNF | Chicago (Mount Greenwood) | 43
Facility
43
IL AVG
85
Rank
#330 / 419 | - | - | 4.57
Facility
4.57
IL AVG
3.10
Rank
#24 / 155 | -8% | +47% | $0
Facility
$0
IL AVG
$151.3k
Rank
#1 / 155 | 16
Facility
16
IL AVG
36.8
Rank
#24 / 155 | 4.0
Facility
4.0
IL AVG
3.7
Rank
#105 / 155 | - | 22 | - |
44
Facility
44
IL AVG
51
Rank
#392 / 648 | Sisters Of Mercy Of The Americas West Midwest Community Inc | $10.3MFiscal year ending 06/2024
Facility
$10.3MFiscal year ending 06/2024
IL AVG
$12.2M
Rank
#95 / 154 | $5.1MFiscal year ending 06/2024
Facility
$5.1MFiscal year ending 06/2024
IL AVG
$4.8M
Rank
#112 / 154 | 49.8%Fiscal year ending 06/2024
Facility
49.8%Fiscal year ending 06/2024
IL AVG
44.3%
Rank
#105 / 154 | 146174 | ||||
| The Selfhelp Home Senior Living Community | NH AL IL RC SNF | Chicago (Uptown) | 72
Facility
72
IL AVG
85
Rank
#204 / 419 |
81.9%
Facility
81.9%
IL AVG
73
Rank
#63 / 157 | +12% | 5.56
Facility
5.56
IL AVG
3.10
Rank
#8 / 155 | +44% | +79% | $0
Facility
$0
IL AVG
$151.3k
Rank
#1 / 155 | 21
Facility
21
IL AVG
36.8
Rank
#41 / 155 | 5.3
Facility
5.3
IL AVG
3.7
Rank
#138 / 155 | 1 | 59 | A+ |
92
Facility
92
IL AVG
51
Rank
#28 / 648 | Marvin Rubin | $9.3MFiscal year ending 09/2023
Facility
$9.3MFiscal year ending 09/2023
IL AVG
$12.2M
Rank
#76 / 154 | $7.0MFiscal year ending 09/2023
Facility
$7.0MFiscal year ending 09/2023
IL AVG
$4.8M
Rank
#72 / 154 | 75.3%Fiscal year ending 09/2023
Facility
75.3%Fiscal year ending 09/2023
IL AVG
44.3%
Rank
#59 / 154 | 146009 | ||||
| The Clare | NH AL IL MC SNF | Chicago (Rush & Division) | 49
Facility
49
IL AVG
85
Rank
#294 / 419 |
92.2%
Facility
92.2%
IL AVG
73
Rank
#23 / 157 | +26% | 3.69
Facility
3.69
IL AVG
3.10
Rank
#48 / 155 | +61% | +19% | $0
Facility
$0
IL AVG
$151.3k
Rank
#1 / 155 | 13
Facility
13
IL AVG
36.8
Rank
#19 / 155 | 2.6
Facility
2.6
IL AVG
3.7
Rank
#25 / 155 | 1 | 45 | A+ |
100
Facility
100
IL AVG
51
Rank
#1 / 648 | County Of Fulton | $4.4MFiscal year ending 11/2023
Facility
$4.4MFiscal year ending 11/2023
IL AVG
$12.2M
Rank
#147 / 154 | $3.6MFiscal year ending 11/2023
Facility
$3.6MFiscal year ending 11/2023
IL AVG
$4.8M
Rank
#146 / 154 | 81.8%Fiscal year ending 11/2023
Facility
81.8%Fiscal year ending 11/2023
IL AVG
44.3%
Rank
#14 / 154 | 146151 | ||||
| Asbury Gardens | NH HOS MC PC SNF | North Aurora (Airport Road) | 75
Facility
75
IL AVG
85
Rank
#193 / 419 |
76.5%
Facility
76.5%
IL AVG
73
Rank
#78 / 157 | +5% | 4.00
Facility
4.00
IL AVG
3.10
Rank
#41 / 155 | +6% | +29% | $6.4k
Facility
$6.4k
IL AVG
$151.3k
Rank
#66 / 155 | 21
Facility
21
IL AVG
36.8
Rank
#41 / 155 | 3.5
Facility
3.5
IL AVG
3.7
Rank
#72 / 155 | - | 57 | A+ |
38
Facility
38
IL AVG
51
Rank
#434 / 648 | Abraham Diamond | $6.7MFiscal year ending 12/2023
Facility
$6.7MFiscal year ending 12/2023
IL AVG
$12.2M
Rank
#137 / 154 | $3.8MFiscal year ending 12/2023
Facility
$3.8MFiscal year ending 12/2023
IL AVG
$4.8M
Rank
#128 / 154 | 56.5%Fiscal year ending 12/2023
Facility
56.5%Fiscal year ending 12/2023
IL AVG
44.3%
Rank
#28 / 154 | 146170 | ||||
| Warren Barr Gold Coast | NH SNF | Chicago (Rush & Division) | 271
Facility
271
IL AVG
85
Rank
#6 / 419 |
73.5%
Facility
73.5%
IL AVG
73
Rank
#90 / 157 | +1% | 2.97
Facility
2.97
IL AVG
3.10
Rank
#71 / 155 | +123% | -4% | $25.0k
Facility
$25.0k
IL AVG
$151.3k
Rank
#86 / 155 | 46
Facility
46
IL AVG
36.8
Rank
#112 / 155 | 2.7
Facility
2.7
IL AVG
3.7
Rank
#28 / 155 | 3 | 199 | - |
100
Facility
100
IL AVG
51
Rank
#1 / 648 | Jack Rajchenbach Family Trust | $31.0MFiscal year ending 12/2023
Facility
$31.0MFiscal year ending 12/2023
IL AVG
$12.2M
Rank
#3 / 154 | $13.3MFiscal year ending 12/2023
Facility
$13.3MFiscal year ending 12/2023
IL AVG
$4.8M
Rank
#5 / 154 | 42.9%Fiscal year ending 12/2023
Facility
42.9%Fiscal year ending 12/2023
IL AVG
44.3%
Rank
#138 / 154 | 145336 |
Warren Barr Gold Coast is located in Chicago, Illinois.
Here are the financial assistance programs available to residents in Illinois.
Warren Barr Gold Coast is in the Rush & Division neighborhood.
Warren Barr Gold Coast has a walk score of 100. Walker's paradise. Daily errands do not require a car, with many shops and services nearby.
Warren Barr Gold Coast's occupancy is 71.3%.
No, Warren Barr Gold Coast has a no-pet policy.
Warren Barr Gold Coast is registered as a for-profit.
Yes — there are 13 photos of Warren Barr Gold Coast in the photo gallery on this page.
Warren Barr Gold Coast is located at 66 W Oak St, Chicago, IL 60610.
Care Cost Calculator: See Prices in Your Area
Nursing Home Data Explorer
Don’t Wait Too Long: 7 Red Flag Signs Your Parent Needs Assisted Living Now
The True Cost of Assisted Living in 2025 – And How Families Are Paying For It
Understanding Senior Living Costs: Pricing Models, Discounts & Financial Assistance


