Explore Open Rooms

1 Contact details
2 What type of senior care service are you looking for?
3 What budget do you have in mind for senior care?
4 How soon do you need to find care?
5 Additional details

Thank you for your interest!

Our team will be in touch shortly to help with next steps.

Nursing Home in Broward County

CMS overall rating Info The Overall CMS Rating combines results from health inspections, staffing levels and quality measures. Health inspections carry the most weight. Staffing and quality scores can increase or decrease the final rating based on performance compared to state and national standards.

West Broward Care Center

7751 W Broward Blvd, Plantation, FL 33324 View map
Overview of West Broward Care Center

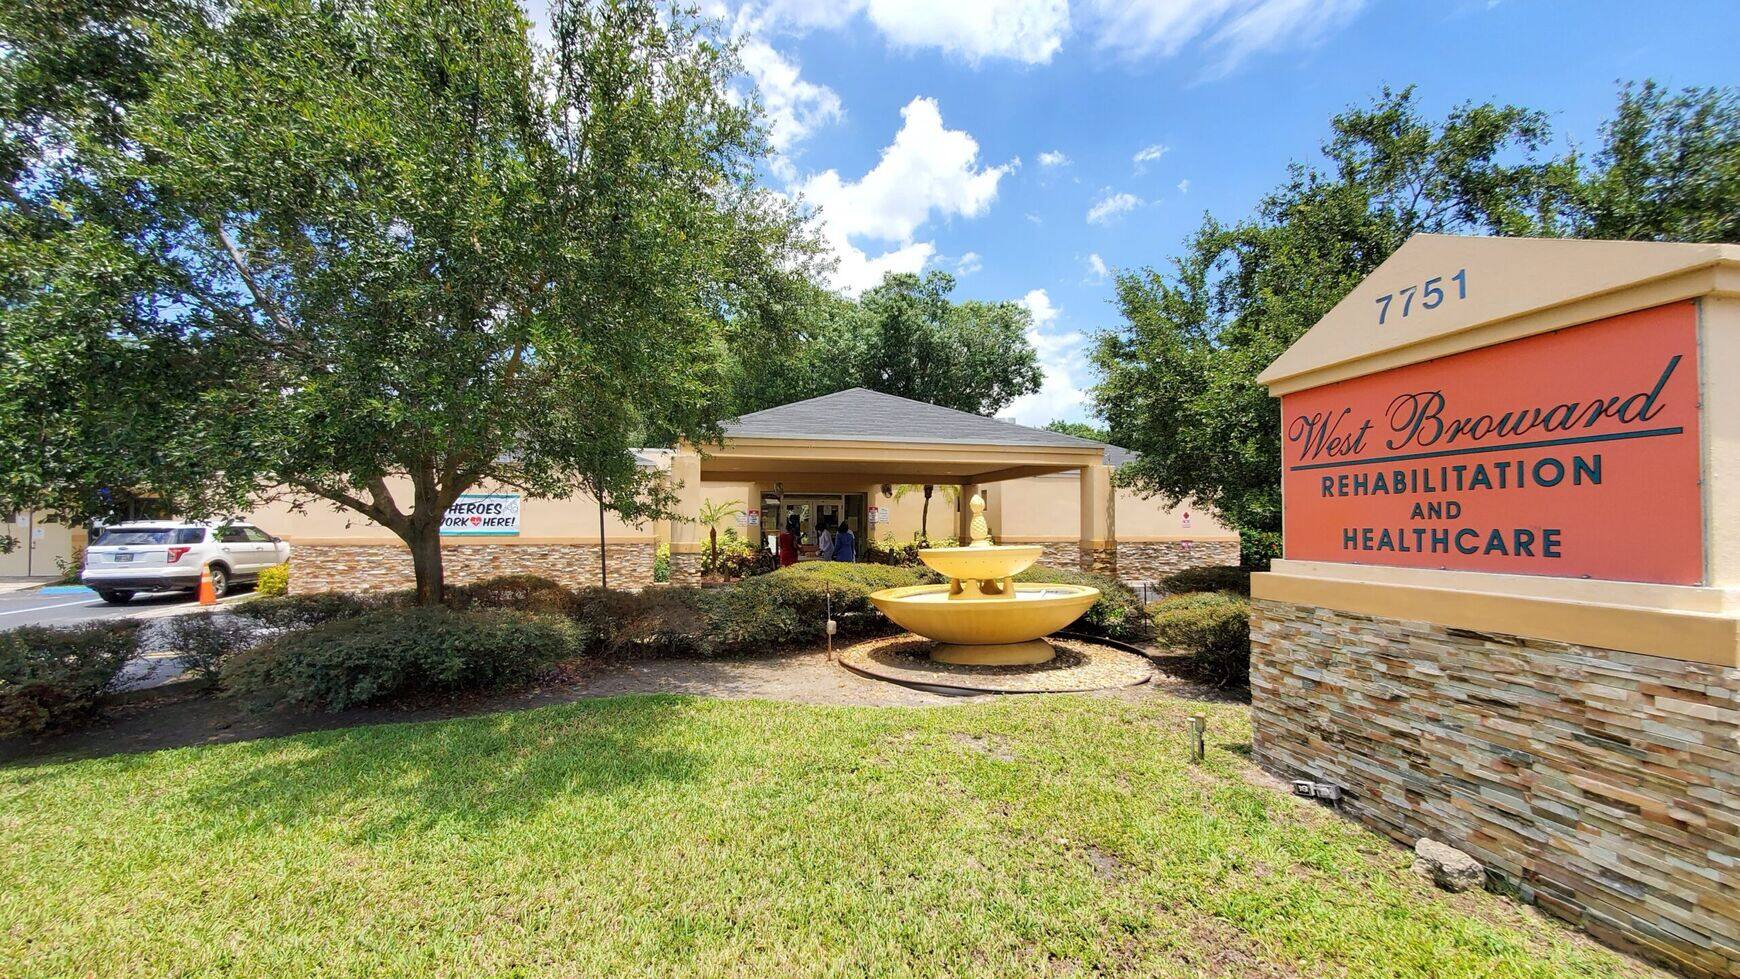
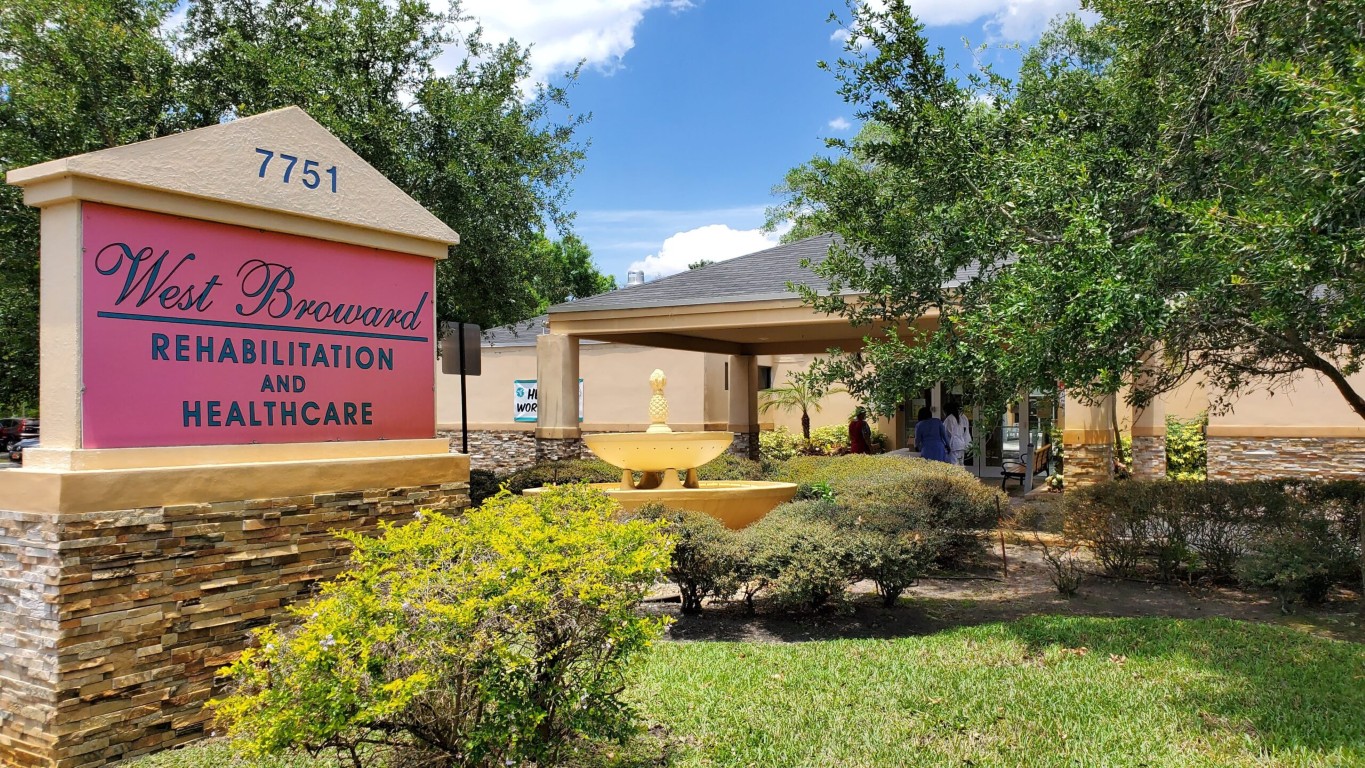
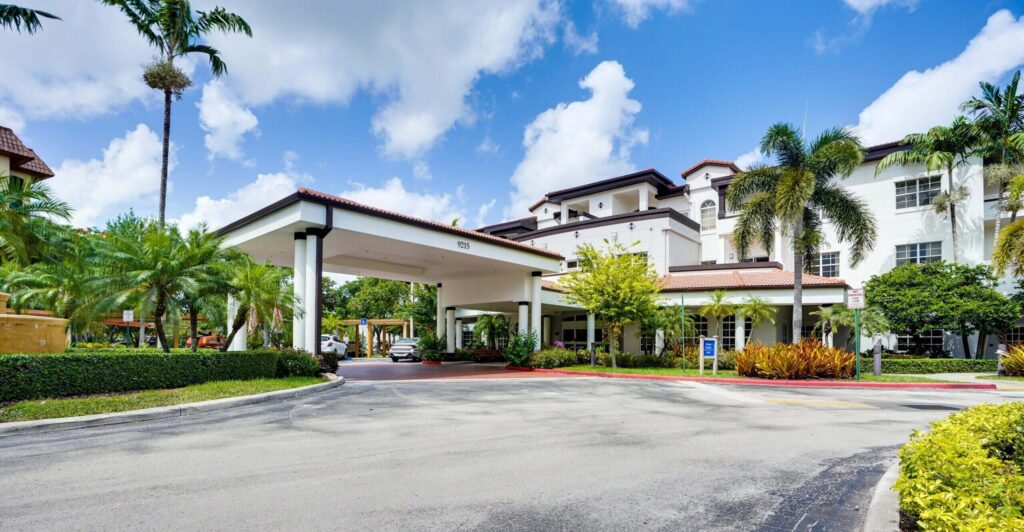
Conveniently located near delightful local amenities in West Broward Boulevard, Plantation, FL, West Broward Care Center is a dedicated community that offers short-term rehabilitation, long-term care, respite care, and hospice care. With different levels of care provided from a kind and highly trained team available around the clock, residents can rest assured of receiving the right care and support for their special needs. Promoting a warm and welcoming environment, the community ensures residents live a maintenance-free lifestyle.

To keep residents active and socially engaged, a carefully curated calendar of enriching activities and engaging programs tailored to their leisure and wellness is conducted. Delightful and nutritious meals are also served to meet residents’ dietary needs and preferences. Live a worry-free retirement, accompanied by the community’s dedicated services.

(954) 473-8040

Quality ratings

Measured by Centers for Medicare & Medicaid Services (CMS)

Overall rating Info The Overall CMS Rating combines results from health inspections, staffing levels and quality measures. Health inspections carry the most weight. Staffing and quality scores can increase or decrease the final rating based on performance compared to state and national standards.
2/5
Florida average: 3.2/5
Health Inspection Info Based on the results of the facility's three most recent standard inspections and any complaint investigations. CMS reviews the number, scope, and severity of deficiencies, with more recent findings weighted more heavily.
2/5
Florida average: 2.8/5
Staffing Info Measures average nursing staff hours per resident per day, including Registered Nurses (RNs) and total nursing staff. Ratings are adjusted based on the level of care residents require and are compared to state and national benchmarks.
4/5
Florida average: 3.4/5
Quality Measures Info Based on clinical and physical health indicators reported to CMS, such as hospital readmissions, falls, pressure ulcers, and improvements in mobility. These measures reflect how well residents' health needs are being managed.
4/5
Florida average: 4.1/5

Nursing care per resident

Info This shows how many total hours of nursing staff time are available per resident each day. Higher numbers usually mean more staff support.
3h 48m per day

This home provides 6% less nursing time per resident than the Florida average.

Florida average: 4h 2m per day

Capacity and availability

Medium-capacity home

Offers a balance of services and community atmosphere.

Total beds 120

This home usually has limited availability

Occupancy is moderate, suggesting balanced demand.

Similar demand to the Florida average
Occupancy rate 93.2%
Residents per day (avg) 103
Occupancy rate
93.2%
Residents per day (avg)
103

Who this home usually serves

TYPE OF STAY

Mix of rehab and long-term care

This home supports both short-term rehab and long-term care, with residents staying for a wide range of durations.

Breakdown by payment type

Medicare

43% of new residents, usually for short-term rehab.

Typical stay 3 - 4 months

Private pay

55% of new residents, often for short stays.

Typical stay 1 - 2 months

Medicaid

2% of new residents, often for long-term daily care.

Typical stay 15 - 16 years

Finances and operations

Privately-owned community
Operated by a partnership between two or more business owners.
Home revenue
$14.7M
Profit
$565.6K
Privately-owned community Operated by a partnership between two or more business owners.
Home revenue
$14,678,137.00
Profit
$565,609.00
Payroll costs Info The portion of the home's budget spent on staff, including nurses, caregivers, and other employees who support care and operations.
$7.1M
48.3% of revenue
Other operating costs Info All remaining costs needed to run the home, such as food, utilities, building maintenance, supplies and administrative expenses.
$7.0M
Total costs $14.1M
Walk Score
Walk Score: 69 / 100
Moderately walkable. Some errands can be accomplished on foot, with a mix of nearby amenities.

What does this home offer?

Housing options icon

Housing Options: 1 Bed / 2 Bed

Building type icon
Building type icon

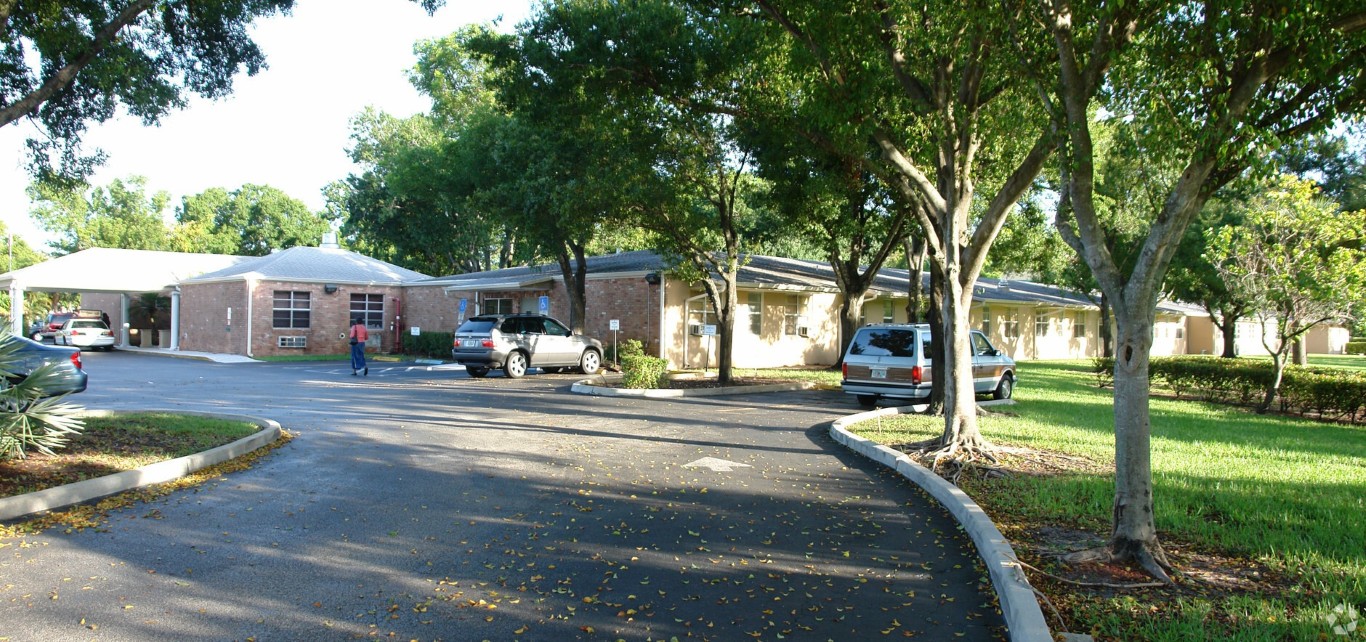
Building Type: Single-story

Dining services icon

Dining Services

Recreational activities icon

Recreational Activities

Types of Care at West Broward Care Center

Nursing Home
Contact West Broward Care Center

Health Inspection History

Inspections
Total health inspections 4

Florida average 4.3


Last Health inspection on Oct 2025

Total health citations 34

Florida average 19.7

Citations per inspection
8.5

Florida average 4.48


Health citations are formal notices following inspections when they fail to comply with safety and care standards.

31 of 34 citations resulted from standard inspections; 2 of 34 resulted from complaint investigations; and 1 of 34 came from combined inspections (standard and complaint).

Breakdown of citation severity (last 3 years)
Critical Health citations More info 0
100% better than Florida average

Florida average: 0.8


Serious Health citations More info 1
150% worse than Florida average

Florida average: 0.4

0 critical citations More info Florida average: 0.8

1 serious citation More info Florida average: 0.4

33 moderate citations More info Florida average: 18.4

0 minor citations More info Florida average: 0.2
Citations history (last 3 years)
Quality of Care moderate citation Info Issues related to how well residents receive appropriate treatment and support for their medical and daily care needs. Oct 08, 2025
Corrected

Quality of Care moderate citation Info Issues related to how well residents receive appropriate treatment and support for their medical and daily care needs. Oct 08, 2025
Corrected

Infection Control moderate citation Info Issues related to preventing and controlling infections, including hygiene practices and safety protocols. May 08, 2025
Corrected

Nutrition moderate citation Info Issues related to food quality, meal service, and resident's nutritional needs. May 08, 2025
Corrected

Compare Nursing Homes around Broward County The information below is reported by the Florida Agency for Health Care Administration (AHCA).

5 facilities compared · CMS & FL Dept. of Health data · Updated Apr 2026

Filter by care type
Covenant Village Care Center
NH

Nursing Home Licensed facility providing 24/7 skilled nursing care for residents with complex, ongoing medical needs. Staffed by RNs, LPNs, and CNAs. Inspected and star-rated annually by CMS. Accepts Medicare (short-term rehab) and Medicaid (long-term care).

Plantation
60
89.7%
+6%
4.38
+85%
+9%
0
13
3.3
0
54
-
17
Buettner, Kathy
$12.6M
$4.1M
32.4%
105604
Studio / 1 Bed / 2 Bed
Memorial Manor
NH

Nursing Home Licensed facility providing 24/7 skilled nursing care for residents with complex, ongoing medical needs. Staffed by RNs, LPNs, and CNAs. Inspected and star-rated annually by CMS. Accepts Medicare (short-term rehab) and Medicaid (long-term care).

Pembroke Pines
120
92.8%
+10%
4.15
+75%
+3%
0
12
3.0
0
110
-
27
South Broward Hospital District
$34.1M
$11.8M
34.6%
105668
Private / Semi-Private Rooms
Life Care Center at Inverrary
NH

Nursing Home Licensed facility providing 24/7 skilled nursing care for residents with complex, ongoing medical needs. Staffed by RNs, LPNs, and CNAs. Inspected and star-rated annually by CMS. Accepts Medicare (short-term rehab) and Medicaid (long-term care).

Lauderhill (Inverrary)
120
89.2%
+6%
4.08
+89%
+1%
0
22
7.3
0
107
A+
12
Brayton, Cody
$20.6M
$6.9M
33.6%
106047
Private / Semi-Private Rooms
Wilton Manors Health and Rehabilitation Center
NH

Nursing Home Licensed facility providing 24/7 skilled nursing care for residents with complex, ongoing medical needs. Staffed by RNs, LPNs, and CNAs. Inspected and star-rated annually by CMS. Accepts Medicare (short-term rehab) and Medicaid (long-term care).

Fort Lauderdale
147
93.5%
+11%
3.59
-19%
-11%
0
27
6.8
1
134
-
86
Wilton Manors Snf Holdco Llc
$21.8M
$8.1M
37%
105119
Private Rooms
West Broward Care Center
NH

Nursing Home Licensed facility providing 24/7 skilled nursing care for residents with complex, ongoing medical needs. Staffed by RNs, LPNs, and CNAs. Inspected and star-rated annually by CMS. Accepts Medicare (short-term rehab) and Medicaid (long-term care).

Plantation
120
93.2%
+11%
3.80
+51%
-6%
1
34
8.5
1
103
-
69
Gottlieb, Micheal
$14.6M
$7.1M
48.4%
105237
1 Bed / 2 Bed

Places of interest near West Broward Care Center

Address 1.6 miles from city center

Address 7751 W Broward Blvd, Plantation, FL 33324

Calculate Travel Distance to West Broward Care Center

Add your location

Address

Staffing Data (Q2 2025)

This data corresponds to Q2 2025 and is based on CMS Payroll-Based Journal.

Total staff 117
Employees 114
Contractors 3
Staff to resident ratio 1.10:1
27% worse than Florida average

Florida average ratio: 1.52:1

Avg staff/day 63
Average shift 7.5 hours
5% worse than Florida average

Florida average: 7.9 hours

Total staff hours (quarter) 43,268
Nursing staff breakdown
Registered Nurse

Manages medical care and health needs.

Total count 21
Average shift length Info Average shift length. Calculated as total hours divided by days worked and average staff per day. 7.4 hours

No contractors work on this role.

Licensed Practical Nurse

Assists with medical care and medications.

Total count 15
Average shift length Info Average shift length. Calculated as total hours divided by days worked and average staff per day. 7.9 hours

No contractors work on this role.

Certified Nursing Assistant

Helps with daily care and mobility.

Total count 51
Average shift length Info Average shift length. Calculated as total hours divided by days worked and average staff per day. 7.8 hours

No contractors work on this role.

Contractor staffing

Total hours from contractors

0.6%

272 contractor hours this quarter

Occupational Therapy Assistant: 1 Physical Therapy Assistant: 1 Medical Director: 1
Staff by category
Certified Nursing Assistant 51 0 51 22,467 91 100% 7.8
Registered Nurse 21 0 21 7,191 91 100% 7.4
Licensed Practical Nurse 15 0 15 4,572 91 100% 7.9
Speech Language Pathologist 4 0 4 1,220 86 95% 6.8
Other Dietary Services Staff 3 0 3 1,017 88 97% 6.9
Physical Therapy Aide 2 0 2 879 65 71% 7.4
Respiratory Therapy Technician 2 0 2 849 63 69% 7.8
RN Director of Nursing 3 0 3 846 69 76% 6.9
Physical Therapy Assistant 3 1 4 625 78 86% 7
Administrator 2 0 2 606 57 63% 7.9
Nurse Practitioner 1 0 1 496 62 68% 8
Dietitian 1 0 1 496 62 68% 8
Dental Services Staff 1 0 1 476 64 70% 7.4
Clinical Nurse Specialist 1 0 1 472 59 65% 8
Mental Health Service Worker 1 0 1 472 59 65% 8
Qualified Social Worker 2 0 2 282 64 70% 4.4
Occupational Therapy Aide 1 0 1 128 23 25% 5.6
Medical Director 0 1 1 96 12 13% 8
Occupational Therapy Assistant 0 1 1 80 14 15% 5.7
51 Certified Nursing Assistant
% of Days 100%
21 Registered Nurse
% of Days 100%
15 Licensed Practical Nurse
% of Days 100%
4 Speech Language Pathologist
% of Days 95%
3 Other Dietary Services Staff
% of Days 97%
2 Physical Therapy Aide
% of Days 71%
2 Respiratory Therapy Technician
% of Days 69%
3 RN Director of Nursing
% of Days 76%
4 Physical Therapy Assistant
% of Days 86%
2 Administrator
% of Days 63%
1 Nurse Practitioner
% of Days 68%
1 Dietitian
% of Days 68%
1 Dental Services Staff
% of Days 70%
1 Clinical Nurse Specialist
% of Days 65%
1 Mental Health Service Worker
% of Days 65%
2 Qualified Social Worker
% of Days 70%
1 Occupational Therapy Aide
% of Days 25%
1 Medical Director
% of Days 13%
1 Occupational Therapy Assistant
% of Days 15%

Facility Characteristics

Source: CMS Long-Term Care Facility Characteristics (Data as of Jan 2026)

Total census
106 residents
Residents by payment source
Medicare
15 residents (14.2%)
Medicaid
72 residents (67.9%)
Private pay or other
19 residents (17.9%)
Programs & Services
Residents' Group

Residents meet regularly to discuss policies, care quality, and activities

Family Member Group

Family members meet regularly to discuss policies, care quality, and activities

Active Family Council

Organized group of family members that meets regularly to discuss facility policies, resident care, and activities.

Active Resident Council

Organized group of residents that meets regularly to discuss facility policies, quality of life, and activities.

Quality of care over time

These measures show how residents usually do over time at this home, based on health outcomes and preventive care.

High-risk clinical events score Info A composite score based on pressure ulcers, falls with injury, weight loss, walking ability decline, and activities of daily living decline. 6.1
18% better than Florida average

Florida average: 7.4

Functional decline score Info A composite score based on activities of daily living decline, walking ability decline, and incontinence. 8.1
35% better than Florida average

Florida average: 12.4

Long-stay resident measures
Need for Help with Daily Activities Increased Info Percent of long-stay residents whose need for help with daily activities has increased 6.9%
34% better than Florida average

Florida average: 10.5%

Walking Ability Worsened Info Percent of long-stay residents whose ability to move independently worsened 10.4%
20% better than Florida average

Florida average: 12.9%

Low Risk Residents with Bowel/Bladder Incontinence Info Percent of low risk long-stay residents who lose control of their bowels or bladder 6.8%
50% better than Florida average

Florida average: 13.5%

Falls with Major Injury Info Percent of long-stay residents experiencing one or more falls with major injury 0.0%
100% better than Florida average

Florida average: 2.6%

High Risk Residents with Pressure Ulcers Info Percent of long-stay high risk residents with pressure ulcers 4.9%
9% better than Florida average

Florida average: 5.4%

Urinary Tract Infection Info Percent of long-stay residents with a urinary tract infection 0.3%
71% better than Florida average

Florida average: 0.9%

Lost Too Much Weight Info Percent of long-stay residents who lose too much weight 8.1%
35% worse than Florida average

Florida average: 6.0%

Depressive Symptoms Info Percent of long-stay residents who have depressive symptoms 0.0%
100% better than Florida average

Florida average: 3.3%

Antipsychotic Use Info Percent of long-stay residents who received an antipsychotic medication 9.1%
13% worse than Florida average

Florida average: 8.0%

Pneumococcal Vaccine Info Percent of long-stay residents assessed and appropriately given the pneumococcal vaccine 100.0%
In line with Florida average

Florida average: 97.7%

Influenza Vaccine Info Percent of long-stay residents assessed and appropriately given the seasonal influenza vaccine 100.0%
In line with Florida average

Florida average: 99.2%

Short-stay resident measures
Pneumococcal Vaccine Info Percent of short-stay residents assessed and appropriately given the pneumococcal vaccine 100.0%
6% better than Florida average

Florida average: 94.0%

Antipsychotic medication increase Info Percent of short-stay residents who newly received an antipsychotic medication 6.5%
328% worse than Florida average

Florida average: 1.5%

Influenza Vaccine Info Percent of short-stay residents assessed and appropriately given the seasonal influenza vaccine 100.0%
6% better than Florida average

Florida average: 94.7%

Penalties and fines

Federal penalties imposed by CMS for regulatory violations, including civil money penalties (fines) and denials of payment for new Medicare/Medicaid admissions.

Source: CMS Penalties Database (Data as of Jan 2026)

Total fines amount $52K
28% lower than Florida average

Florida average: $72K

Number of fines 1
62% fewer fines than Florida average

Florida average: 2.6

Payment Denials Info Serious action where Medicare and/or Medicaid temporarily stops payments for new residents until issues are fixed. 0
100% fewer payment denials than Florida average

Florida average: 0.1

Fines amount comparison
This facility $52K
Florida average $72K
Penalty History

Penalties are imposed by CMS for violations of federal nursing home regulations.

Civil Money Penalty Info Fines imposed for noncompliance, which can be assessed per day or per instance of violation. May 8, 2025
$52K

Last updated: Jan 2026

Guides for Better Senior Living

Care Cost Calculator: See Prices in Your Area

Nursing Home Data Explorer

Don’t Wait Too Long: 7 Red Flag Signs Your Parent Needs Assisted Living Now

The True Cost of Assisted Living in 2025 – And How Families Are Paying For It

Understanding Senior Living Costs: Pricing Models, Discounts & Financial Assistance

Financial Aid for Florida Seniors

Get financial aid guidance

Long-Term Care Waiver

Florida Medicaid LTC Waiver

Age 65+ or 21+ disabled, Florida resident, Medicaid- eligible, nursing home-level care need.

~$2,829/month (300% FBR, individual).

$2,000 (individual), $3,000 (couple).

High demand; waitlists common.

Community Care for the Elderly (CCE)

Florida CCE

Age 60+, Florida resident, at risk of nursing home.

~$2,000/month (varies).

$5,000 (individual).

Limited funding; regional variation.

Home Care for the Elderly (HCE)

Florida Home Care for the Elderly

Age 60+, Florida resident, at risk of nursing home placement; caregiver must be approved.

~$2,829/month (individual, aligned with Medicaid thresholds).

~$2,000 (individual); varies by case manager discretion.

Limited funding (~3,500 served annually); prioritizes low-income frail seniors.

Program of All-Inclusive Care for the Elderly (PACE)

Florida Medicaid PACE

Age 55+, Florida resident, nursing home-level care need, safe with PACE support.

~$2,829/month (300% FBR).

$2,000 (individual), $3,000 (couple).

Limited to specific counties (e.g., Hillsborough, Miami-Dade); ~10 sites statewide.

Optional State Supplementation (OSS)

Florida Optional State Supplementation

Age 65+ or disabled, Florida resident, living in approved facility, receiving SSI or low-income.

~$1,004/month (individual, including SSI).

$2,000 (individual), $3,000 (couple).

Limited to specific facility types; ~$78.40/month max supplement.

Senior Community Service Employment Program (SCSEP)

Florida SCSEP (federally funded, state-administered)

Age 55+, unemployed, low-income, Florida resident.

~$1,983/month (125% FPL, individual).

Not specified; income-focused.

Priority for veterans, rural residents; ~1,000 slots/year.

Tour Icon
Planning a tour? Check our touring checklist.
Chat Icon
Thinking of living here? We can help you speak to a current resident