Covenant Village Care Center

Nursing Home in Broward County

CMS overall rating Info The Overall CMS Rating is scored from 1 to 5 stars and combines results from health inspections, staffing levels, and quality measures. Health inspections carry the most weight. Staffing and quality scores can increase or decrease the final rating based on performance compared to state and national standards.

Overview of Covenant Village Care Center

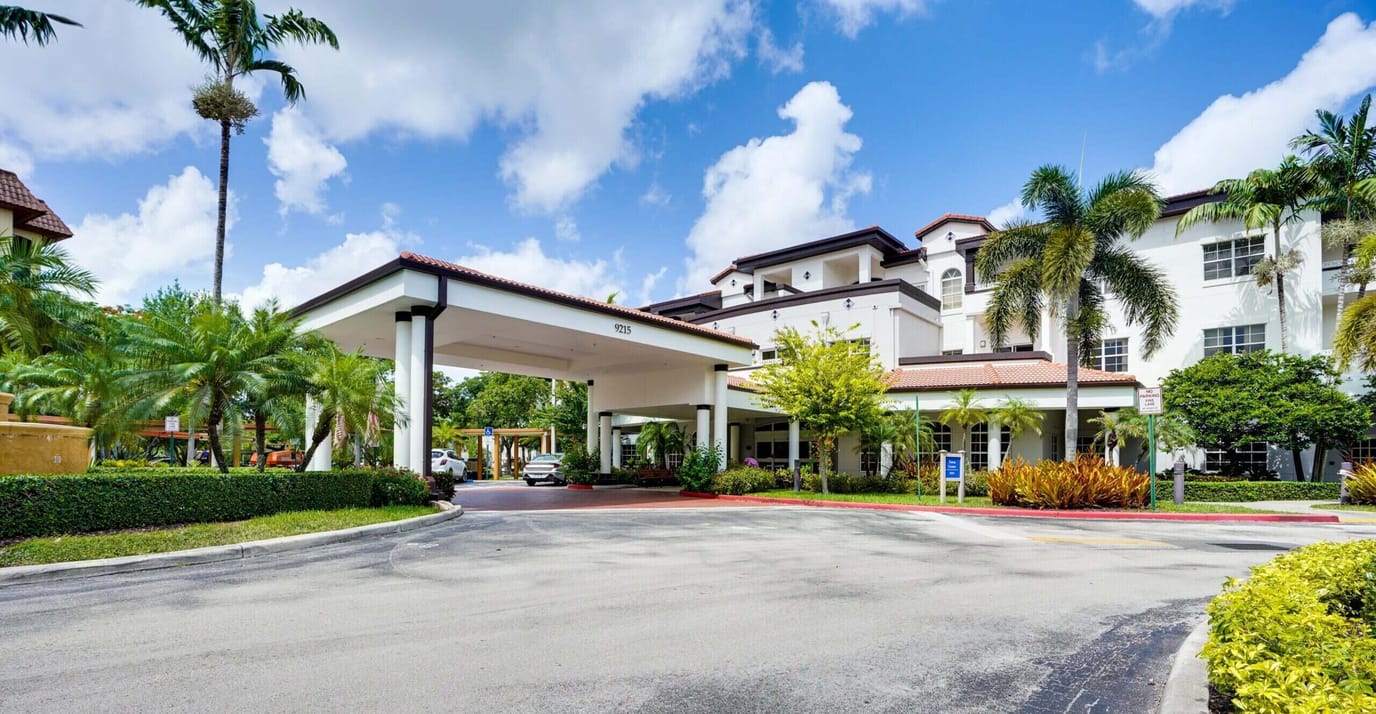
Set near HCA Florida Westside Hospital and Plantation Central Park in Plantation, FL, Covenant Village Care Center is a distinguished community that offers long-term care, respite care, and hospice. The community is committed to improving residents’ wellness, providing top-notch care and assistance around the clock, alongside cozy and purposely designed amenities to ensure their comfort and safety. Medicare is also accepted to ease residents’ financial burdens.

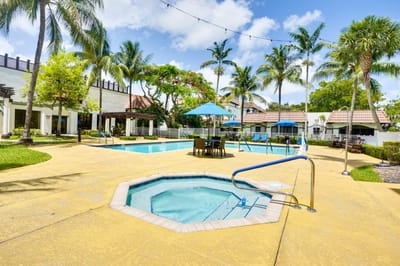
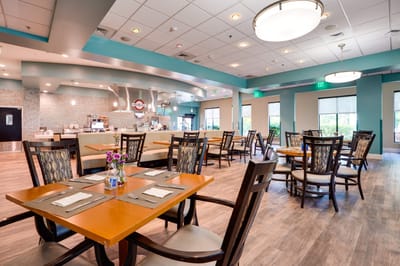
Elevate retirement with stimulating activities and enriching programs to keep residents active and socially engaged. Three delicious and healthy meals are also served to meet residents’ dietary needs and tastes. The community also provides diabetes management, pain management, rehabilitation services, and wound care to meet residents’ healthcare needs. Here, residents live their golden years with ease knowing a trusted community is available to meet their needs.

(954) 370-8982

Quality ratings

Measured by Centers for Medicare & Medicaid Services (CMS)

Overall rating Info The Overall CMS Rating combines results from health inspections, staffing levels and quality measures. Health inspections carry the most weight. Staffing and quality scores can increase or decrease the final rating based on performance compared to state and national standards.
5/5 ▲ 1.8 Florida average: 3.2/5
Health Inspection Info Based on the results of the facility's three most recent standard inspections and any complaint investigations. CMS reviews the number, scope, and severity of deficiencies, with more recent findings weighted more heavily.
4/5 ▲ 1.2 Florida average: 2.8/5
Staffing Info Measures average nursing staff hours per resident per day, including Registered Nurses (RNs) and total nursing staff. Ratings are adjusted based on the level of care residents require and are compared to state and national benchmarks.
5/5 ▲ 1.6 Florida average: 3.4/5
Quality Measures Info Based on clinical and physical health indicators reported to CMS, such as hospital readmissions, falls, pressure ulcers, and improvements in mobility. These measures reflect how well residents' health needs are being managed.
4/5 ▼ 0.1 Florida average: 4.1/5

Staffing hours breakdown

Info Daily nursing hours per resident by staff type, reported to CMS. Higher is generally better — compare this facility to state and national averages to see where staffing stands.

Hours per resident per day — compared to Florida state averages

Total nursing care / resident Info This home is ranked 51st out of 175 homes in Florida.

Total adjusted nursing hours per resident per day, combining RN, LPN, and aide time. CMS adjusts this for case-mix so facilities can be fairly compared.
4h 23m per day
Rank #51 / 175Nurse hours — state benchmarkedThis home is ranked 51st out of 175 homes in Florida.Shows adjusted nurse hours per resident per day benchmarked to the Florida average, with a ranking across 175 Florida SNFs. More hours mean more direct care. The national average is about 3.5 hrs; below 3.0 is a red flag.
This facility Florida avg (4h 2m per day)
vs Florida avg
+9%

1 of 6 metrics below state avg

Standout metric Physical Therapist is +120% above state avg
Staff typeHours / dayvs state avg
Registered Nurse (RN) Info RNs hold the highest nursing license and can assess residents, interpret test results, and direct care plans. More RN hours per day often signals stronger clinical oversight and faster response to health changes. 1h 19m per day ▲ 80% State avg: 44m per day · National avg: 41m per day
LPN / LVN Info Licensed Practical Nurses (LPNs) or Licensed Vocational Nurses (LVNs) deliver routine hands-on care — medication administration, wound dressing, and monitoring vital signs. They work under RN supervision and make up a large share of daily bedside care. 15m per day ▼ 68% State avg: 47m per day · National avg: 52m per day
Nurse Aide Info Certified Nurse Aides (CNAs) provide the most direct day-to-day assistance: bathing, dressing, feeding, and mobility. Nurse aide hours are typically the largest staffing category and directly affect residents' quality of life. 2h 37m per day ▲ 12% State avg: 2h 20m per day · National avg: 2h 21m per day
Total Nursing (Weekend) Info Combined nursing hours (RN + LPN + Nurse Aide) per resident per day on weekends. Staffing often drops on weekends — this figure reveals whether the facility maintains adequate coverage outside of weekday hours. 4h 2m per day ▲ 15% State avg: 3h 31m per day · National avg: 3h 26m per day
Physical Therapist Info Hours per resident per day provided by licensed Physical Therapists (PTs) or PT Assistants. PT services help residents recover mobility after injury or illness and are especially important for post-acute (short-stay) rehabilitation. 11m per day ▲ 120% State avg: 5m per day · National avg: 4m per day
RN (Weekend) Info Registered nurse hours specifically on weekends. Facilities sometimes reduce RN presence on Saturdays and Sundays — a low weekend RN figure compared to weekday hours can indicate reduced clinical oversight when most administrative staff are absent. 1h 5m per day ▲ 103% State avg: 32m per day · National avg: 29m per day

Capacity and availability

This home usually has limited availability

Occupancy between 85% and 95% suggests balanced demand.

Higher occupancy than the Florida average: 84.3%
Occupancy rate 89.7% Rank #79 / 176Occupancy rate — state benchmarkedThis home is ranked 79th out of 176 homes in Florida.Shows this facility's occupancy rate versus the Florida average, with its statewide rank out of 176. Higher occupancy signals strong local demand and financial stability.
Avg. Length of Stay 108 days
Occupancy rate
89.7% Rank #79 / 176Occupancy rate — state benchmarkedThis home is ranked 79th out of 176 homes in Florida.Shows this facility's occupancy rate versus the Florida average, with its statewide rank out of 176. Higher occupancy signals strong local demand and financial stability.
Avg. Length of Stay
108 days

Finances and operations

Voluntary non-profit community
Home revenue
$12.7M
Operating deficit
-$1.2M
Voluntary non-profit community
Home revenue
$12.7M Rank #121 / 177Revenue — state benchmarkedThis home is ranked 121st out of 177 homes in Florida.Shows this facility's annual revenue compared to the Florida SNF average. Higher revenue generally means more resources for staffing and capital — read alongside Payroll %.
Operating deficit
-$1.2M
Payroll costs Info The portion of the home's budget spent on staff, including nurses, caregivers, and other employees who support care and operations. Rank #142 / 177Payroll — state benchmarkedThis home is ranked 142nd out of 177 homes in Florida.Shows total annual staff payroll benchmarked to the Florida average. Higher payroll investment relative to peers often signals better staffing and less reliance on cheaper contract labor.
$4.1M
32.1% of revenue Rank #140 / 177Payroll % — state benchmarkedThis home is ranked 140th out of 177 homes in Florida.Shows payroll as a percentage of revenue versus the Florida average. Well-run SNFs often land around 55–65%. Below 25% may signal understaffing or heavy agency use — read with Staffing ratings.
Other operating costs Info All remaining costs needed to run the home, such as food, utilities, building maintenance, supplies and administrative expenses.
$9.9M
Total costs $13.9M
Walk Score
Walk Score: 17 / 100 Rank #119 / 147Walk Score — state benchmarkedThis home is ranked 119th out of 147 homes in Florida.Shows how walkable this facility's neighborhood is compared to the average Walk Score across Florida SNFs. Higher scores benefit residents, families, and staff.
Car-dependent. Most errands require a car, with limited nearby walkable options.

What does this home offer?

Housing options icon

Housing Options: Studio / 1 Bed / 2 Bed

Building type icon
Building type icon

Building Type: 3-story

Dining services icon

Dining Services

Recreational activities icon

Recreational Activities

Exercise program icon

Exercise Programs

Types of Care at Covenant Village Care Center

Nursing Home

Contact Covenant Village Care Center

Health Inspection History

Inspections
Total health inspections 4

Florida average 4.3


Last Health inspection on May 2025

Total health citations
13 Rank #57 / 177Health citations — state benchmarkedThis home is ranked 57th out of 177 homes in Florida.Shows this facility's total health deficiency citations benchmarked to the Florida state average, with a ranking across all 177 FL SNFs. Lower citation counts earn a better rank.

Florida average 19.7

Citations per inspection
3.25

Florida average 4.48


Health citations are formal notices following inspections when they fail to comply with safety and care standards.

12 of 13 citations resulted from standard inspections; and 1 of 13 resulted from complaint investigations.

Breakdown of citation severity (last 3 years)
Critical Health citations More info
0
100% better than Florida average

Florida average: 0.8


Serious Health citations More info 0
100% better than Florida average

Florida average: 0.4

0 critical citations More info Florida average: 0.8

0 serious citations More info Florida average: 0.4

13 moderate citations More info Florida average: 18.4

0 minor citations More info Florida average: 0.2
Citations history (last 3 years)
Pharmacy moderate citation Info Issues related to medication management, including how drugs are stored, administered, and monitored. May 15, 2025
Corrected

Pharmacy moderate citation Info Issues related to medication management, including how drugs are stored, administered, and monitored. May 15, 2025
Corrected

Pharmacy moderate citation Info Issues related to medication management, including how drugs are stored, administered, and monitored. May 15, 2025
Corrected

Pharmacy moderate citation Info Issues related to medication management, including how drugs are stored, administered, and monitored. May 15, 2025
Corrected

Compare Nursing Homes around Broward County The information below is reported by the Florida Agency for Health Care Administration (AHCA).

5 facilities compared · CMS & FL Dept. of Health data · Updated Apr 2026

Filter by care type
Covenant Village Care Center
NH

Nursing Home Licensed facility providing 24/7 skilled nursing care for residents with complex, ongoing medical needs. Staffed by RNs, LPNs, and CNAs. Inspected and star-rated annually by CMS. Accepts Medicare (short-term rehab) and Medicaid (long-term care).

Plantation (West Broward Boulevard)60 89.7% +6%4.38 +85%+9%0133.3054- 17 Buettner, Kathy$12.7M$4.1M32.1%105604
Memorial Manor
NH

Nursing Home Licensed facility providing 24/7 skilled nursing care for residents with complex, ongoing medical needs. Staffed by RNs, LPNs, and CNAs. Inspected and star-rated annually by CMS. Accepts Medicare (short-term rehab) and Medicaid (long-term care).

Pembroke Pines120 92.8% +10%4.15 +75%+3%0123.00110- 27 South Broward Hospital District$34.1M$11.8M34.6%105668
Life Care Center at Inverrary
NH

Nursing Home Licensed facility providing 24/7 skilled nursing care for residents with complex, ongoing medical needs. Staffed by RNs, LPNs, and CNAs. Inspected and star-rated annually by CMS. Accepts Medicare (short-term rehab) and Medicaid (long-term care).

Lauderhill (Inverrary)120 89.2% +6%4.08 +89%+1%0227.30107A+ 12 Brayton, Cody$20.9M$6.9M33.1%106047
Wilton Manors Health and Rehabilitation Center
NH

Nursing Home Licensed facility providing 24/7 skilled nursing care for residents with complex, ongoing medical needs. Staffed by RNs, LPNs, and CNAs. Inspected and star-rated annually by CMS. Accepts Medicare (short-term rehab) and Medicaid (long-term care).

Fort Lauderdale147 93.5% +11%3.59 -19%-11%0276.81134- 86 Wilton Manors Snf Holdco Llc$21.8M$8.1M36.9%105119
West Broward Care Center
NH

Nursing Home Licensed facility providing 24/7 skilled nursing care for residents with complex, ongoing medical needs. Staffed by RNs, LPNs, and CNAs. Inspected and star-rated annually by CMS. Accepts Medicare (short-term rehab) and Medicaid (long-term care).

Plantation120 93.2% +11%3.80 +51%-6%1348.51103- 69 Gottlieb, Micheal$14.7M$7.1M48.3%105237

Financial Assistance for
Nursing Home in Florida

Get Financial aid guidance

Long-Term Care Waiver

Florida Medicaid LTC Waiver

Age 65+ or 21+ disabled
General Florida resident, Medicaid- eligible, nursing home-level care need.
Income Limits (2025) ~$2,829/month 300% FBR, individual
Asset Limits $2,000 (individual), $3,000 (couple).
FL

High demand; waitlists common.

Benefits
In-home care (6-8 hours/day) Assisted living Respite (240 hours/year) Case management

Community Care for the Elderly (CCE)

Florida CCE

Age 60+
General Florida resident, at risk of nursing home.
Income Limits ~$2,000/month varies
Asset Limits $5,000 individual
FL

Limited funding; regional variation.

Benefits
Homemaker services (3-5 hours/week) Adult day care (~$60/day) Respite (up to 10 days/year)

Home Care for the Elderly (HCE)

Florida Home Care for the Elderly

Age 60+
General Florida resident, at risk of nursing home placement; caregiver must be approved.
Income Limits (2025) ~$2,829/month individual, aligned with Medicaid thresholds
Asset Limits ~$2,000 (individual); varies by case manager discretion.
FL

Limited funding (~3,500 served annually); prioritizes low-income frail seniors.

Benefits
Basic subsidy (~$160/month) for housing/medical costs; special subsidies for supplies/services (e.g., incontinence supplies, ~$50-$200/month)

Program of All-Inclusive Care for the Elderly (PACE)

Florida Medicaid PACE

Age 55+
General Florida resident, nursing home-level care need, safe with PACE support.
Income Limits (2025) ~$2,829/month 300% FBR
Asset Limits $2,000 (individual), $3,000 (couple).
FL

Limited to specific counties (e.g., Hillsborough, Miami-Dade); ~10 sites statewide.

Benefits
Personal care (5-7 hours/day) Medical care Meals Transportation Therapy

Optional State Supplementation (OSS)

Florida Optional State Supplementation

Age 65+ or disabled
General Florida resident, living in approved facility, receiving SSI or low-income.
Income Limits (2025) ~$1,004/month individual, including SSI
Asset Limits $2,000 (individual), $3,000 (couple).
FL

Limited to specific facility types; ~$78.40/month max supplement.

Benefits
Cash payment (~$78.40/month) for room/board or personal needs in facilities

Senior Community Service Employment Program (SCSEP)

Florida SCSEP (federally funded, state-administered)

Age 55+
General unemployed, low-income, Florida resident.
Income Limits (2025) ~$1,983/month 125% FPL, individual
Asset Limits Not specified; income-focused.
FL

Priority for veterans, rural residents; ~1,000 slots/year.

Benefits
Paid training (~20 hours/week at ~$7.25/hour) Job placement

Places of interest near Covenant Village Care Center

Address 3.1 miles from city center Info Estimated distance in miles from Plantation's city center to Covenant Village Care Center's address, calculated via Google Maps.

Calculate Travel Distance to Covenant Village Care Center

Add your location

Address

Staffing Data (Q2 2025)

This data corresponds to Q2 2025 and is based on CMS Payroll-Based Journal.

Total staff 100
Employees 71
Contractors 29
Staff to resident ratio 2.00:1
32% better than Florida average

Florida average ratio: 1.52:1

Avg staff/day 41
Average shift 7.5 hours
5% worse than Florida average

Florida average: 7.9 hours

Total staff hours (quarter) 27,973
Nursing staff breakdown
Registered Nurse

Manages medical care and health needs.

Total count 22
Average shift length Info Average shift length. Calculated as total hours divided by days worked and average staff per day. 9 hours

This role is partially covered by contractors.

Licensed Practical Nurse

Assists with medical care and medications.

Total count 4
Average shift length Info Average shift length. Calculated as total hours divided by days worked and average staff per day. 9.5 hours

This role is partially covered by contractors.

Certified Nursing Assistant

Helps with daily care and mobility.

Total count 36
Average shift length Info Average shift length. Calculated as total hours divided by days worked and average staff per day. 7.7 hours

No contractors work on this role.

Contractor staffing

Total hours from contractors

17%

4,759 contractor hours this quarter

Physical Therapy Aide: 6 Respiratory Therapy Technician: 6 Speech Language Pathologist: 5 Physical Therapy Assistant: 4 Occupational Therapy Aide: 2 Registered Nurse: 2 Licensed Practical Nurse: 1 Qualified Social Worker: 1 Occupational Therapy Assistant: 1 Medical Director: 1
Staff by category
Certified Nursing Assistant3603613,15491100%7.7
Registered Nurse202224,85091100%9
Clinical Nurse Specialist5051,5348290%6.3
Licensed Practical Nurse3141,2778897%9.5
Speech Language Pathologist0551,1037684%5.4
Physical Therapy Aide0669768189%6.7
Respiratory Therapy Technician0669038088%6.2
Physical Therapy Assistant0447547785%6
Mental Health Service Worker3035376673%5.8
Occupational Therapy Aide0225216571%7.8
Other Dietary Services Staff1015216470%8.1
Dietitian1015106976%7.4
Qualified Social Worker0114446470%6.9
Administrator1014325459%8
Nurse Practitioner1014245358%8
Occupational Therapy Assistant0113178%4.4
Medical Director011433%1.2
36 Certified Nursing Assistant
% of Days 100%
22 Registered Nurse
% of Days 100%
5 Clinical Nurse Specialist
% of Days 90%
4 Licensed Practical Nurse
% of Days 97%
5 Speech Language Pathologist
% of Days 84%
6 Physical Therapy Aide
% of Days 89%
6 Respiratory Therapy Technician
% of Days 88%
4 Physical Therapy Assistant
% of Days 85%
3 Mental Health Service Worker
% of Days 73%
2 Occupational Therapy Aide
% of Days 71%
1 Other Dietary Services Staff
% of Days 70%
1 Dietitian
% of Days 76%
1 Qualified Social Worker
% of Days 70%
1 Administrator
% of Days 59%
1 Nurse Practitioner
% of Days 58%
1 Occupational Therapy Assistant
% of Days 8%
1 Medical Director
% of Days 3%

Facility Characteristics

Source: CMS Long-Term Care Facility Characteristics (Data as of Jan 2026)

Total residents 50
Medicare
12
24% of residents
Medicaid
12
24% of residents
Private pay or other
26
52% of residents
Programs & Services
Residents Group

Residents meet regularly to discuss policies, care quality, and activities

CCRC

Part of a Continuing Care Retirement Community offering multiple care levels

Active Resident Council

Organized group of residents that meets regularly to discuss facility policies, quality of life, and activities.

Quality of care over time

These measures show how residents usually do over time at this home, based on health outcomes and preventive care.

High-risk clinical events score Info A composite score based on pressure ulcers, falls with injury, weight loss, walking ability decline, and activities of daily living decline. 1.6
78% better than Florida average

Florida average: 7.4

Functional decline score Info A composite score based on activities of daily living decline, walking ability decline, and incontinence. 3.0
76% better than Florida average

Florida average: 12.4

Long-stay resident measures
Significantly above average Florida avg: 4.5 Info CMS star rating based on long-stay quality measure performance. 5 stars = significantly above average, 1 star = significantly below average.
Need for Help with Daily Activities Increased Info Percent of long-stay residents whose need for help with daily activities has increased 2.5%
76% better than Florida average

Florida average: 10.5%

Low Risk Residents with Bowel/Bladder Incontinence Info Percent of low risk long-stay residents who lose control of their bowels or bladder 3.5%
75% better than Florida average

Florida average: 13.5%

Falls with Major Injury Info Percent of long-stay residents experiencing one or more falls with major injury 1.4%
48% better than Florida average

Florida average: 2.6%

High Risk Residents with Pressure Ulcers Info Percent of long-stay high risk residents with pressure ulcers 2.7%
50% better than Florida average

Florida average: 5.4%

Urinary Tract Infection Info Percent of long-stay residents with a urinary tract infection 0.0%
100% better than Florida average

Florida average: 0.9%

Lost Too Much Weight Info Percent of long-stay residents who lose too much weight 0.0%
100% better than Florida average

Florida average: 6.0%

Depressive Symptoms Info Percent of long-stay residents who have depressive symptoms 0.0%
100% better than Florida average

Florida average: 3.3%

Antipsychotic Use Info Percent of long-stay residents who received an antipsychotic medication 6.9%
15% better than Florida average

Florida average: 8.0%

Pneumococcal Vaccine Info Percent of long-stay residents assessed and appropriately given the pneumococcal vaccine 100.0%
In line with Florida average

Florida average: 97.7%

Short-stay resident measures
Below average Florida avg: 3.1 Info CMS star rating based on short-stay quality measure performance. 5 stars = much above average, 1 star = much below average.
Pneumococcal Vaccine Info Percent of short-stay residents assessed and appropriately given the pneumococcal vaccine 99.8%
6% better than Florida average

Florida average: 94.0%

Antipsychotic medication increase Info Percent of short-stay residents who newly received an antipsychotic medication 0.9%
40% better than Florida average

Florida average: 1.5%

Influenza Vaccine Info Percent of short-stay residents assessed and appropriately given the seasonal influenza vaccine 96.7%
In line with Florida average

Florida average: 94.7%

Re-hospitalized after SNF stay Info Percentage of short-stay residents who were re-hospitalized after their nursing home admission. 31.7%
21% worse than Florida average

Florida average: 26.2%

Emergency department visits Info Percentage of short-stay residents who had an outpatient emergency department visit. 9.1%
In line with Florida average

Florida average: 9.3%

Falls with major injury Info Percentage of SNF residents who experience falls with major injury during their stay. 0.5%
34% better than Florida average

Florida average: 0.8%

Ability to care for self at discharge Info Percentage of residents at or above expected ability to care for themselves at discharge. 28.6%
47% worse than Florida average

Florida average: 53.7%

Successful return to home or community Info Rate of successful return to home or community from a skilled nursing facility. 54.5%
8% better than Florida average

Florida average: 50.6%

Guides for Better Senior Living

Care Cost Calculator: See Prices in Your Area

Nursing Home Data Explorer

Don’t Wait Too Long: 7 Red Flag Signs Your Parent Needs Assisted Living Now

The True Cost of Assisted Living in 2025 – And How Families Are Paying For It

Understanding Senior Living Costs: Pricing Models, Discounts & Financial Assistance

Tour Icon
Planning a tour? Check our touring checklist.
Chat Icon
Thinking of living here? We can help you speak to a current resident
Explore Open Rooms
1 Contact details
2 What type of senior care service are you looking for?
3 What budget do you have in mind for senior care?
4 How soon do you need to find care?
5 Additional details

Thank you for your interest!

Our team will be in touch shortly to help with next steps.