


Total staff
177
Employees
170
Contractors
7
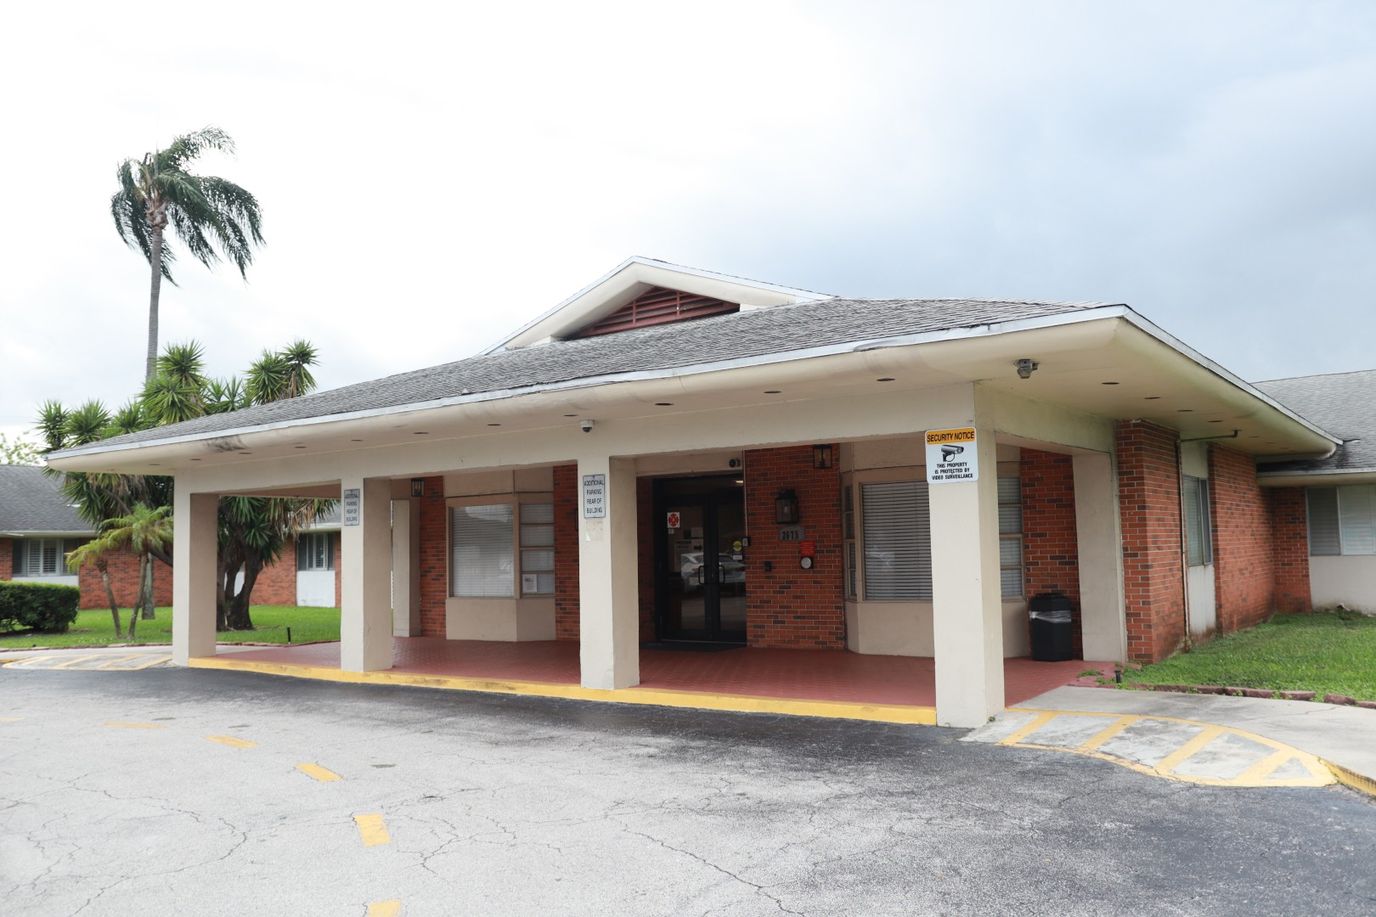
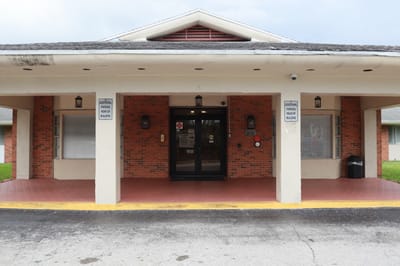
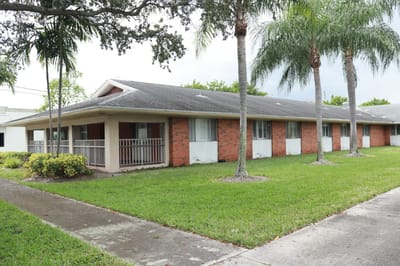
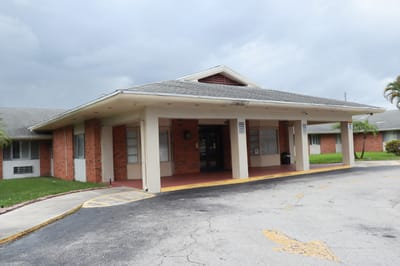
Wilton Manors Health and Rehabilitation Center is an astounding community located in the charming neighborhood of Wilton Manors, FL, that offers skilled nursing services. With comprehensive care, including ostomy care, post-surgical care, and pain management, residents can rest assured of finding the care and assistance they need to live comfortably in their golden years. The community also provides round-the-clock care from a compassionate and well-trained team to ensure their comfort and safety.
Aside from their healthcare needs, residents are guaranteed to enjoy every moment with a jam-packed calendar of fun activities and engaging programs tailored to their leisure. Pharmacy, laboratory, and radiology services, psychiatry, psychology, and hemodialysis are also provided to ensure residents receive the right care for their every need. The community is great for those looking to find all the care they need in one place, especially with its comprehensive care.
| Staff type | Hours / Day / Resident | vs state avg |
|---|---|---|
|
Registered Nurse (RN)
| 39m per day | ▼ 12% State avg: 44m per day · National avg: 41m per day |
|
LPN / LVN
| 54m per day | ▲ 14% State avg: 47m per day · National avg: 52m per day |
|
Nurse Aide
| 2h 37m per day | ▲ 12% State avg: 2h 20m per day · National avg: 2h 21m per day |
|
Weekend Total Nursing
| 3h 47m per day | ▲ 7% State avg: 3h 31m per day · National avg: 3h 26m per day |
|
Physical Therapist
| 6m per day | ▲ 11% State avg: 5m per day · National avg: 4m per day |
|
Weekend RN
| 28m per day | ▼ 11% State avg: 32m per day · National avg: 29m per day |
Reporting period: October 1 – December 31, 2025 (Q4 2025). Source: CMS Payroll-Based Journal report.
Manages medical care and health needs.
Assists with medical care and medications.
Helps with daily care and mobility.
Total hours from contractors
1,380 contractor hours this quarter
| Certified Nursing Assistant | 80 | 1 | 81 | 32,830 | 92 | 100% | 7.9 |
| Licensed Practical Nurse | 24 | 4 | 28 | 10,722 | 92 | 100% | 9.6 |
| Registered Nurse | 20 | 1 | 21 | 5,697 | 92 | 100% | 9.3 |
| Speech Language Pathologist | 9 | 0 | 9 | 2,170 | 91 | 99% | 7.5 |
| Physical Therapy Aide | 8 | 0 | 8 | 2,018 | 90 | 98% | 7.3 |
| Clinical Nurse Specialist | 6 | 0 | 6 | 1,932 | 76 | 83% | 8.1 |
| Respiratory Therapy Technician | 4 | 0 | 4 | 1,166 | 78 | 85% | 7.2 |
| Mental Health Service Worker | 3 | 0 | 3 | 1,081 | 66 | 72% | 7.8 |
| Dietitian | 4 | 0 | 4 | 1,040 | 90 | 98% | 7.4 |
| Physical Therapy Assistant | 4 | 0 | 4 | 851 | 73 | 79% | 7.5 |
| Qualified Social Worker | 3 | 0 | 3 | 708 | 84 | 91% | 5 |
| RN Director of Nursing | 3 | 0 | 3 | 551 | 58 | 63% | 8 |
| Administrator | 1 | 0 | 1 | 528 | 66 | 72% | 8 |
| Nurse Practitioner | 1 | 0 | 1 | 528 | 66 | 72% | 8 |
| Medical Director | 0 | 1 | 1 | 40 | 26 | 28% | 1.5 |
Federal penalties imposed by CMS for regulatory violations, including civil money penalties (fines) and denials of payment for new Medicare/Medicaid admissions.
Source: CMS Penalties Database
No penalties in the past 3 years
No civil money penalties or payment denials were reported in the last 3 years.
These measures show how residents usually do over time at this home, based on health outcomes and preventive care.
Florida average: 7.4
Florida average: 12.4
Florida average: 10.5%
Florida average: 12.9%
Florida average: 13.5%
Florida average: 2.6%
Florida average: 5.4%
Florida average: 0.9%
Florida average: 6.0%
Florida average: 3.3%
Florida average: 8.0%
Florida average: 97.7%
Florida average: 99.2%
Florida average: 2.10
Florida average: 1.18
Florida average: 94.0%
Florida average: 1.5%
Florida average: 94.7%
Florida average: 26.2%
Florida average: 9.3%
Florida average: 0.8%
Florida average: 53.7%
Florida average: 50.6%
Quality measures are calculated from Minimum Data Set (MDS) assessments. For most measures, lower percentages indicate better care quality.
22% of new residents, usually for short-term rehab.
73% of new residents, often for short stays.
5% of new residents, often for long-term daily care.
Source: CMS Long-Term Care Facility Characteristics (Data as of Jan 2026)
Residents meet regularly to discuss policies, care quality, and activities
Organized group of residents that meets regularly to discuss facility policies, quality of life, and activities.
Data sourced from CMS Long-Term Care Facility Characteristics quarterly report. Payer mix reflects the current resident census by primary payment source.
Historical financial and operational data for Wilton Manors Health and Rehabilitation Center from 2011–2023, based on CMS SNF Cost Reports.
Key figures below are for fiscal year ending in 12/2023.
Based on CMS SNF Cost Report for fiscal year ending in 12/2023.
No pets allowed
Housing Options: Private Rooms
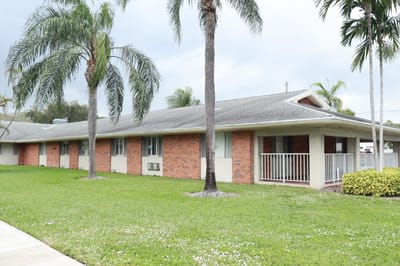
Building Type: Single-story
Beauty Services
Housekeeping Services
Recreational Activities
Exercise Programs
Residents typically stay for brief periods, with frequent admissions and discharges throughout the year.
Most new residents arrive under private pay (73% of admissions), and a typical private pay stay runs around 29 days.
Coverage residents most often arrive under.
Coverage residents most often leave under.
Maria Albury serves as the Executive Director at Wilton Manors Health and Rehabilitation Center. She leads a dedicated team providing professional and compassionate care, ensuring residents receive exceptional support throughout their recovery and stay. Her leadership is recognized by families for fostering a clean, bright, and highly professional environment that expedites patient recovery and supports their future plans.
![]() 3.1 miles from city center
3.1 miles from city center
![]() Estimated distance in miles from Fort Lauderdale's city center to Wilton Manors Health and Rehabilitation Center's address, calculated via Google Maps.
Estimated distance in miles from Fort Lauderdale's city center to Wilton Manors Health and Rehabilitation Center's address, calculated via Google Maps.
Add your location
Info below is compiled from CMS reports & the FL Agency for Health Care Administration (AHCA), senior community websites & trusted data sources such as Walk Score & BBB.
Communities are listed from highest to lowest based on our ranking methodology.
| Memorial Manor | NH SNF | Pembroke Pines | 120
Facility
120
FL AVG
88
Rank
#253 / 1058 |
88.8%
Facility
88.8%
FL AVG
84.4
Rank
#72 / 125 | +5% | 4.15
Facility
4.15
FL AVG
4.04
Rank
#60 / 181 | +75% | +3% | $0
Facility
$0
FL AVG
$78.9k
Rank
#1 / 185 | - | 12
Facility
12
FL AVG
19.7
Rank
#50 / 181 | 3.0
Facility
3.0
FL AVG
4.5
Rank
#39 / 181 | - | 107 | - |
27
Facility
27
FL AVG
40
Rank
#955 / 1487 | South Broward Hospital District | $12.9MFiscal year ending 04/2024
Facility
$12.9MFiscal year ending 04/2024
FL AVG
$15.7M
Rank
#33 / 184 | $13.8MFiscal year ending 04/2024
Facility
$13.8MFiscal year ending 04/2024
FL AVG
$6.1M
Rank
#28 / 184 | 106.9%Fiscal year ending 04/2024
Facility
106.9%Fiscal year ending 04/2024
FL AVG
39.8%
Rank
#115 / 184 | 105668 | ||||
| Covenant Village Care Center | NH AL IL MC RC SNF | Plantation (West Broward Boulevard) | 60
Facility
60
FL AVG
88
Rank
#681 / 1058 | - | - | 4.38
Facility
4.38
FL AVG
4.04
Rank
#52 / 181 | +58% | +9% | $0
Facility
$0
FL AVG
$78.9k
Rank
#1 / 185 | - | 13
Facility
13
FL AVG
19.7
Rank
#56 / 181 | 3.3
Facility
3.3
FL AVG
4.5
Rank
#53 / 181 | - | 61 | - |
17
Facility
17
FL AVG
40
Rank
#1146 / 1487 | Kathy Buettner | $7.5MFiscal year ending 09/2023
Facility
$7.5MFiscal year ending 09/2023
FL AVG
$15.7M
Rank
#150 / 184 | $5.0MFiscal year ending 09/2023
Facility
$5.0MFiscal year ending 09/2023
FL AVG
$6.1M
Rank
#155 / 184 | 66.1%Fiscal year ending 09/2023
Facility
66.1%Fiscal year ending 09/2023
FL AVG
39.8%
Rank
#79 / 184 | 105604 | ||||
| Wilton Manors Health and Rehabilitation Center | NH SNF | Fort Lauderdale | 147
Facility
147
FL AVG
88
Rank
#150 / 1058 |
93.1%
Facility
93.1%
FL AVG
84.4
Rank
#43 / 125 | +10% | 3.59
Facility
3.59
FL AVG
4.04
Rank
#149 / 181 | -1% | -11% | $17.3k
Facility
$17.3k
FL AVG
$78.9k
Rank
#139 / 185 | - | 27
Facility
27
FL AVG
19.7
Rank
#135 / 181 | 6.8
Facility
6.8
FL AVG
4.5
Rank
#153 / 181 | 1 | 137 | - |
86
Facility
86
FL AVG
40
Rank
#58 / 1487 | Wilton Manors Snf Holdco LLC | $19.6MFiscal year ending 12/2023
Facility
$19.6MFiscal year ending 12/2023
FL AVG
$15.7M
Rank
#78 / 184 | $9.0MFiscal year ending 12/2023
Facility
$9.0MFiscal year ending 12/2023
FL AVG
$6.1M
Rank
#79 / 184 | 45.6%Fiscal year ending 12/2023
Facility
45.6%Fiscal year ending 12/2023
FL AVG
39.8%
Rank
#107 / 184 | 105119 | ||||
| Life Care Center at Inverrary | NH SNF | Lauderhill (Inverrary) | 120
Facility
120
FL AVG
88
Rank
#253 / 1058 |
89.8%
Facility
89.8%
FL AVG
84.4
Rank
#68 / 125 | +6% | 4.08
Facility
4.08
FL AVG
4.04
Rank
#76 / 181 | +52% | +1% | $0
Facility
$0
FL AVG
$78.9k
Rank
#1 / 185 | - | 22
Facility
22
FL AVG
19.7
Rank
#114 / 181 | 7.3
Facility
7.3
FL AVG
4.5
Rank
#160 / 181 | - | 108 | A+ |
12
Facility
12
FL AVG
40
Rank
#1225 / 1487 | Cody Brayton | $13.5MFiscal year ending 12/2023
Facility
$13.5MFiscal year ending 12/2023
FL AVG
$15.7M
Rank
#85 / 184 | $8.0MFiscal year ending 12/2023
Facility
$8.0MFiscal year ending 12/2023
FL AVG
$6.1M
Rank
#99 / 184 | 59.5%Fiscal year ending 12/2023
Facility
59.5%Fiscal year ending 12/2023
FL AVG
39.8%
Rank
#125 / 184 | 106047 | ||||
| West Broward Care Center | NH | Plantation | 120
Facility
120
FL AVG
88
Rank
#253 / 1058 |
88.8%
Facility
88.8%
FL AVG
84.4
Rank
#72 / 125 | +5% | 3.80
Facility
3.80
FL AVG
4.04
Rank
#119 / 181 | +53% | -6% | $33.9k
Facility
$33.9k
FL AVG
$78.9k
Rank
#150 / 185 | - | 34
Facility
34
FL AVG
19.7
Rank
#164 / 181 | 8.5
Facility
8.5
FL AVG
4.5
Rank
#174 / 181 | 1 | 107 | - |
69
Facility
69
FL AVG
40
Rank
#223 / 1487 | Micheal Gottlieb | $14.8MFiscal year ending 12/2023
Facility
$14.8MFiscal year ending 12/2023
FL AVG
$15.7M
Rank
#135 / 184 | $7.9MFiscal year ending 12/2023
Facility
$7.9MFiscal year ending 12/2023
FL AVG
$6.1M
Rank
#109 / 184 | 53.4%Fiscal year ending 12/2023
Facility
53.4%Fiscal year ending 12/2023
FL AVG
39.8%
Rank
#28 / 184 | 105237 |
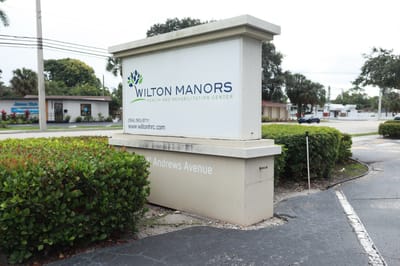
Wilton Manors Health and Rehabilitation Center is located in Fort Lauderdale, Florida.
Here are the financial assistance programs available to residents in Florida.
Wilton Manors Health and Rehabilitation Center has a walk score of 86. Very walkable. Most errands can be accomplished on foot, and many essentials are within a short walk.
Wilton Manors Health and Rehabilitation Center's occupancy is 93.5%.
No, Wilton Manors Health and Rehabilitation Center has a no-pet policy.
Wilton Manors Health and Rehabilitation Center is registered as a for-profit.
Yes — there are 6 photos of Wilton Manors Health and Rehabilitation Center in the photo gallery on this page.
Wilton Manors Health and Rehabilitation Center is located at 2675 N Andrews Ave, Fort Lauderdale, FL 33311.
(954) 563-5711 will put you in contact with the team at Wilton Manors Health and Rehabilitation Center.
Care Cost Calculator: See Prices in Your Area
Nursing Home Data Explorer
Don’t Wait Too Long: 7 Red Flag Signs Your Parent Needs Assisted Living Now
The True Cost of Assisted Living in 2025 – And How Families Are Paying For It
Understanding Senior Living Costs: Pricing Models, Discounts & Financial Assistance


