Total health inspections
11
Indiana average 6
Last Health inspection on Jul 2025

We arrange tours, appointments, and even moving support so you don’t have to
Thank you for your interest!
Our team will be in touch shortly to help with next steps.

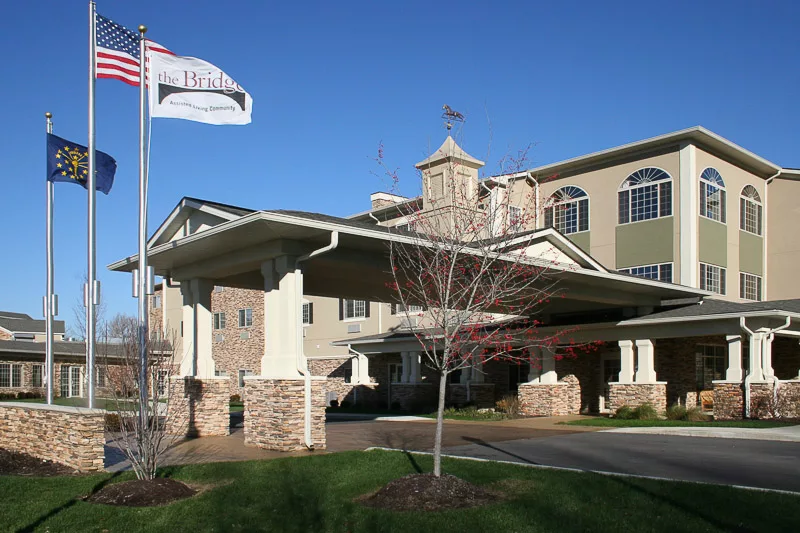


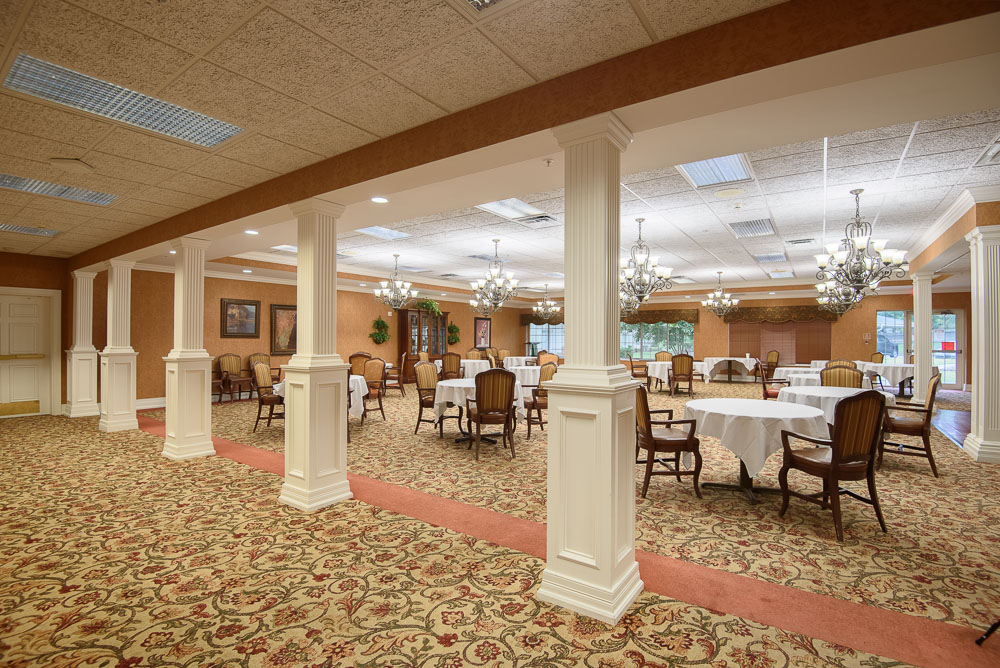


Westside Village Nursing, located in Indianapolis, IN, is a nursing home offering skilled nursing services and long-term care. Their well experienced staff provides residents a variety of healthcare services according to their needs whether its wound care, or diabetes management. As part of their skilled nursing services, they provide 24/7 skilled nursing care, fall prevention, as well as medication management.
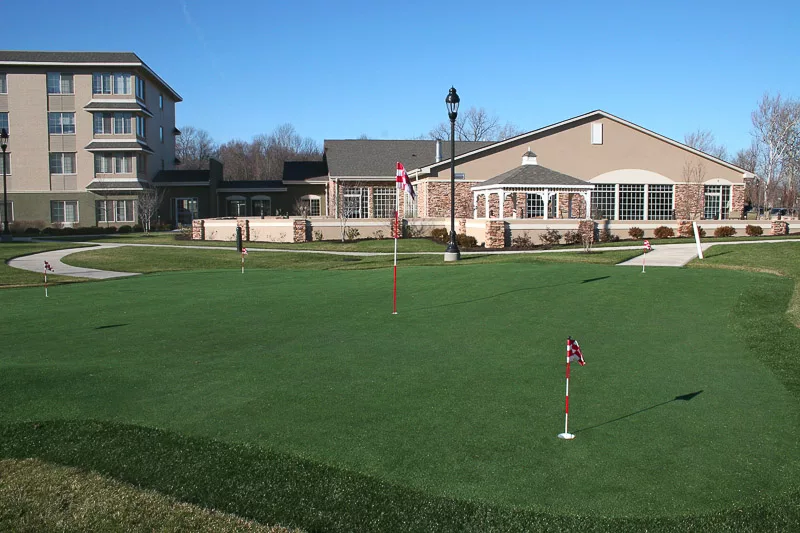
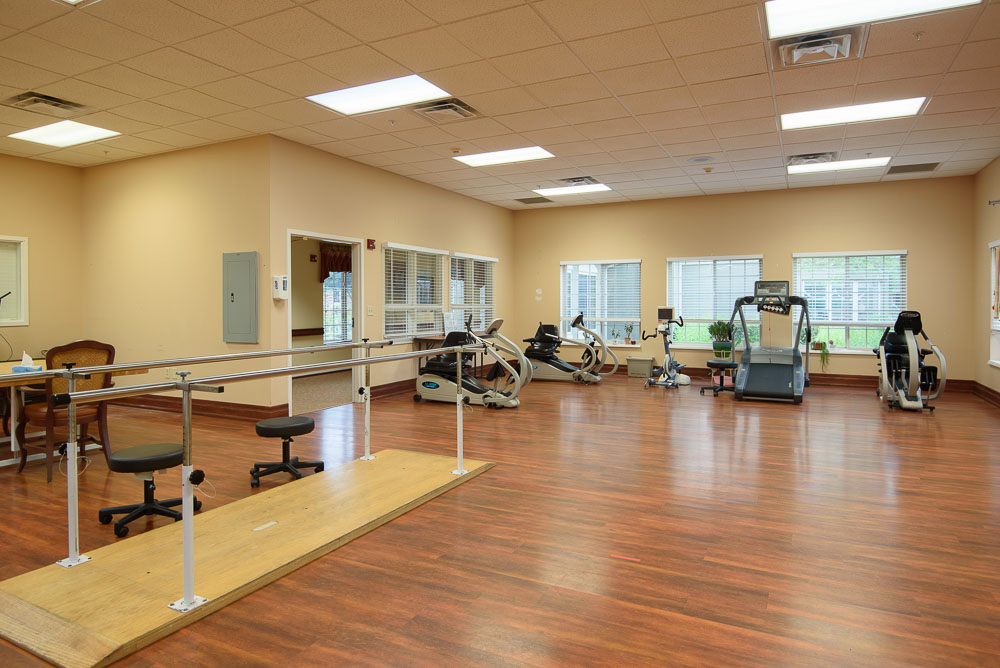
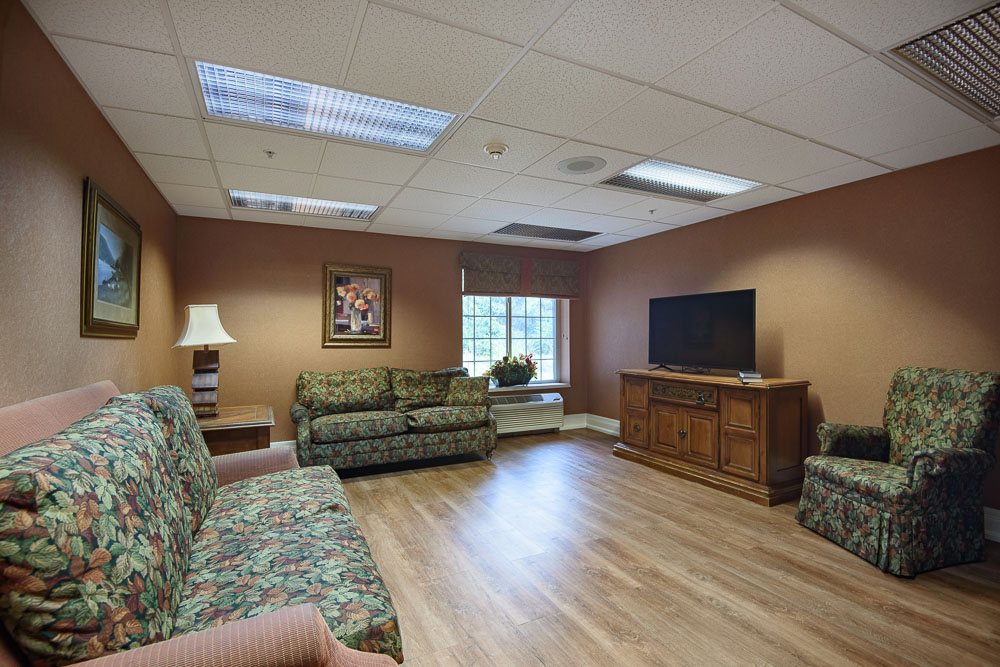
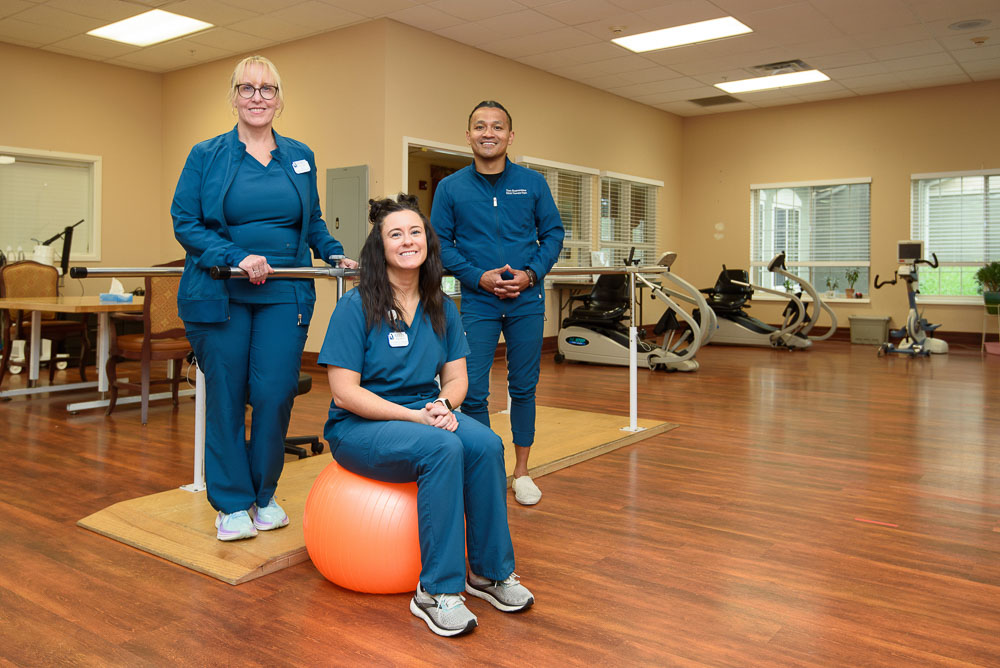
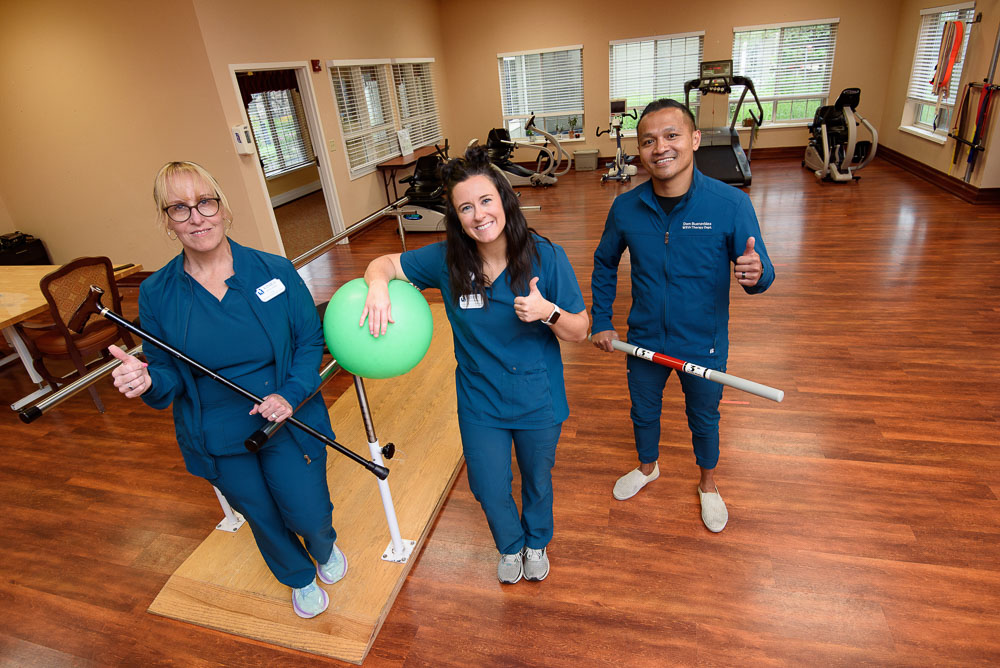
Additionally, they also offer therapy services ranging from occupational, physical, and speech. As for their amenities, the residents are able to enjoy 24/7 security of a home-like setting where their non-medical needs are also attended to. Such needs they can meet include nutritional services through their fine dining programs, grooming services from their beauty salon and barbershop, and educational services from their well stocked library.
Offers a balance of services and community atmosphere.
Lower occupancy suggests more openings may be available.
Most residents stay for extended periods and receive ongoing daily care.
27% of new residents, usually for short-term rehab.
33% of new residents, often for short stays.
40% of new residents, often for long-term daily care.
Key information about the people who lead and staff this community.
In Indiana, the Department of Health, Division of Long Term Care is the primary regulatory body that performs onsite inspections and quality of care reviews for all licensed facilities.
Indiana average 6
Last Health inspection on Jul 2025
Indiana average 25
Indiana average 4.12
Health citations are formal notices following inspections when they fail to comply with safety and care standards.
51 of 76 citations resulted from standard inspections; 22 of 76 resulted from complaint investigations; and 3 of 76 came from combined inspections (standard and complaint).
Indiana average: 0.2
Indiana average: 0.6
Data sourced from CMS Health Deficiencies reports. Citation severity codes range from A (least serious) to L (most serious). Immediate Jeopardy (J-L) citations indicate situations where the facility's noncompliance has placed residents at risk of death or serious harm.
Nursing Home Licensed facility providing 24/7 skilled nursing care for residents with complex, ongoing medical needs. Staffed by RNs, LPNs, and CNAs. Inspected and star-rated annually by CMS. Accepts Medicare (short-term rehab) and Medicaid (long-term care).
Assisted Living A licensed, long-term care setting for seniors or individuals with disabilities who need help with daily activities — like bathing, dressing, and medication management — but not 24-hour skilled nursing. Offers housing, meals, and around-the-clock support while aiming to maximize resident independence.
![]() 8.4 miles from city center — 6.5 miles to nearest hospital (Kindred Hospital Indianapolis)
8.4 miles from city center — 6.5 miles to nearest hospital (Kindred Hospital Indianapolis)
![]() 8616 W 10th St, Indianapolis, IN 46234
8616 W 10th St, Indianapolis, IN 46234
Add your location
This data corresponds to Q2 2025 and is based on CMS Payroll-Based Journal.
Indiana average ratio: 0.00:1
Indiana average: 7.7 hours
Manages medical care and health needs.
No contractors work on this role.
Assists with medical care and medications.
No contractors work on this role.
Helps with daily care and mobility.
No contractors work on this role.
Total hours from contractors
191 contractor hours this quarter
| Certified Nursing Assistant | 44 | 0 | 44 | 12,942 | 91 | 100% | 7.6 |
| Licensed Practical Nurse | 20 | 0 | 20 | 5,872 | 91 | 100% | 8.6 |
| Medication Aide/Technician | 9 | 0 | 9 | 4,664 | 91 | 100% | 8.7 |
| Registered Nurse | 7 | 0 | 7 | 2,318 | 91 | 100% | 9.3 |
| Other Dietary Services Staff | 5 | 0 | 5 | 1,568 | 91 | 100% | 7.7 |
| Respiratory Therapy Technician | 9 | 0 | 9 | 1,558 | 75 | 82% | 6.2 |
| Clinical Nurse Specialist | 3 | 0 | 3 | 1,065 | 65 | 71% | 8.3 |
| Qualified Social Worker | 3 | 0 | 3 | 901 | 66 | 73% | 7.6 |
| Speech Language Pathologist | 3 | 0 | 3 | 864 | 70 | 77% | 7.2 |
| RN Director of Nursing | 4 | 0 | 4 | 848 | 71 | 78% | 8.2 |
| Physical Therapy Aide | 3 | 0 | 3 | 811 | 74 | 81% | 6.5 |
| Dental Services Staff | 4 | 0 | 4 | 656 | 76 | 84% | 5.9 |
| Administrator | 2 | 0 | 2 | 552 | 65 | 71% | 8 |
| Nurse Practitioner | 1 | 0 | 1 | 520 | 65 | 71% | 8 |
| Physical Therapy Assistant | 2 | 0 | 2 | 484 | 59 | 65% | 6.6 |
| Dietitian | 1 | 0 | 1 | 413 | 57 | 63% | 7.2 |
| Mental Health Service Worker | 2 | 0 | 2 | 270 | 36 | 40% | 7.5 |
| Occupational Therapy Aide | 0 | 1 | 1 | 134 | 26 | 29% | 5.2 |
| Occupational Therapy Assistant | 0 | 5 | 5 | 34 | 6 | 7% | 3.8 |
| Medical Director | 0 | 1 | 1 | 23 | 3 | 3% | 7.5 |
Source: CMS Long-Term Care Facility Characteristics (Data as of Jan 2026)
Residents meet regularly to discuss policies, care quality, and activities
Organized group of residents that meets regularly to discuss facility policies, quality of life, and activities.
Data sourced from CMS Long-Term Care Facility Characteristics quarterly report. Payer mix reflects the current resident census by primary payment source.
These measures show how residents usually do over time at this home, based on health outcomes and preventive care.
Indiana average: 8.0
Indiana average: 17.1
Indiana average: 12.0%
Indiana average: 14.4%
Indiana average: 24.6%
Indiana average: 3.9%
Indiana average: 4.4%
Indiana average: 1.2%
Indiana average: 5.7%
Indiana average: 24.1%
Indiana average: 12.4%
Indiana average: 93.7%
Indiana average: 95.4%
Indiana average: 1.60
Indiana average: 1.48
Indiana average: 81.7%
Indiana average: 1.4%
Indiana average: 79.0%
Indiana average: 22.4%
Indiana average: 10.5%
Indiana average: 0.8%
Indiana average: 53.7%
Indiana average: 50.6%
Quality measures are calculated from Minimum Data Set (MDS) assessments. For most measures, lower percentages indicate better care quality.
Historical financial and operational data for Westside Village Nursing Center based on CMS SNF Cost Reports.
Loading trend charts...
Care Cost Calculator: See Prices in Your Area
Nursing Home Data Explorer
Don’t Wait Too Long: 7 Red Flag Signs Your Parent Needs Assisted Living Now
The True Cost of Assisted Living in 2025 – And How Families Are Paying For It
Understanding Senior Living Costs: Pricing Models, Discounts & Financial Assistance

Touring a community? Use this expert-backed checklist to stay organized, ask the right questions, and find the perfect fit.
We'll send you a PDF version of the touring checklist.