Westwood Post-Acute
Nursing Home, Memory Care & Respite Care · San Jose, CA
CMS overall rating Info CMS (the Centers for Medicare & Medicaid Services) is the federal agency that rates nursing home quality. Its Overall Rating runs from 1 to 5 stars, combining health inspections, staffing, and quality measures, with inspections weighted most heavily.

Westwood Post-Acute

Nursing Home, Memory Care & Respite Care · San Jose, CA
CMS overall rating Info CMS (the Centers for Medicare & Medicaid Services) is the federal agency that rates nursing home quality. Its Overall Rating runs from 1 to 5 stars, combining health inspections, staffing, and quality measures, with inspections weighted most heavily.
Calculator: See prices in your area
Westwood Post-Acute accepts Medicare, Medicaid, and private pay.

Overview of Westwood Post-Acute

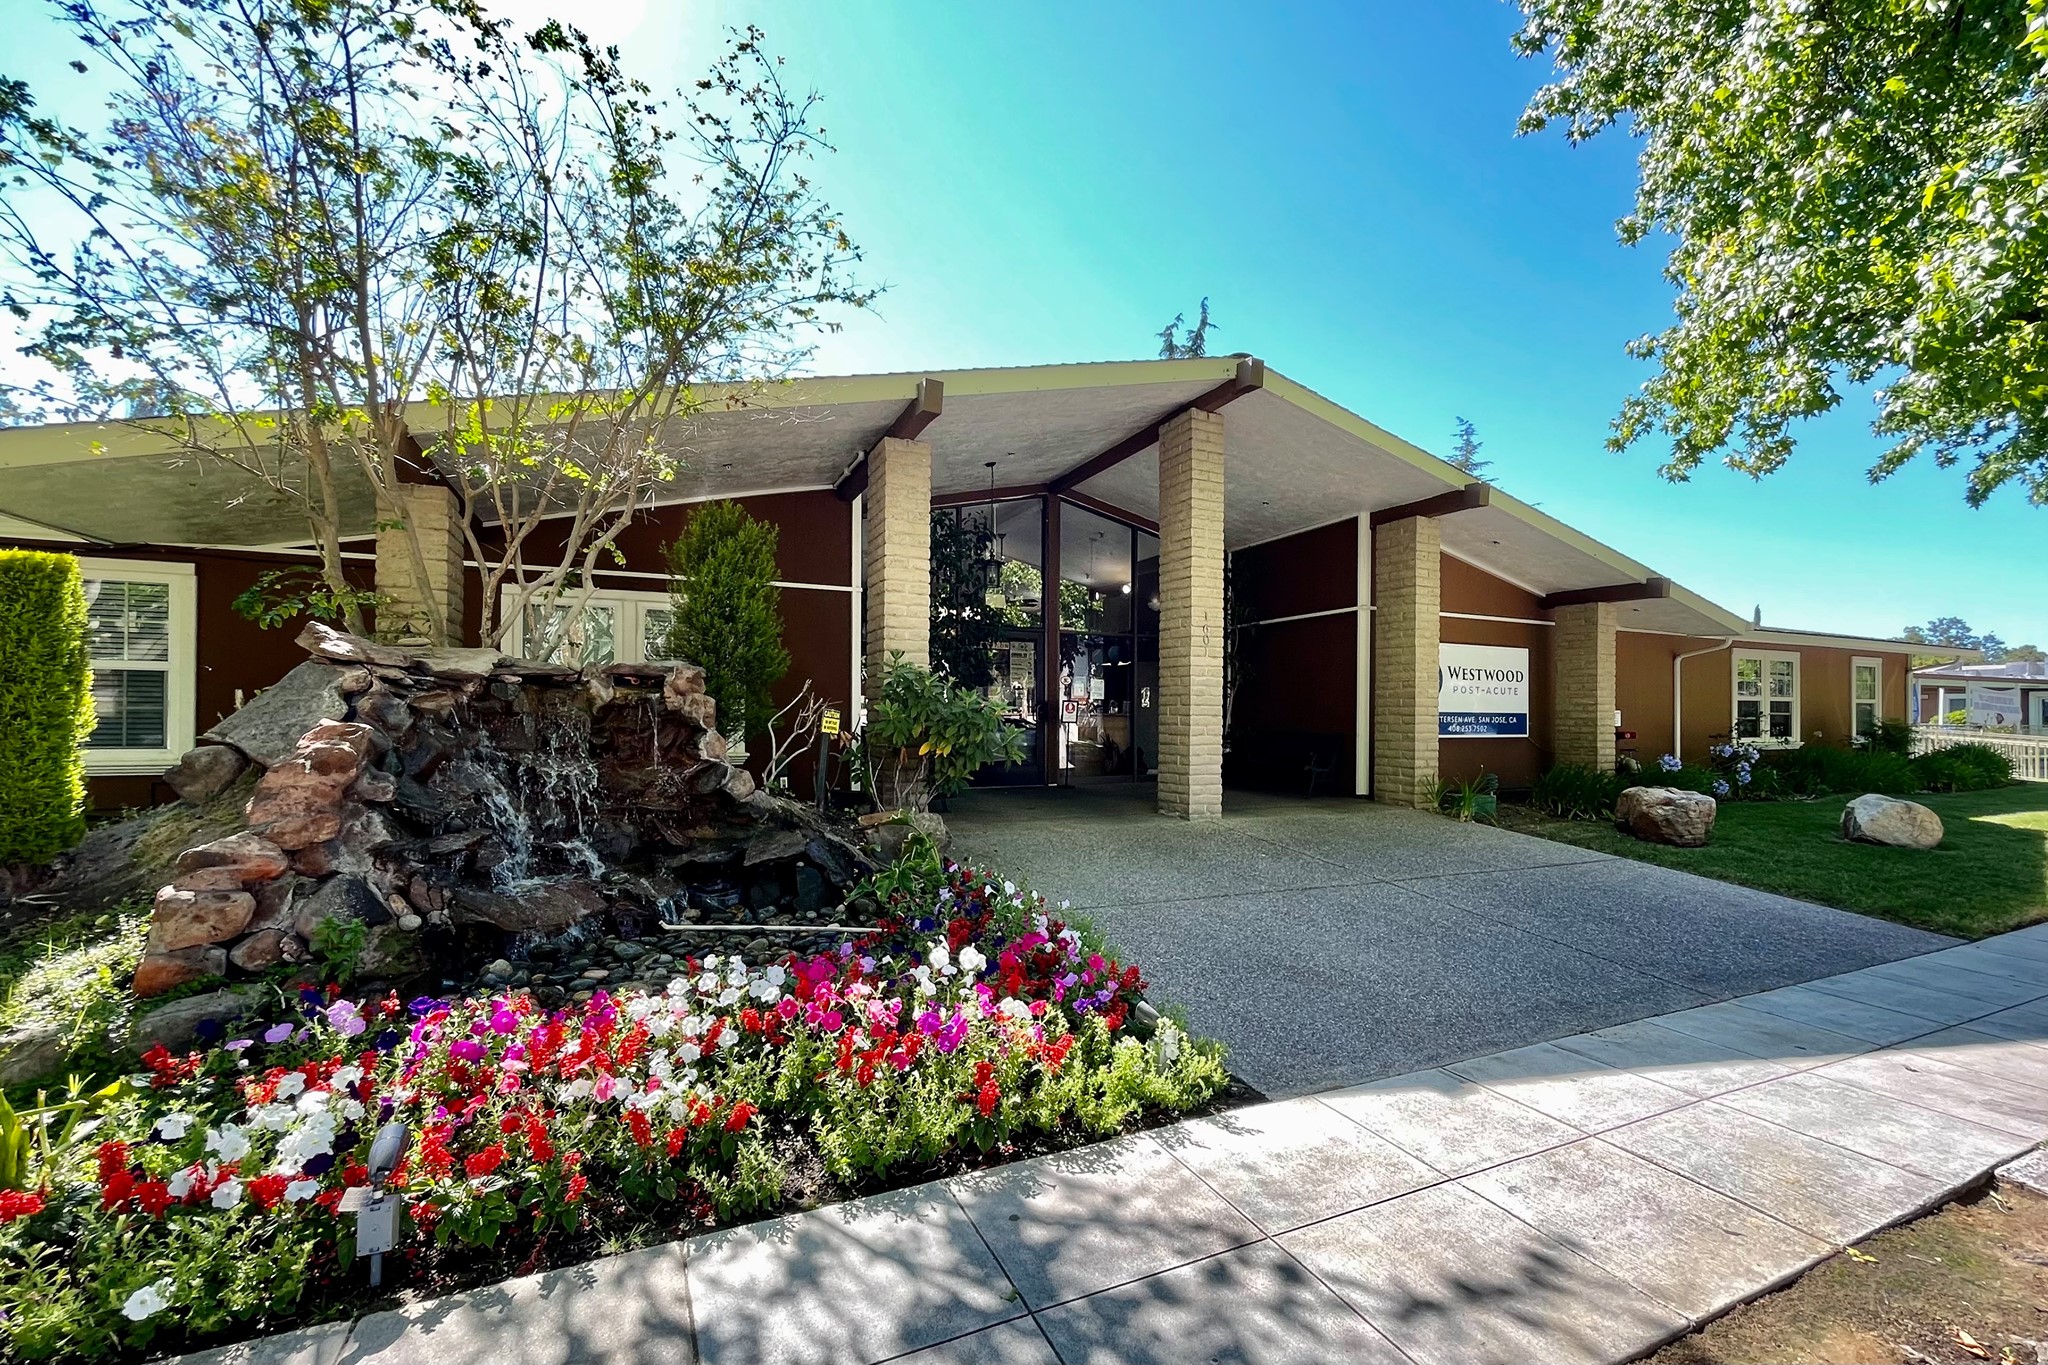
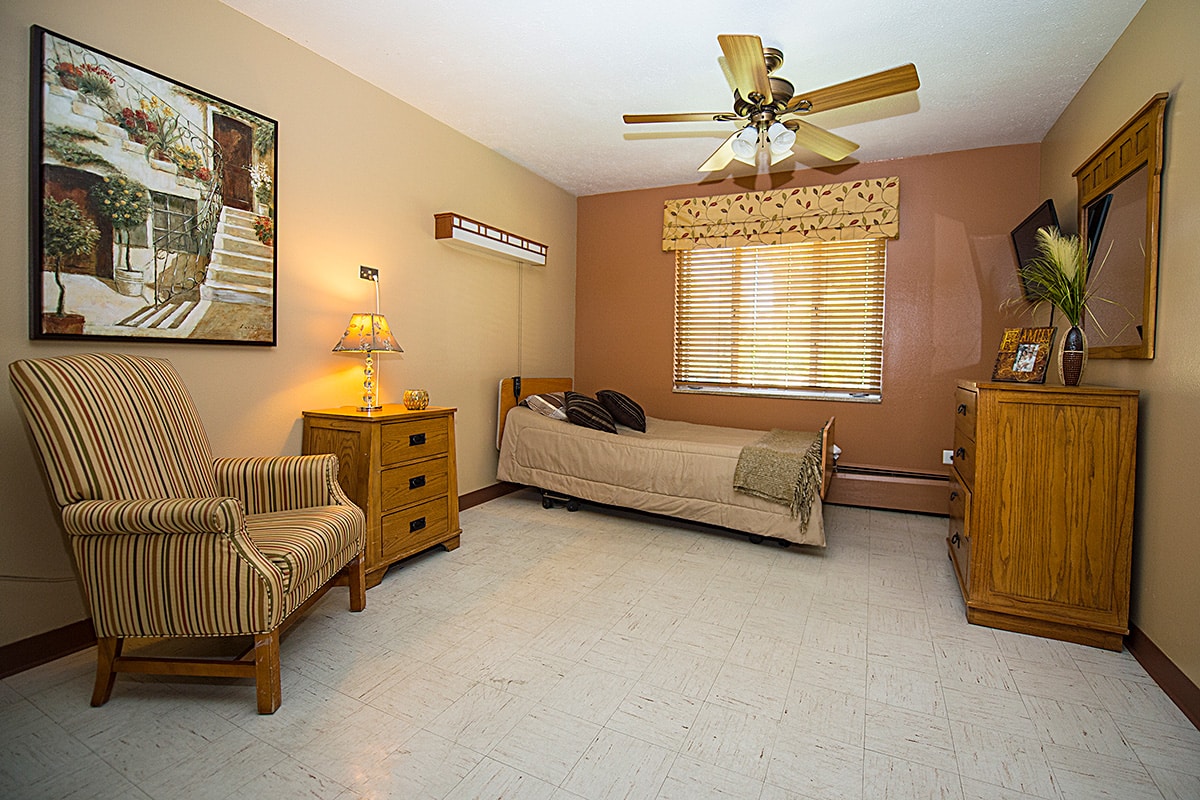
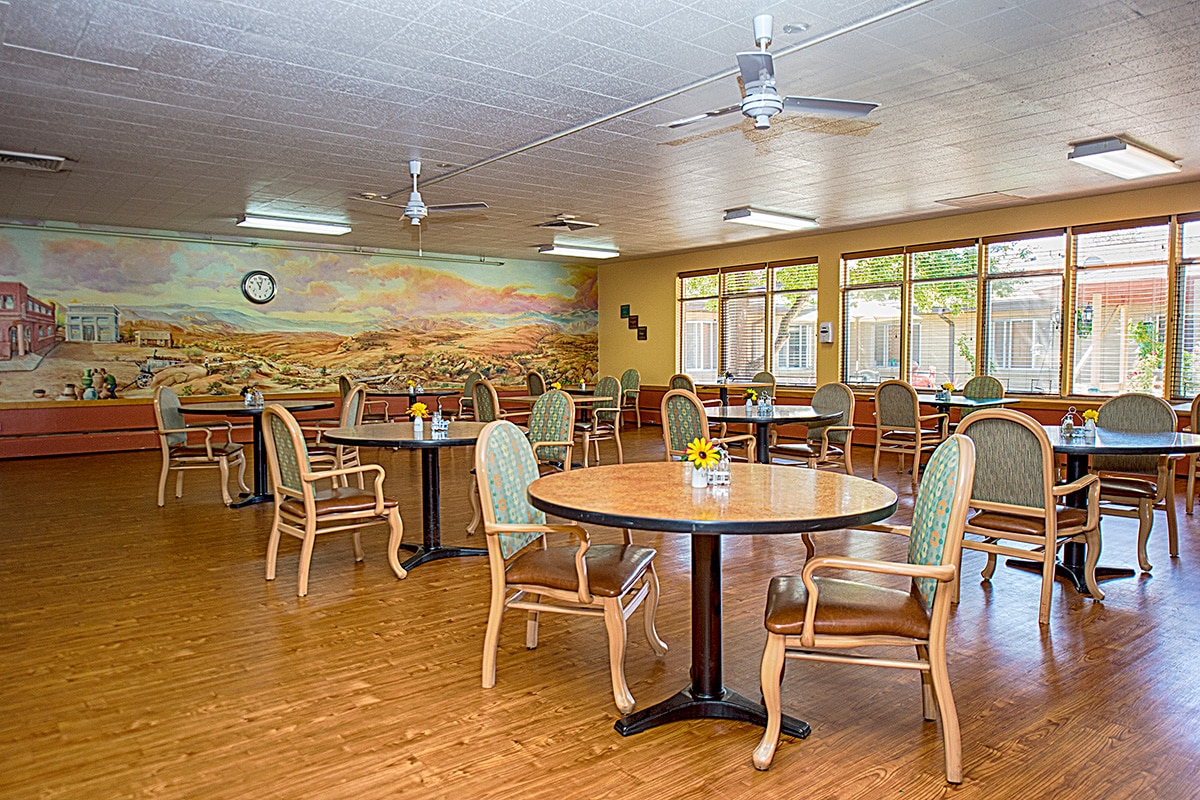
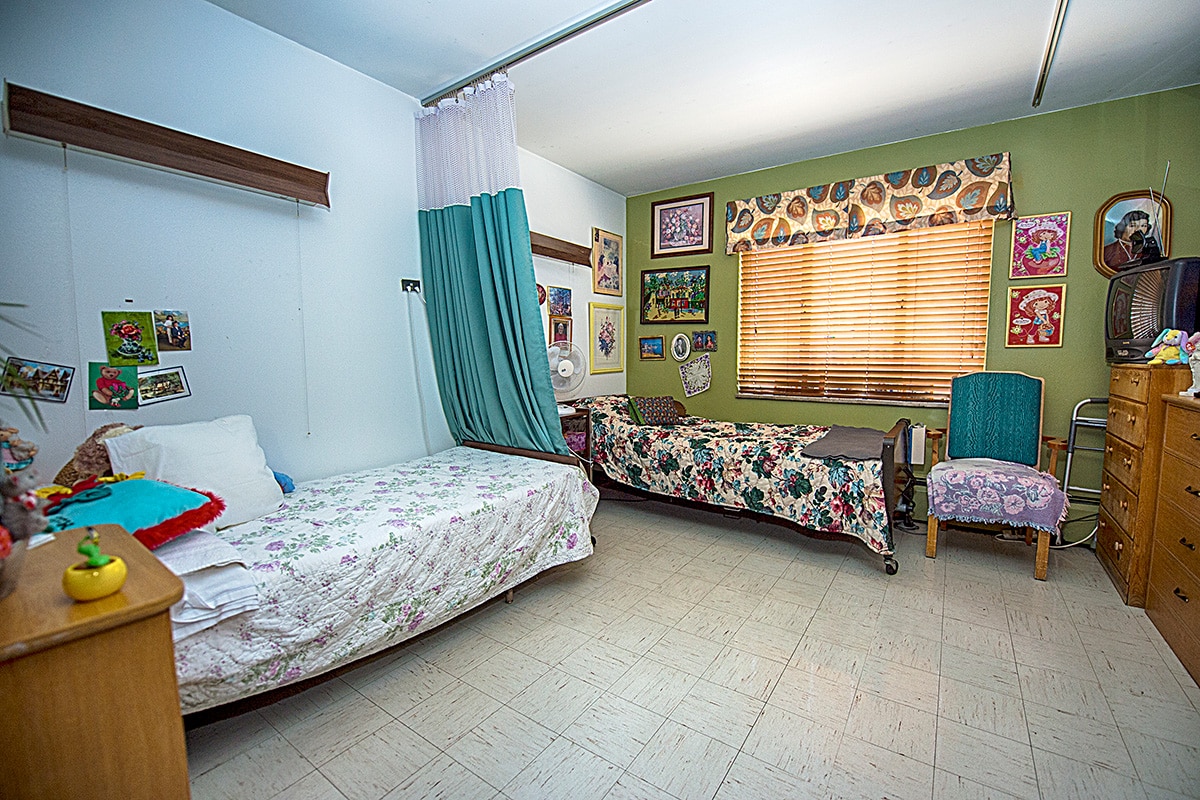
Westwood Post-Acute is a highly recognized nursing home in San Jose, CA, offering comprehensive skilled nursing and rehabilitation. Here, older adults are guaranteed the utmost comfort, especially with its warm and home-like setting. With 24-hour care, social services, and therapy, residents receive the utmost attention and care to live to their potential. The community also works closely with residents to provide the best possible care for their needs and habits.

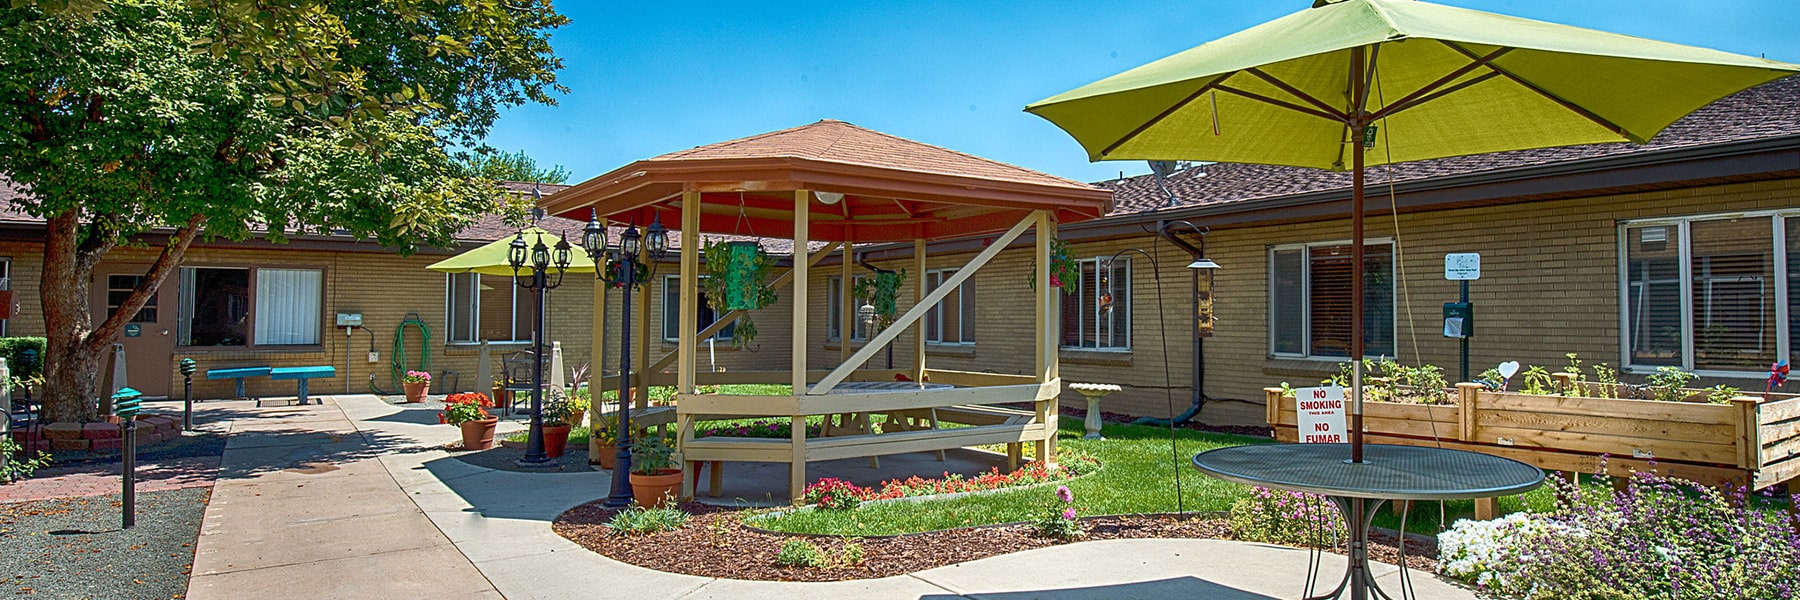
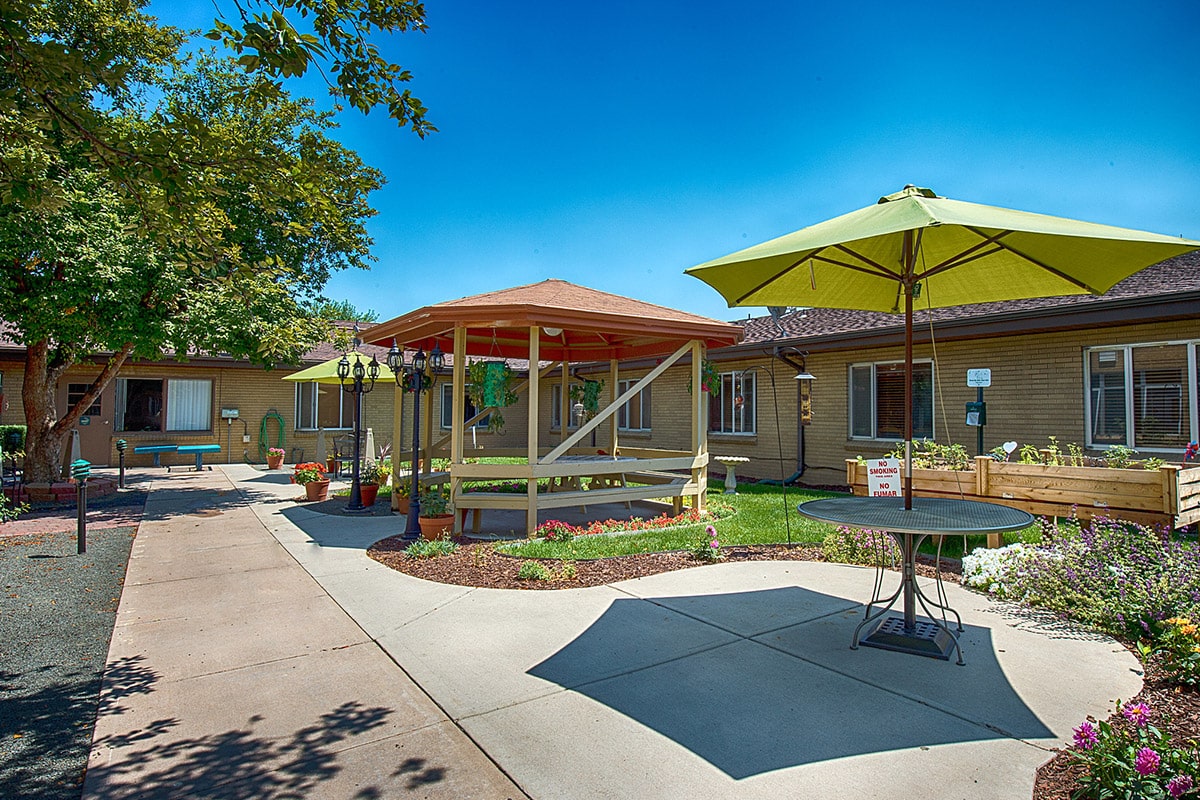
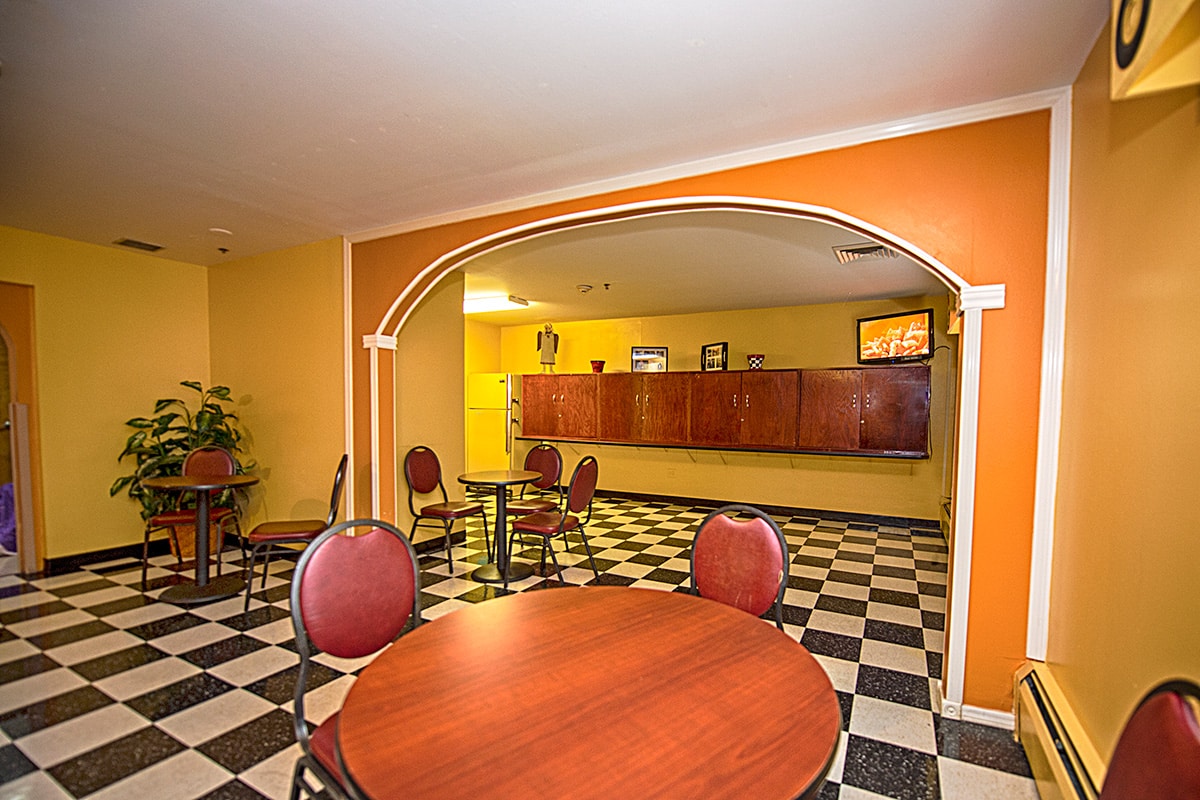
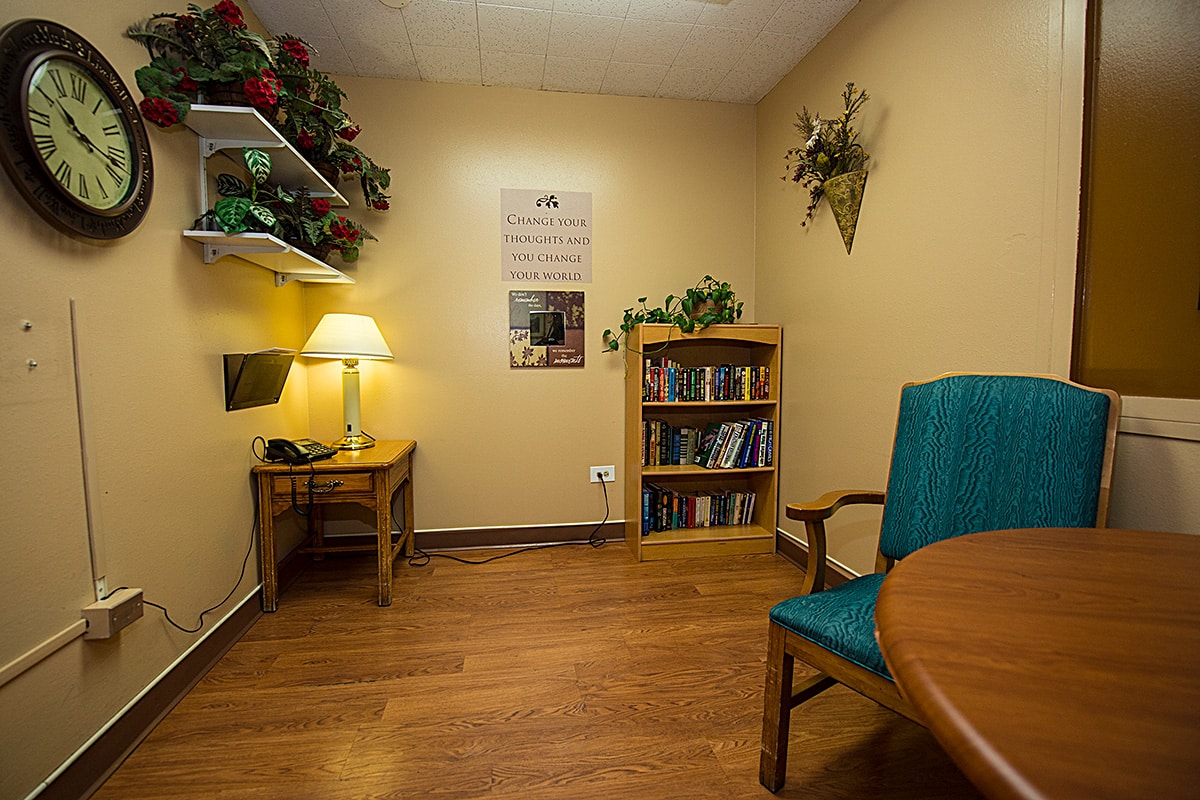
Stretching exercises, musical performances, and volunteer programs are just some of the activities that residents can participate in to explore new interests and gain meaningful experiences. Spacious common areas and cozy rooms also ensure residents can rest and connect with their surroundings comfortably. Situated near restaurants, shops, a school, and the Lawrence Expressway in San Jose, the community guarantees accessibility and convenience. As one of the trusted options for senior living in California, this nursing home ensures older adults can thrive in retirement.

(408) 253-7502

Quality ratings

Measured by Centers for Medicare & Medicaid Services (CMS)

Overall rating Info The Overall CMS Rating combines results from health inspections, staffing levels and quality measures. Health inspections carry the most weight. Staffing and quality scores can increase or decrease the final rating based on performance compared to state and national standards.
▼ 36.5% Below CA avg. ▼ 36.5% Below CA avg.Click the badge to see the full State ranking.Click here to see the full State ranking.
Health Inspection Info Based on the results of the facility's three most recent standard inspections and any complaint investigations. CMS reviews the number, scope, and severity of deficiencies, with more recent findings weighted more heavily.
▼ 64.2% Below CA avg. ▼ 64.2% Below CA avg.Click the badge to see the full State ranking.Click here to see the full State ranking.
Staffing Info Measures average nursing staff hours per resident per day, including Registered Nurses (RNs) and total nursing staff. Ratings are adjusted based on the level of care residents require and are compared to state and national benchmarks.
▼ 4.4% Below CA avg. ▼ 4.4% Below CA avg.Click the badge to see the full State ranking.Click here to see the full State ranking.
Quality Measures Info Based on clinical and physical health indicators reported to CMS, such as hospital readmissions, falls, pressure ulcers, and improvements in mobility. These measures reflect how well residents' health needs are being managed.
▲ 22.4% Above CA avg. ▲ 22.4% Above CA avg.Click the badge to see the full State ranking.Click here to see the full State ranking.

Staffing hours breakdown

Info Daily nursing hours per resident by staff type, reported to CMS. Higher is generally better — compare this facility to state and national averages to see where staffing stands.

Hours per resident per day — compared to California state averages

Total nursing care / resident Info This home is ranked 238th out of 345 homes in California for nurse hours. Total adjusted nursing hours per resident per day, combining RN, LPN, and aide time. CMS adjusts this for case-mix so facilities can be fairly compared.
3h 42m per day
Rank #238 / 345Nurse hours — State benchmarkedThis home is ranked 238th out of 345 homes in California. Shows adjusted nurse hours per resident per day benchmarked to the California average, with a ranking across 345 California facilities. More hours mean more direct care. The national average is about 3.5 hrs; below 3.0 is a red flag.Click the rank badge to see the full State ranking.Click here to see the full State ranking.
This facility California avg (4h 13m per day)
vs California avg
-12%

1 of 6 metrics below state avg

Standout metric Physical Therapist is +56% above state avg
Staff typeHours / Day / Residentvs state avg
Registered Nurse (RN) Info RNs hold the highest nursing license and can assess residents, interpret test results, and direct care plans. More RN hours per day often signals stronger clinical oversight and faster response to health changes. 41m per day ▲ 5% State avg: 39m per day · National avg: 41m per day
LPN / LVN Info Licensed Practical Nurses (LPNs) or Licensed Vocational Nurses (LVNs) deliver routine hands-on care — medication administration, wound dressing, and monitoring vital signs. They work under RN supervision and make up a large share of daily bedside care. 1h 17m per day ▲ 5% State avg: 1h 13m per day · National avg: 52m per day
Nurse Aide Info Certified Nurse Aides (CNAs) provide the most direct day-to-day assistance: bathing, dressing, feeding, and mobility. Nurse aide hours are typically the largest staffing category and directly affect residents' quality of life. 2h 26m per day ▼ 8% State avg: 2h 39m per day · National avg: 2h 21m per day
Weekend Total Nursing Info Combined nursing hours (RN + LPN + Nurse Aide) per resident per day on weekends. Staffing often drops on weekends — this figure reveals whether the facility maintains adequate coverage outside of weekday hours. 4h 10m per day ■ Avg State avg: 4h 5m per day · National avg: 3h 26m per day
Physical Therapist Info Hours per resident per day provided by licensed Physical Therapists (PTs) or PT Assistants. PT services help residents recover mobility after injury or illness and are especially important for post-acute (short-stay) rehabilitation. 8m per day ▲ 56% State avg: 5m per day · National avg: 4m per day
Weekend RN Info Registered nurse hours specifically on weekends. Facilities sometimes reduce RN presence on Saturdays and Sundays — a low weekend RN figure compared to weekday hours can indicate reduced clinical oversight when most administrative staff are absent. 36m per day ▲ 21% State avg: 30m per day · National avg: 29m per day

Capacity and availability

This home usually has limited availability

Higher occupancy than the California average: 84.7%
Occupancy rate
93.2% Rank #237 / 1530Occupancy rate — State benchmarkedThis home is ranked 237th out of 1530 homes in California. Shows this facility's occupancy rate versus the California average, with its Statewide rank out of 1530. Higher occupancy signals strong local demand and financial stability.Click the rank badge to see the full State ranking.Click here to see the full State ranking.
Avg. Length of Stay
115 days
Walk Score
Walk Score: 67 / 100 Rank #830 / 2092Walk Score — State benchmarkedThis home is ranked 830th out of 2092 homes in California. Shows how walkable this facility's neighborhood is compared to the average Walk Score across California facilities. Higher scores benefit residents, families, and staff.Click the rank badge to see the full State ranking.Click here to see the full State ranking.
Moderately walkable. Some errands can be accomplished on foot, with a mix of nearby amenities.

About this community

License Details

Certifications5-Star Quality Measures Medicare Rating

Safety & Compliance

Emergency SystemsYes

Payment & Insurance

1 service
Accept Medicare

Therapy & Rehabilitation

3 services
Rehabilitation Services
Respite Care
Short-Term Rehab

Staffing & Medical

1 service
24-Hour Staffing

Additional Policies & Features

Visitor PolicyFamily and friends play a critical role in residents’ emotional and physical well-being.

Amenities & Lifestyle

Restaurant
Garden
ActivitiesDaily activities are offered for a variety of interests, with an activity calendar posted in residents' rooms.
Branded ProgramsRubato music therapy
Wellness ProgramThe community offers a holistic approach to wellness that includes tailored nutrition plans, gentle exercise programs, art therapy, gardening, music therapy, and mindfulness practices.
Specific ProgramsSubacute Care, Physical Therapy, Occupational Therapy, Speech Therapy, IV Therapy, Respiratory Therapy, Wound Therapy, Outpatient Rehabilitation
Religious ServicesYes
Volunteer ProgramsYes
Touring HoursMonday, Tuesday, Wednesday, Thursday, Friday 08:00-17:00; Saturday, Sunday 09:00-16:00

Dining & Nutrition

Food DescriptionMeals are designed with seniors' nutritional needs in mind, incorporating fresh, seasonal produce and tailored nutrition plans.

Contact Westwood Post-Acute

Staffing Data

Reporting period: October 1 – December 31, 2025 (Q4 2025). Source: CMS Payroll-Based Journal report.

Total staff 367
Employees 365
Contractors 2
Staff to resident ratio 1.65 : 1
9% fewer staff per resident than California average
California average ratio: 1.81 : 1 California average ratio: 1.81 : 1See full California ranking
Avg staff/day 171
Average shift 7.6 hours
0% compared with California average
California average: 7.7 hours California average shift: 7.7 hoursSee full California ranking
Total staff hours (quarter) 119,910

Nursing staff breakdown

Q4 2025 · Oct 1 – Dec 31 More info This data comes from the CMS Payroll-Based Journal report covering October 1 – December 31, 2025.
Registered Nurse

Manages medical care and health needs.

RN Staff Info All 48 RN Staff are full-time employees. No contractors work on this role. 48
Average shift length Info Average shift length. Calculated as total hours divided by days worked and average staff per day. 7.6 hours
Licensed Practical Nurse

Assists with medical care and medications.

LPN Staff Info All 65 LPN Staff are full-time employees. No contractors work on this role. 65
Average shift length Info Average shift length. Calculated as total hours divided by days worked and average staff per day. 8.1 hours
Certified Nursing Assistant

Helps with daily care and mobility.

CNA Staff Info All 174 CNA Staff are full-time employees. No contractors work on this role. 174
Average shift length Info Average shift length. Calculated as total hours divided by days worked and average staff per day. 7.3 hours

Contractor staffing

Q4 2025 · Oct 1 – Dec 31 More info This data comes from the CMS Payroll-Based Journal report covering October 1 – December 31, 2025.

Total hours from contractors

0.1%

92 contractor hours this quarter

Physical Therapy Assistant: 1 Physical Therapy Aide: 1

Staff by category

Q4 2025 · Oct 1 – Dec 31 More info This data comes from the CMS Payroll-Based Journal report covering October 1 – December 31, 2025.
Certified Nursing Assistant174017455,78792100%7.3
Licensed Practical Nurse6506525,91792100%8.1
Registered Nurse4804812,72992100%7.6
Qualified Activities Professional150153,91892100%10.3
RN Director of Nursing100103,4237278%7.9
Other Dietary Services Staff8083,01192100%7.5
Physical Therapy Assistant91103,0089098%7.6
Respiratory Therapy Technician100102,96992100%7.2
Clinical Nurse Specialist5052,4107986%7.9
Dental Services Staff6062,1938289%8.3
Speech Language Pathologist4041,2317480%7
Occupational Therapy Aide2028926470%8
Administrator1015126470%8
Nurse Practitioner1015126470%8
Dietitian1015126470%8
Physical Therapy Aide1125076368%7.6
Qualified Social Worker5053794650%6.1
174 Certified Nursing Assistant
% of Days 100%
65 Licensed Practical Nurse
% of Days 100%
48 Registered Nurse
% of Days 100%
15 Qualified Activities Professional
% of Days 100%
10 RN Director of Nursing
% of Days 78%
8 Other Dietary Services Staff
% of Days 100%
10 Physical Therapy Assistant
% of Days 98%
10 Respiratory Therapy Technician
% of Days 100%
5 Clinical Nurse Specialist
% of Days 86%
6 Dental Services Staff
% of Days 89%
4 Speech Language Pathologist
% of Days 80%
2 Occupational Therapy Aide
% of Days 70%
1 Administrator
% of Days 70%
1 Nurse Practitioner
% of Days 70%
1 Dietitian
% of Days 70%
2 Physical Therapy Aide
% of Days 68%
5 Qualified Social Worker
% of Days 50%

Penalties and fines

Federal penalties imposed by CMS for regulatory violations, including civil money penalties (fines) and denials of payment for new Medicare/Medicaid admissions.

Source: CMS Penalties Database

No penalties in the past 3 years

No civil money penalties or payment denials were reported in the last 3 years.

Quality of care over time

These measures show how residents usually do over time at this home, based on health outcomes and preventive care.

High-risk clinical events score Info A composite score based on pressure ulcers, falls with injury, weight loss, walking ability decline, and activities of daily living decline. 3.7
44% better than California average

California average: 6.6

Functional decline score Info A composite score based on activities of daily living decline, walking ability decline, and incontinence. 4.7
58% better than California average

California average: 11.3

Long-stay resident measures
Significantly above average Info CMS star rating based on long-stay quality measure performance. 5 stars = significantly above average, 1 star = significantly below average.
Need for Help with Daily Activities Increased Info Percent of long-stay residents whose need for help with daily activities has increased 5.2%
53% better than California average

California average: 11.1%

Walking Ability Worsened Info Percent of long-stay residents whose ability to move independently worsened 6.4%
46% better than California average

California average: 12.0%

Low Risk Residents with Bowel/Bladder Incontinence Info Percent of low risk long-stay residents who lose control of their bowels or bladder 2.5%
78% better than California average

California average: 11.3%

Falls with Major Injury Info Percent of long-stay residents experiencing one or more falls with major injury 1.4%
18% better than California average

California average: 1.7%

High Risk Residents with Pressure Ulcers Info Percent of long-stay high risk residents with pressure ulcers 2.8%
44% better than California average

California average: 5.0%

Urinary Tract Infection Info Percent of long-stay residents with a urinary tract infection 0.0%
100% better than California average

California average: 1.2%

Lost Too Much Weight Info Percent of long-stay residents who lose too much weight 2.7%
36% better than California average

California average: 4.2%

Depressive Symptoms Info Percent of long-stay residents who have depressive symptoms 3.3%
51% better than California average

California average: 6.7%

Antipsychotic Use Info Percent of long-stay residents who received an antipsychotic medication 9.5%
6% better than California average

California average: 10.1%

Pneumococcal Vaccine Info Percent of long-stay residents assessed and appropriately given the pneumococcal vaccine 100.0%
In line with California average

California average: 98.5%

Influenza Vaccine Info Percent of long-stay residents assessed and appropriately given the seasonal influenza vaccine 100.0%
In line with California average

California average: 98.2%

Hospitalizations per 1,000 days Info Number of hospitalizations per 1,000 long-stay resident days. 1.06
53% better than California average

California average: 2.25

ED visits per 1,000 days Info Number of outpatient emergency department visits per 1,000 long-stay resident days. 1.08
32% better than California average

California average: 1.59

Short-stay resident measures
Average Info CMS star rating based on short-stay quality measure performance. 5 stars = much above average, 1 star = much below average.
Pneumococcal Vaccine Info Percent of short-stay residents assessed and appropriately given the pneumococcal vaccine 100.0%
6% better than California average

California average: 94.0%

Antipsychotic medication increase Info Percent of short-stay residents who newly received an antipsychotic medication 1.2%
18% better than California average

California average: 1.5%

Influenza Vaccine Info Percent of short-stay residents assessed and appropriately given the seasonal influenza vaccine 100.0%
7% better than California average

California average: 93.2%

Re-hospitalized after SNF stay Info Percentage of short-stay residents who were re-hospitalized after their nursing home admission. 18.4%
21% better than California average

California average: 23.2%

Emergency department visits Info Percentage of short-stay residents who had an outpatient emergency department visit. 10.3%
8% better than California average

California average: 11.2%

Falls with major injury Info Percentage of SNF residents who experience falls with major injury during their stay. 1.2%
52% worse than California average

California average: 0.8%

Ability to care for self at discharge Info Percentage of residents at or above expected ability to care for themselves at discharge. 55.4%
In line with California average

California average: 53.7%

Successful return to home or community Info Rate of successful return to home or community from a skilled nursing facility. 45.6%
10% worse than California average

California average: 50.6%

Breakdown by payment type

Medicare

22% of new residents, usually for short-term rehab.

Typical stay 1 - 2 months

Private pay

73% of new residents, often for short stays.

Typical stay 27 days

Medicaid

4% of new residents, often for long-term daily care.

Typical stay 4 - 5 years

Facility Characteristics

Source: CMS Long-Term Care Facility Characteristics (Data as of Jan 2026)

Total residents 223
Medicare
50
22.4% of residents
Medicaid
169
75.8% of residents
Private pay or other
4
1.8% of residents
Programs & Services
Residents Group

Residents meet regularly to discuss policies, care quality, and activities

Active Resident Council

Organized group of residents that meets regularly to discuss facility policies, quality of life, and activities.

Finances and operations

Privately-owned community
Operated by a single business entity.
Home revenue
$46.1M
Profit
$4.1M
Privately-owned community Operated by a single business entity.
Home revenue
$46.1M Rank #12 / 346Revenue — State benchmarkedThis home is ranked 12th out of 346 homes in California. Shows this facility's annual revenue compared to the California average. Higher revenue generally means more resources for staffing and capital — read alongside Payroll %.Click the rank badge to see the full State ranking.Click here to see the full State ranking.
Profit
$4.1M
Payroll costs Info The portion of the home's budget spent on staff, including nurses, caregivers, and other employees who support care and operations. Rank #3 / 346Payroll — State benchmarkedThis home is ranked 3rd out of 346 homes in California. Shows total annual staff payroll benchmarked to the California average. Higher payroll investment relative to peers often signals better staffing and less reliance on cheaper contract labor.Click the rank badge to see the full State ranking.Click here to see the full State ranking.
$26.9M
58.2% of revenue Rank #84 / 346Payroll % — State benchmarkedThis home is ranked 84th out of 346 homes in California. Shows payroll as a percentage of revenue versus the California average. Well-run California facilities typically land around 56–67% — the top third Statewide. Below 25% may signal understaffing or heavy agency use — read with Staffing ratings.Click the rank badge to see the full State ranking.Click here to see the full State ranking.
Other operating costs Info All remaining costs needed to run the home, such as food, utilities, building maintenance, supplies and administrative expenses.
$15.2M
Total costs $42.0M

What does this home offer?

Building type icon
Building type icon

Building Type: Single-story

On-site medical care and health services icon

On-site Medical Care and Health Services

Rehabilitative support icon

Rehabilitative Support

Beauty services icon

Beauty Services

Social and recreational activities icon

Social and Recreational Activities

Who this home usually serves

TYPE OF STAY

Primarily short stays

Residents typically stay for brief periods, with frequent admissions and discharges throughout the year.

Places of interest near Westwood Post-Acute

Address 9.9 miles from city center Info Estimated distance in miles from San Jose's city center to Westwood Post-Acute's address, calculated via Google Maps.

Calculate Travel Distance to Westwood Post-Acute

Add your location

Address

Financial Assistance for
Nursing Home in California

Westwood Post-Acute is located in San Jose, California.
Here are the financial assistance programs available to residents in California.

Get Financial aid guidance

Multipurpose Senior Services Program

MSSP (Medi-Cal Waiver)

Age 65+
General California resident, Medi-Cal eligible, nursing home risk.
Income Limits (2025) ~$2,829/month 300% FBR, individual
Asset Limits $2,000 (individual), $3,000 (couple).
CA

County-managed; waitlists possible.

Benefits
In-home support (4-6 hours/day) Respite care (14 days/year) Meals (~$6/meal) Transportation (8 trips/month) Care management

In-Home Supportive Services (IHSS)

California IHSS

Age 65+
General California resident, Medicaid-eligible or low-income.
Income Limits ~$1,732/month individual, Medi-Cal threshold
Asset Limits $2,000 individual
CA

Can hire family as caregivers.

Benefits
Personal care (up to 283 hours/month) Homemaker services Respite (varies)

Multipurpose Senior Services Program (MSSP)

CA MSSP

Age 65+
General California resident, Medi-Cal-eligible, nursing home-eligible but community-capable.
Income Limits ~$2,829/month 300% FBR, individual
Asset Limits $2,000 individual
CA

Available in 38 counties; waitlists common.

Benefits
Case management Respite care (up to 10 days/year) Minor home mods (avg. $500) Adult day care (~$50/day)

Property Tax Postponement Program (PTP)

CA PTP

Age 62+
General California resident, own and live in home, 40% equity.
Income Limits (2025) ~$51,500/year household, adjusted annually
Asset Limits Equity-based; no strict asset cap.
CA

Deferred taxes accrue interest (5% as of 2024); repaid upon sale/death.

Benefits
Property tax deferral (avg. $1,000-$3,000/year, varies by county)

Assisted Living Waiver (ALW)

CA ALW

Age 65+ or disabled
General California resident, Medi-Cal-eligible, nursing home-eligible.
Income Limits ~$2,829/month 300% FBR, individual
Asset Limits $2,000 individual
CA

Available in 15 counties (e.g., LA, Sacramento); waitlists common.

Benefits
Personal care in ALFs (5-7 hours/day) Medication management Social services

California CARES Program

CA CARES

Age
General Caregivers of California residents 60+ needing help with 3+ daily activities; no caregiver age limit.
Income Limits No strict limit; cost-sharing above ~$2,500/month threshold.
Asset Limits Not applicable; need-based.
CA

High demand in urban areas; complements IHSS respite.

Benefits
Respite care (up to 10 days/year) Counseling (4-6 sessions/year) Training (2-3 workshops/year) Supplies (~$200/year)

Compare Nursing Home around Cupertino

The information below is reported by the California Department of Social Services and Department of Public Health.

3 facilities compared · CMS & CA Dept. of Health data

Westwood Post-Acute
NH

Nursing Home Licensed facility providing 24/7 skilled nursing care for residents with complex, ongoing medical needs. Staffed by RNs, LPNs, and CNAs. Inspected and star-rated annually by CMS. Accepts Medicare (short-term rehab) and Medicaid (long-term care).

MC

Memory Care Secured, specialized care for people living with Alzheimer's or dementia. Staff trained in cognitive impairment, with higher staff-to-resident ratios and an environment designed to reduce confusion and wandering risk.

RC

Respite Care Short-term temporary care — days to weeks — to give family caregivers a break. Full care provided during the stay. Often used after hospitalization or to trial a facility before a permanent placement decision.

San Jose
258
Facility 258
CA AVG 103
Rank #81 / 1657
--
3.69
Facility 3.69
CA AVG 4.22
Rank #238 / 345
+47%-12%
$0
Facility $0
CA AVG $56.5k
Rank #1 / 352
-
88
Facility 88
CA AVG 50.2
Rank #314 / 352
4.0
Facility 4.0
CA AVG 4.6
Rank #163 / 352
-249
67
Facility 67
CA AVG 57
Rank #830 / 2092
James Morales
$46.1M
Facility $46.1M
CA AVG $17.0M
Rank #12 / 346
$26.9M
Facility $26.9M
CA AVG $7.0M
Rank #3 / 346
58.2%
Facility 58.2%
CA AVG 45.2%
Rank #84 / 346
55750
Cupertino Healthcare & Wellness
NH

Nursing Home Licensed facility providing 24/7 skilled nursing care for residents with complex, ongoing medical needs. Staffed by RNs, LPNs, and CNAs. Inspected and star-rated annually by CMS. Accepts Medicare (short-term rehab) and Medicaid (long-term care).

Cupertino
170
Facility 170
CA AVG 103
Rank #256 / 1657
--
3.71
Facility 3.71
CA AVG 4.22
Rank #238 / 345
+48%-12%
$0
Facility $0
CA AVG $56.5k
Rank #299 / 352
-
83
Facility 83
CA AVG 50.2
Rank #304 / 352
3.2
Facility 3.2
CA AVG 4.6
Rank #77 / 352
5161
43
Facility 43
CA AVG 57
Rank #1505 / 2092
-
$47.2M
Facility $47.2M
CA AVG $17.0M
Rank #9 / 346
$15.6M
Facility $15.6M
CA AVG $7.0M
Rank #24 / 346
33.1%
Facility 33.1%
CA AVG 45.2%
Rank #322 / 346
55407
Sunnyvale Post-Acute Center
NH

Nursing Home Licensed facility providing 24/7 skilled nursing care for residents with complex, ongoing medical needs. Staffed by RNs, LPNs, and CNAs. Inspected and star-rated annually by CMS. Accepts Medicare (short-term rehab) and Medicaid (long-term care).

Sunnyvale (South Bernardo Avenue)
99
Facility 99
CA AVG 103
Rank #725 / 1657
95.4%
Facility 95.4%
CA AVG 84.7%
Rank #185 / 1530
+13%
3.49
Facility 3.49
CA AVG 4.22
Rank #288 / 345
-8%-17%
$0
Facility $0
CA AVG $56.5k
Rank #1 / 352
-
68
Facility 68
CA AVG 50.2
Rank #286 / 352
5.2
Facility 5.2
CA AVG 4.6
Rank #251 / 352
-96
49
Facility 49
CA AVG 57
Rank #1370 / 2092
Mehran Jamali
$27.5M
Facility $27.5M
CA AVG $17.0M
Rank #75 / 346
$10.0M
Facility $10.0M
CA AVG $7.0M
Rank #121 / 346
36.6%
Facility 36.6%
CA AVG 45.2%
Rank #300 / 346
555792

Frequently Asked Questions about Westwood Post-Acute

Is Westwood Post-Acute in a walkable area?

Westwood Post-Acute has a walk score of 67. Moderately walkable. Some errands can be accomplished on foot, with a mix of nearby amenities.

Are there photos of Westwood Post-Acute?

Yes — there are 15 photos of Westwood Post-Acute in the photo gallery on this page.

What is the address of Westwood Post-Acute?

Westwood Post-Acute is located at 1601 Petersen Ave, San Jose, CA 95129.

What is the phone number of Westwood Post-Acute?

(408) 253-7502 will put you in contact with the team at Westwood Post-Acute.

Is Westwood Post-Acute Medicare or Medicaid certified?

Yes — Westwood Post-Acute is a CMS-certified provider of Medicare and Medicaid.

Guides for Better Senior Living

Care Cost Calculator: See Prices in Your Area

Nursing Home Data Explorer

Don’t Wait Too Long: 7 Red Flag Signs Your Parent Needs Assisted Living Now

The True Cost of Assisted Living in 2025 – And How Families Are Paying For It

Understanding Senior Living Costs: Pricing Models, Discounts & Financial Assistance

Explore Open Rooms
1 Contact details
2 What type of senior care service are you looking for?
3 What budget do you have in mind for senior care?
4 How soon do you need to find care?
5 Additional details

Thank you for your interest!

Our team will be in touch shortly to help with next steps.