White Blossom Care Center
Nursing Home · San Jose, CA
CMS overall rating Info The Overall CMS Rating is scored from 1 to 5 stars and combines results from health inspections, staffing levels, and quality measures. Health inspections carry the most weight. Staffing and quality scores can increase or decrease the final rating based on performance compared to state and national standards.

White Blossom Care Center

Nursing Home · San Jose, CA
CMS overall rating Info The Overall CMS Rating is scored from 1 to 5 stars and combines results from health inspections, staffing levels, and quality measures. Health inspections carry the most weight. Staffing and quality scores can increase or decrease the final rating based on performance compared to state and national standards.
Calculator: See prices in your area
White Blossom Care Center accepts Medicare and private pay.

Overview of White Blossom Care Center

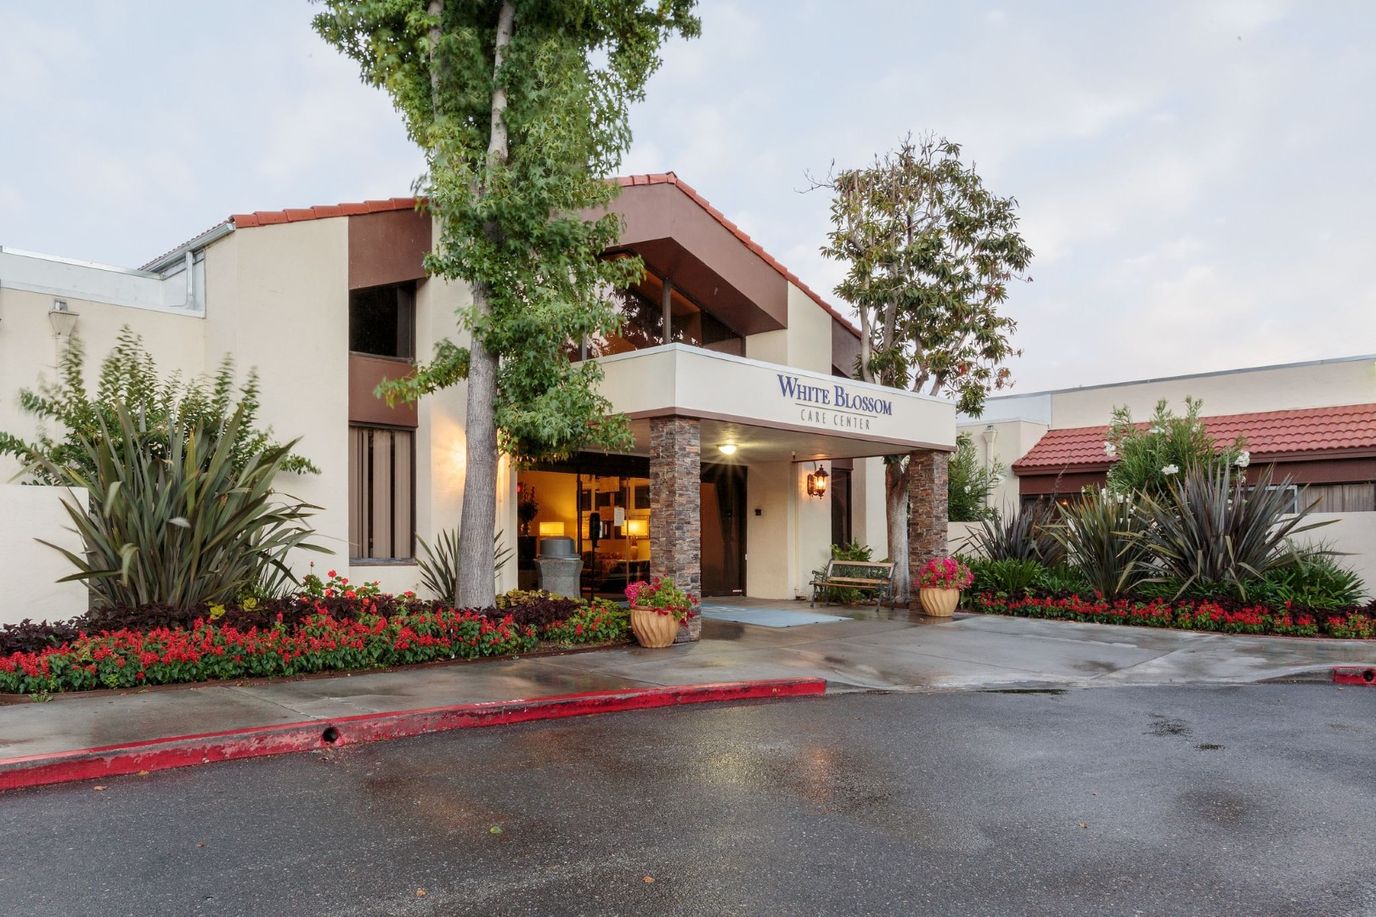
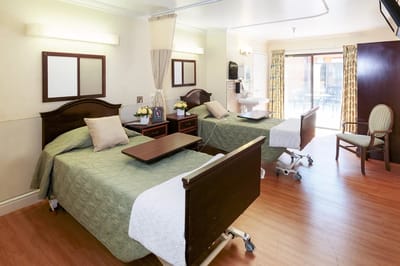
White Blossom Care Center’s focus on safety is unparalleled, and they take all necessary precautions to ensure that both residents and visitors are protected. This includes strict visitation policies, personal protective equipment, regular cleaning and disinfecting, and daily testing. Conveniently located in San Jose, the center offers a wide range of services to cater to their residents’ diverse needs, including short-term rehabilitation, 24-hour skilled nursing, outpatient therapy, wound care, and palliative care. Their state-of-the-art rehab gym facility is one of their standout features, equipped with modern equipment and resources to aid residents in their recovery process.
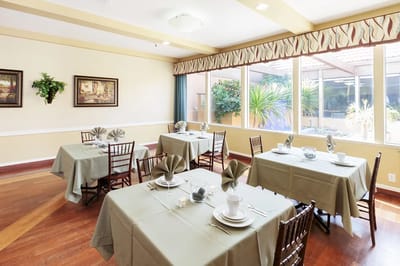
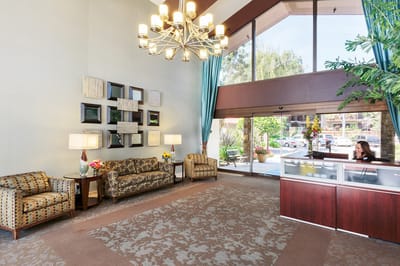
The home also takes pride in their restaurant-style dining experience, which offers residents delicious meals in an elegant and comfortable setting. Their common areas are also thoughtfully designed, featuring timeless style and formal elements that create a serene and calming environment. A variety of insurances is also accepted, making quality healthcare accessible to everyone. If you’re looking for a center that goes above and beyond to ensure that everyone feels safe, comfortable, and valued in their golden years, White Blossom Care Center is one of the best facilities out there.

(408) 998-8447

Quality ratings

Measured by Centers for Medicare & Medicaid Services (CMS)

Overall rating Info The Overall CMS Rating combines results from health inspections, staffing levels and quality measures. Health inspections carry the most weight. Staffing and quality scores can increase or decrease the final rating based on performance compared to state and national standards.
▲ 27.0% Above CA avg. ▲ 27.0% Above CA avg.Click the badge to see the full State ranking.Click here to see the full State ranking.
Health Inspection Info Based on the results of the facility's three most recent standard inspections and any complaint investigations. CMS reviews the number, scope, and severity of deficiencies, with more recent findings weighted more heavily.
▲ 7.3% Above CA avg. ▲ 7.3% Above CA avg.Click the badge to see the full State ranking.Click here to see the full State ranking.
Staffing Info Measures average nursing staff hours per resident per day, including Registered Nurses (RNs) and total nursing staff. Ratings are adjusted based on the level of care residents require and are compared to state and national benchmarks.
▼ 36.3% Below CA avg. ▼ 36.3% Below CA avg.Click the badge to see the full State ranking.Click here to see the full State ranking.
Quality Measures Info Based on clinical and physical health indicators reported to CMS, such as hospital readmissions, falls, pressure ulcers, and improvements in mobility. These measures reflect how well residents' health needs are being managed.
▲ 22.4% Above CA avg. ▲ 22.4% Above CA avg.Click the badge to see the full State ranking.Click here to see the full State ranking.

Staffing hours breakdown

Info Daily nursing hours per resident by staff type, reported to CMS. Higher is generally better — compare this facility to state and national averages to see where staffing stands.

Hours per resident per day — compared to California state averages

Total nursing care / resident Info This home is ranked 289th out of 346 homes in California. Total adjusted nursing hours per resident per day, combining RN, LPN, and aide time. CMS adjusts this for case-mix so facilities can be fairly compared.
3h 31m per day
Rank #289 / 346Nurse hours — State benchmarkedThis home is ranked 289th out of 346 homes in California. Shows adjusted nurse hours per resident per day benchmarked to the California average, with a ranking across 346 California SNFs. More hours mean more direct care. The national average is about 3.5 hrs; below 3.0 is a red flag.Click the rank badge to see the full State ranking.Click here to see the full State ranking.
This facility California avg (4h 13m per day)
vs California avg
-17%

5 of 6 metrics below state avg

Standout metric Physical Therapist is +20% above state avg
Staff typeHours / Day / Residentvs state avg
Registered Nurse (RN) Info RNs hold the highest nursing license and can assess residents, interpret test results, and direct care plans. More RN hours per day often signals stronger clinical oversight and faster response to health changes. 37m per day ▼ 5% State avg: 39m per day · National avg: 41m per day
LPN / LVN Info Licensed Practical Nurses (LPNs) or Licensed Vocational Nurses (LVNs) deliver routine hands-on care — medication administration, wound dressing, and monitoring vital signs. They work under RN supervision and make up a large share of daily bedside care. 55m per day ▼ 25% State avg: 1h 13m per day · National avg: 52m per day
Nurse Aide Info Certified Nurse Aides (CNAs) provide the most direct day-to-day assistance: bathing, dressing, feeding, and mobility. Nurse aide hours are typically the largest staffing category and directly affect residents' quality of life. 2h 32m per day ▼ 4% State avg: 2h 39m per day · National avg: 2h 21m per day
Total Nursing (Weekend) Info Combined nursing hours (RN + LPN + Nurse Aide) per resident per day on weekends. Staffing often drops on weekends — this figure reveals whether the facility maintains adequate coverage outside of weekday hours. 3h 34m per day ▼ 13% State avg: 4h 5m per day · National avg: 3h 26m per day
Physical Therapist Info Hours per resident per day provided by licensed Physical Therapists (PTs) or PT Assistants. PT services help residents recover mobility after injury or illness and are especially important for post-acute (short-stay) rehabilitation. 6m per day ▲ 20% State avg: 5m per day · National avg: 4m per day
RN (Weekend) Info Registered nurse hours specifically on weekends. Facilities sometimes reduce RN presence on Saturdays and Sundays — a low weekend RN figure compared to weekday hours can indicate reduced clinical oversight when most administrative staff are absent. 27m per day ▼ 10% State avg: 30m per day · National avg: 29m per day

Types of Care at White Blossom Care Center

Nursing Home

Capacity and availability

This home is often near full

Occupancy higher than 95% suggests steady demand, but availability may be limited.

Higher occupancy than the California average: 84.7%
Occupancy rate 97.8% Rank #13 / 351Occupancy rate — State benchmarkedThis home is ranked 13th out of 351 homes in California. Shows this facility's occupancy rate versus the California average, with its Statewide rank out of 351. Higher occupancy signals strong local demand and financial stability.Click the rank badge to see the full State ranking.Click here to see the full State ranking.
Avg. Length of Stay 72 days
Occupancy rate
97.8% Rank #13 / 351Occupancy rate — State benchmarkedThis home is ranked 13th out of 351 homes in California. Shows this facility's occupancy rate versus the California average, with its Statewide rank out of 351. Higher occupancy signals strong local demand and financial stability.Click the rank badge to see the full State ranking.Click here to see the full State ranking.
Avg. Length of Stay
72 days
Walk Score
Walk Score: 63 / 100 Rank #189 / 359Walk Score — State benchmarkedThis home is ranked 189th out of 359 homes in California. Shows how walkable this facility's neighborhood is compared to the average Walk Score across California SNFs. Higher scores benefit residents, families, and staff.Click the rank badge to see the full State ranking.Click here to see the full State ranking.
Moderately walkable. Some errands can be accomplished on foot, with a mix of nearby amenities.

About this community

License Details

Therapy & Rehabilitation

2 services
Rehabilitation Services
Short-Term Rehab

Staffing & Medical

1 service
24-Hour Staffing

Amenities & Lifestyle

Expansive Rehab Gym
Spacious Courtyards & Common Areas
24/7 Nursing Care
Specific ProgramsShort-Term Rehabilitation, 24-Hour Skilled Nursing, Outpatient Therapy, Palliative Care
Operating HoursMonday – Friday: 8 am – 6 pm, Weekends: 10 am – 6 pm

Contact White Blossom Care Center

Staffing Data

Reporting period: October 1 – December 31, 2025 (Q4 2025). Source: CMS Payroll-Based Journal report.

Total staff 374
Employees 223
Contractors 151
Staff to resident ratio 2.60:1
2597122% better than California average
California average ratio: 0.00:1 California average ratio: 0.00:1See full California ranking
Avg staff/day 97
Average shift 7.4 hours
0% compared with California average
California average: 7.7 hours California average shift: 7.7 hoursSee full California ranking
Total staff hours (quarter) 66,193

Nursing staff breakdown

Q4 2025 · Oct 1 – Dec 31 More info This data comes from the CMS Payroll-Based Journal report covering October 1 – December 31, 2025.
Registered Nurse

Manages medical care and health needs.

Total count 29
Average shift length Info Average shift length. Calculated as total hours divided by days worked and average staff per day. 7.7 hours

This role is partially covered by contractors.

Licensed Practical Nurse

Assists with medical care and medications.

Total count 100
Average shift length Info Average shift length. Calculated as total hours divided by days worked and average staff per day. 7.5 hours

This role is partially covered by contractors.

Certified Nursing Assistant

Helps with daily care and mobility.

Total count 202
Average shift length Info Average shift length. Calculated as total hours divided by days worked and average staff per day. 7.4 hours

This role is partially covered by contractors.

Contractor staffing

Q4 2025 · Oct 1 – Dec 31 More info This data comes from the CMS Payroll-Based Journal report covering October 1 – December 31, 2025.

Total hours from contractors

5.4%

3,589 contractor hours this quarter

Certified Nursing Assistant: 85 Licensed Practical Nurse: 62 Feeding Assistant: 2 Registered Nurse: 1 Medical Director: 1

Staff by category

Q4 2025 · Oct 1 – Dec 31 More info This data comes from the CMS Payroll-Based Journal report covering October 1 – December 31, 2025.
Certified Nursing Assistant1178520234,51792100%7.4
Licensed Practical Nurse386210012,95392100%7.5
Registered Nurse281296,21592100%7.7
Physical Therapy Assistant9092,5258491%6.7
Dental Services Staff4041,5717885%7.8
Other Dietary Services Staff4041,4719199%7.2
Respiratory Therapy Technician7071,4497683%6.9
RN Director of Nursing5051,2027278%7.5
Speech Language Pathologist2029546773%7.7
Feeding Assistant02273692100%8
Administrator1015126470%8
Nurse Practitioner1015126470%8
Occupational Therapy Aide1015046368%8
Qualified Social Worker3034146166%6.8
Physical Therapy Aide2023505257%6.7
Medical Director0111604043%4
Clinical Nurse Specialist1011501820%8.3
202 Certified Nursing Assistant
% of Days 100%
100 Licensed Practical Nurse
% of Days 100%
29 Registered Nurse
% of Days 100%
9 Physical Therapy Assistant
% of Days 91%
4 Dental Services Staff
% of Days 85%
4 Other Dietary Services Staff
% of Days 99%
7 Respiratory Therapy Technician
% of Days 83%
5 RN Director of Nursing
% of Days 78%
2 Speech Language Pathologist
% of Days 73%
2 Feeding Assistant
% of Days 100%
1 Administrator
% of Days 70%
1 Nurse Practitioner
% of Days 70%
1 Occupational Therapy Aide
% of Days 68%
3 Qualified Social Worker
% of Days 66%
2 Physical Therapy Aide
% of Days 57%
1 Medical Director
% of Days 43%
1 Clinical Nurse Specialist
% of Days 20%

Penalties and fines

Includes penalties issued in 2024

Federal penalties imposed by CMS for regulatory violations, including civil money penalties (fines) and denials of payment for new Medicare/Medicaid admissions.

Source: CMS Penalties Database (Data as of Jan 2026)

Total fines amount $73K Rank #331 / 354Federal fines — State benchmarkedThis home is ranked 331st out of 354 homes in California. Shows this facility's cumulative CMS federal fine dollars versus the California average among facilities with fines, and where it ranks among 354 skilled nursing facilities in the pool. Lower total dollars mean a better rank.Click the rank badge to see the full State ranking.Click here to see the full State ranking.
34% higher than California average

California average: $55K

Number of fines 1
58% fewer fines than California average

California average: 2.4

Payment Denials Info Serious action where Medicare and/or Medicaid temporarily stops payments for new residents until issues are fixed. 0
100% fewer payment denials than California average

California average: 0.5

Fines amount comparison
This facility $73K
California average $55K
Penalty History

Penalties are imposed by CMS for violations of federal nursing home regulations.

1 penalty in the past 3 years

Feb 8, 2024 · $73K

Civil Money Penalty Info Fines imposed for noncompliance, which can be assessed per day or per instance of violation. Feb 8, 2024
$73K

Last updated: Jan 2026

Quality of care over time

These measures show how residents usually do over time at this home, based on health outcomes and preventive care.

High-risk clinical events score Info A composite score based on pressure ulcers, falls with injury, weight loss, walking ability decline, and activities of daily living decline. 2.2
67% better than California average

California average: 6.6

Functional decline score Info A composite score based on activities of daily living decline, walking ability decline, and incontinence. 3.5
69% better than California average

California average: 11.3

Long-stay resident measures
Significantly above average California avg: 4.2 Info CMS star rating based on long-stay quality measure performance. 5 stars = significantly above average, 1 star = significantly below average.
Need for Help with Daily Activities Increased Info Percent of long-stay residents whose need for help with daily activities has increased 2.7%
75% better than California average

California average: 11.1%

Walking Ability Worsened Info Percent of long-stay residents whose ability to move independently worsened 1.7%
86% better than California average

California average: 12.0%

Low Risk Residents with Bowel/Bladder Incontinence Info Percent of low risk long-stay residents who lose control of their bowels or bladder 6.0%
47% better than California average

California average: 11.3%

Falls with Major Injury Info Percent of long-stay residents experiencing one or more falls with major injury 0.0%
100% better than California average

California average: 1.7%

High Risk Residents with Pressure Ulcers Info Percent of long-stay high risk residents with pressure ulcers 6.2%
25% worse than California average

California average: 5.0%

Urinary Tract Infection Info Percent of long-stay residents with a urinary tract infection 0.0%
100% better than California average

California average: 1.2%

Lost Too Much Weight Info Percent of long-stay residents who lose too much weight 0.3%
94% better than California average

California average: 4.2%

Depressive Symptoms Info Percent of long-stay residents who have depressive symptoms 5.8%
14% better than California average

California average: 6.7%

Antipsychotic Use Info Percent of long-stay residents who received an antipsychotic medication 6.3%
38% better than California average

California average: 10.1%

Pneumococcal Vaccine Info Percent of long-stay residents assessed and appropriately given the pneumococcal vaccine 100.0%
In line with California average

California average: 98.5%

Influenza Vaccine Info Percent of long-stay residents assessed and appropriately given the seasonal influenza vaccine 100.0%
In line with California average

California average: 98.2%

Hospitalizations per 1,000 days Info Number of hospitalizations per 1,000 long-stay resident days. 1.83
19% better than California average

California average: 2.25

ED visits per 1,000 days Info Number of outpatient emergency department visits per 1,000 long-stay resident days. 0.99
38% better than California average

California average: 1.59

Short-stay resident measures
Significantly above average California avg: 3.5 Info CMS star rating based on short-stay quality measure performance. 5 stars = much above average, 1 star = much below average.
Pneumococcal Vaccine Info Percent of short-stay residents assessed and appropriately given the pneumococcal vaccine 100.0%
6% better than California average

California average: 94.0%

Antipsychotic medication increase Info Percent of short-stay residents who newly received an antipsychotic medication 0.2%
84% better than California average

California average: 1.5%

Influenza Vaccine Info Percent of short-stay residents assessed and appropriately given the seasonal influenza vaccine 98.8%
6% better than California average

California average: 93.2%

Re-hospitalized after SNF stay Info Percentage of short-stay residents who were re-hospitalized after their nursing home admission. 17.7%
24% better than California average

California average: 23.2%

Emergency department visits Info Percentage of short-stay residents who had an outpatient emergency department visit. 10.1%
10% better than California average

California average: 11.2%

Falls with major injury Info Percentage of SNF residents who experience falls with major injury during their stay. 0.0%
100% better than California average

California average: 0.8%

Ability to care for self at discharge Info Percentage of residents at or above expected ability to care for themselves at discharge. 82.6%
54% better than California average

California average: 53.7%

Successful return to home or community Info Rate of successful return to home or community from a skilled nursing facility. 52.9%
5% better than California average

California average: 50.6%

Breakdown by payment type

Medicare

42% of new residents, usually for short-term rehab.

Typical stay 24 days

Private pay

58% of new residents, often for short stays.

Typical stay 2 - 3 months

Facility Characteristics

Source: CMS Long-Term Care Facility Characteristics (Data as of Jan 2026)

Total residents 144
Medicare
33
22.9% of residents
Medicaid
88
61.1% of residents
Private pay or other
23
16% of residents
Programs & Services
Residents Group

Residents meet regularly to discuss policies, care quality, and activities

Active Resident Council

Organized group of residents that meets regularly to discuss facility policies, quality of life, and activities.

Finances and operations

Privately-owned community
Home revenue
$40.5M
Profit
$3.9M
Privately-owned community
Home revenue
$40.5M Rank #23 / 347Revenue — State benchmarkedThis home is ranked 23rd out of 347 homes in California. Shows this facility's annual revenue compared to the California SNF average. Higher revenue generally means more resources for staffing and capital — read alongside Payroll %.Click the rank badge to see the full State ranking.Click here to see the full State ranking.
Profit
$3.9M
Payroll costs Info The portion of the home's budget spent on staff, including nurses, caregivers, and other employees who support care and operations. Rank #26 / 347Payroll — State benchmarkedThis home is ranked 26th out of 347 homes in California. Shows total annual staff payroll benchmarked to the California average. Higher payroll investment relative to peers often signals better staffing and less reliance on cheaper contract labor.Click the rank badge to see the full State ranking.Click here to see the full State ranking.
$15.1M
37.4% of revenue Rank #294 / 347Payroll % — State benchmarkedThis home is ranked 294th out of 347 homes in California. Shows payroll as a percentage of revenue versus the California average. Well-run California SNFs typically land around 56–67% — the top third Statewide. Below 25% may signal understaffing or heavy agency use — read with Staffing ratings.Click the rank badge to see the full State ranking.Click here to see the full State ranking.
Other operating costs Info All remaining costs needed to run the home, such as food, utilities, building maintenance, supplies and administrative expenses.
$21.5M
Total costs $36.6M

Who this home usually serves

TYPE OF STAY

Mix of rehab and long-term care

This home supports both short-term rehab and long-term care, with residents staying for a wide range of durations.

Places of interest near White Blossom Care Center

Address 4.0 miles from city center Info Estimated distance in miles from San Jose's city center to White Blossom Care Center's address, calculated via Google Maps. — 1.32 miles to nearest hospital (SOAR)

Calculate Travel Distance to White Blossom Care Center

Add your location

Address

Financial Assistance for
Nursing Home in California

White Blossom Care Center is located in San Jose, California.
Here are the financial assistance programs available to residents in California.

Get Financial aid guidance

Multipurpose Senior Services Program

MSSP (Medi-Cal Waiver)

Age 65+
General California resident, Medi-Cal eligible, nursing home risk.
Income Limits (2025) ~$2,829/month 300% FBR, individual
Asset Limits $2,000 (individual), $3,000 (couple).
CA

County-managed; waitlists possible.

Benefits
In-home support (4-6 hours/day) Respite care (14 days/year) Meals (~$6/meal) Transportation (8 trips/month) Care management

In-Home Supportive Services (IHSS)

California IHSS

Age 65+
General California resident, Medicaid-eligible or low-income.
Income Limits ~$1,732/month individual, Medi-Cal threshold
Asset Limits $2,000 individual
CA

Can hire family as caregivers.

Benefits
Personal care (up to 283 hours/month) Homemaker services Respite (varies)

Multipurpose Senior Services Program (MSSP)

CA MSSP

Age 65+
General California resident, Medi-Cal-eligible, nursing home-eligible but community-capable.
Income Limits ~$2,829/month 300% FBR, individual
Asset Limits $2,000 individual
CA

Available in 38 counties; waitlists common.

Benefits
Case management Respite care (up to 10 days/year) Minor home mods (avg. $500) Adult day care (~$50/day)

Property Tax Postponement Program (PTP)

CA PTP

Age 62+
General California resident, own and live in home, 40% equity.
Income Limits (2025) ~$51,500/year household, adjusted annually
Asset Limits Equity-based; no strict asset cap.
CA

Deferred taxes accrue interest (5% as of 2024); repaid upon sale/death.

Benefits
Property tax deferral (avg. $1,000-$3,000/year, varies by county)

Assisted Living Waiver (ALW)

CA ALW

Age 65+ or disabled
General California resident, Medi-Cal-eligible, nursing home-eligible.
Income Limits ~$2,829/month 300% FBR, individual
Asset Limits $2,000 individual
CA

Available in 15 counties (e.g., LA, Sacramento); waitlists common.

Benefits
Personal care in ALFs (5-7 hours/day) Medication management Social services

California CARES Program

CA CARES

Age
General Caregivers of California residents 60+ needing help with 3+ daily activities; no caregiver age limit.
Income Limits No strict limit; cost-sharing above ~$2,500/month threshold.
Asset Limits Not applicable; need-based.
CA

High demand in urban areas; complements IHSS respite.

Benefits
Respite care (up to 10 days/year) Counseling (4-6 sessions/year) Training (2-3 workshops/year) Supplies (~$200/year)

Compare Nursing Home around San Jose

The information below is reported by the California Department of Social Services and Department of Public Health.

5 facilities compared · CMS & CA Dept. of Health data

Filter by care type
Mission Skilled Nursing & Subacute Center
NH

Nursing Home Licensed facility providing 24/7 skilled nursing care for residents with complex, ongoing medical needs. Staffed by RNs, LPNs, and CNAs. Inspected and star-rated annually by CMS. Accepts Medicare (short-term rehab) and Medicaid (long-term care).

Santa Clara (Cory)133 84.4% 0%4.09 +85%-3%$0364.52118- 69 -$32.4M$13.5M41.9%55645
A Grace Subacute & Skilled Care
NH

Nursing Home Licensed facility providing 24/7 skilled nursing care for residents with complex, ongoing medical needs. Staffed by RNs, LPNs, and CNAs. Inspected and star-rated annually by CMS. Accepts Medicare (short-term rehab) and Medicaid (long-term care).

San Jose (Castlemont)166 66.6% -21%3.40 +103%-20%$0486.0-102A+ 74 Jason Adelman$28.2M$11.1M39.3%56376
White Blossom Care Center
NH

Nursing Home Licensed facility providing 24/7 skilled nursing care for residents with complex, ongoing medical needs. Staffed by RNs, LPNs, and CNAs. Inspected and star-rated annually by CMS. Accepts Medicare (short-term rehab) and Medicaid (long-term care).

San Jose (Del Mar)153 97.8% +15%3.52 -9%-17%$83.2k553.21145- 63 Robert Pierce$40.5M$15.1M37.4%555068
Empress Care Center
NH

Nursing Home Licensed facility providing 24/7 skilled nursing care for residents with complex, ongoing medical needs. Staffed by RNs, LPNs, and CNAs. Inspected and star-rated annually by CMS. Accepts Medicare (short-term rehab) and Medicaid (long-term care).

HC

Home Care Professional care delivered in the person's own home — from companionship and errands to skilled nursing and therapy. Allows seniors to age in place. Medicare covers skilled home health when medically necessary.

RC

Respite Care Short-term temporary care — days to weeks — to give family caregivers a break. Full care provided during the stay. Often used after hospitalization or to trial a facility before a permanent placement decision.

San Jose (Willow Glen)67 70.9% -16%4.51 -9%+7%$04411.0-48A+ 78 Cory Diebold$8.1M$5.1M62.4%56026
Almaden Health & Rehab Center
NH

Nursing Home Licensed facility providing 24/7 skilled nursing care for residents with complex, ongoing medical needs. Staffed by RNs, LPNs, and CNAs. Inspected and star-rated annually by CMS. Accepts Medicare (short-term rehab) and Medicaid (long-term care).

HC

Home Care Professional care delivered in the person's own home — from companionship and errands to skilled nursing and therapy. Allows seniors to age in place. Medicare covers skilled home health when medically necessary.

RC

Respite Care Short-term temporary care — days to weeks — to give family caregivers a break. Full care provided during the stay. Often used after hospitalization or to trial a facility before a permanent placement decision.

San Jose (Blossom Crest)77 91.2% +8%4.61 +9%+9%$0383.8-68- 68 Almaden Holding Company Gp LLC$15.9M$7.8M49.1%56058

Frequently Asked Questions about White Blossom Care Center

What neighborhood is White Blossom Care Center in?

White Blossom Care Center is in the Del Mar neighborhood.

Is White Blossom Care Center in a walkable area?

White Blossom Care Center has a walk score of 63. Moderately walkable. Some errands can be accomplished on foot, with a mix of nearby amenities.

What is the occupancy rate at White Blossom Care Center?

White Blossom Care Center's occupancy is 97.8%.

Are there photos of White Blossom Care Center?

Yes — there are 8 photos of White Blossom Care Center in the photo gallery on this page.

What is the phone number of White Blossom Care Center?

(408) 998-8447 will put you in contact with the team at White Blossom Care Center.

Is White Blossom Care Center Medicare or Medicaid certified?

Yes — White Blossom Care Center is a CMS-certified provider of Medicare and Medicaid.

Guides for Better Senior Living

Care Cost Calculator: See Prices in Your Area

Nursing Home Data Explorer

Don’t Wait Too Long: 7 Red Flag Signs Your Parent Needs Assisted Living Now

The True Cost of Assisted Living in 2025 – And How Families Are Paying For It

Understanding Senior Living Costs: Pricing Models, Discounts & Financial Assistance

Explore Open Rooms
1 Contact details
2 What type of senior care service are you looking for?
3 What budget do you have in mind for senior care?
4 How soon do you need to find care?
5 Additional details

Thank you for your interest!

Our team will be in touch shortly to help with next steps.