Memory Care Home

White Oak Manor Lancaster

Memory Care Home

White Oak Manor Lancaster

253 Craig Manor Rd, Lancaster, SC 29720 View map
Overview of White Oak Manor Lancaster

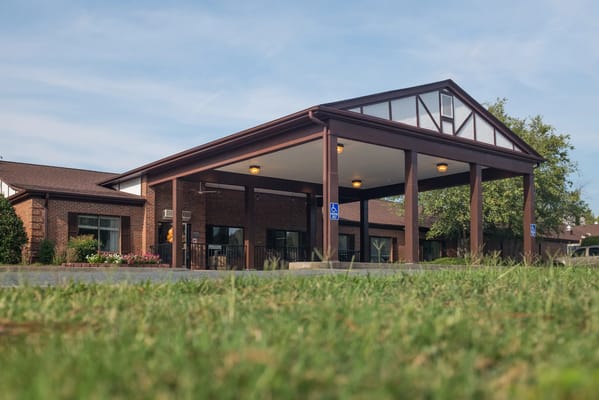
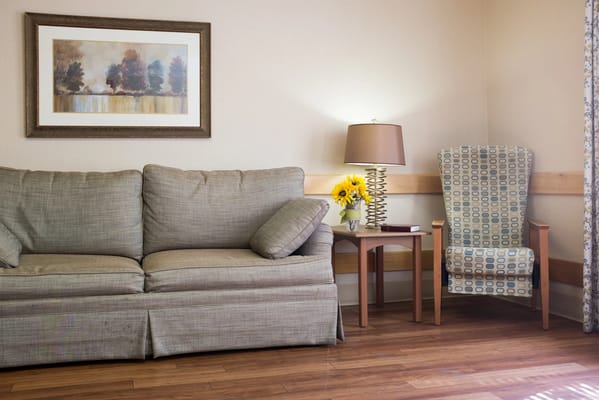
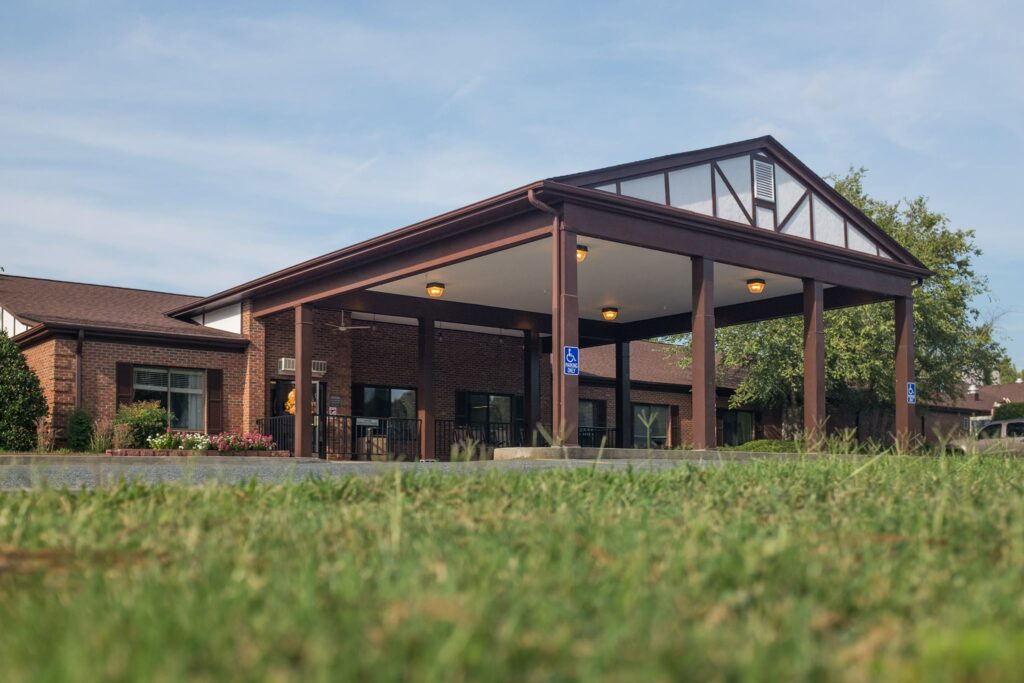
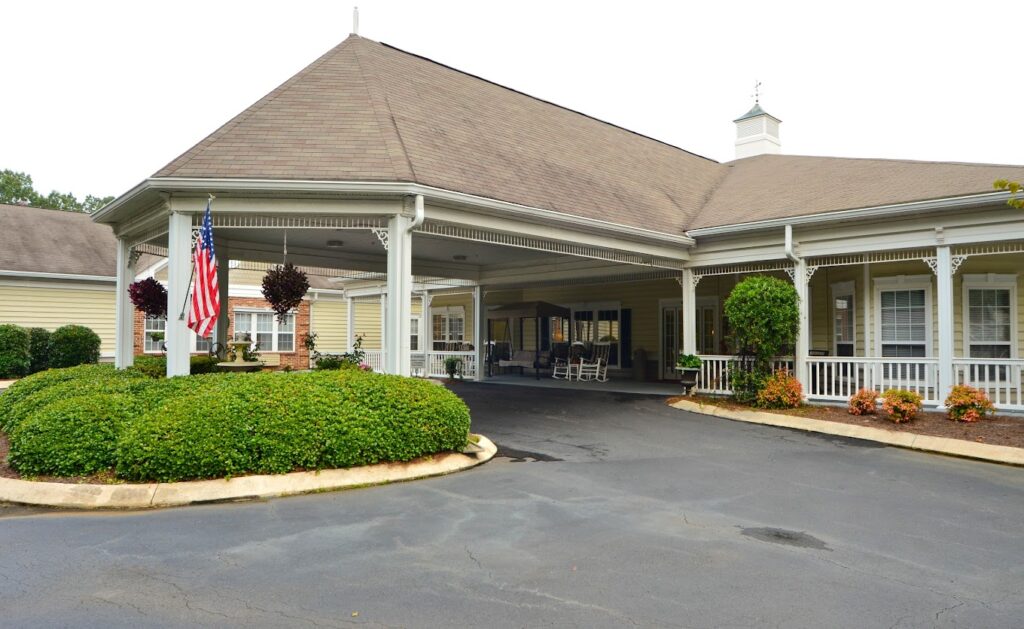
Set in a peaceful area in Lancaster, SC, White Oak Manor Lancaster is an inviting senior living community, offering long term nursing care, as well as short term rehabilitation. Featuring 132 units of comfortably designed accommodations, the community ensures every resident are provided with a living space that matches their needs. A team of registered nurses, licensed practical nurses, certified nursing assistants, physicians, and therapists work hand-in-hand in creating residents’ individualized care plans, ensuring they are provided with the care they need.

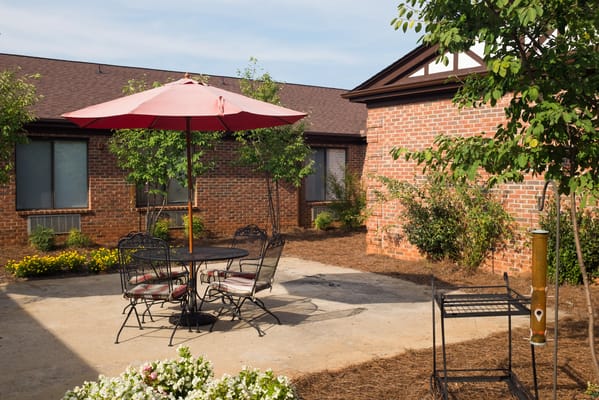
Thanks to the community’s prime location, residents also enjoy easy access to the city’s local amenities, including attractions, restaurants, shops, and parks that provide plenty of opportunities for recreation. Committed to enhancing residents’ overall quality of life, the community makes sure they are provided with services that cater to their overall needs. With its expansive services, residents of White Oak Manor Lancaster are guaranteed to enjoy a speedy recovery and comfortable living experience.

(803) 286-1464

Managed by Jeff Skinner

Administrator

Over 32 years

Jeff Skinner is the Administrator at White Oak Manor Lancaster. A Clemson University graduate, Jeff has over 32 years of experience as a nursing home administrator. He is a long-standing member and past chairman of the South Carolina Health Care Association. Jeff is dedicated to serving the residents and fostering a welcoming community.

Quality ratings

Measured by Centers for Medicare & Medicaid Services (CMS)

Overall rating Info Official CMS rating based on health inspections, staffing and quality measures.
4/5
South Carolina average: 2.9/5
Health Inspection Info Official CMS rating based on deficiencies found during state health inspections.
3/5
South Carolina average: 2.7/5
Staffing Info Official CMS rating based on nurse staffing hours per resident per day.
3/5
South Carolina average: 3.0/5
Quality Measures Info Official CMS rating based on clinical outcomes for residents.
5/5
South Carolina average: 3.5/5

Nursing care per resident

Info Average daily nursing hours per resident (adjusted for acuity). Higher values indicate more nursing time per resident.
3h 51m per day

This home provides 6% less nursing time per resident than the South Carolina average.

South Carolina average: 4h 5m per day

Staffing hours breakdown

Info Hours of care per resident per day, broken down by staff type. Data from CMS Medicare.
Staff type Facility State avg National avg
Registered Nurse (RN) Info Registered nurse hours per resident per day. 13m per day 24m per day 29m per day

Capacity and availability

Medium-capacity home

Offers a balance of services and community atmosphere.

Total beds 132

This home usually has limited availability

Occupancy is moderate, suggesting balanced demand.

Similar demand to the South Carolina average
Occupancy rate 89.1%
Residents per day (avg) 126
Occupancy rate
89.1%
Residents per day (avg)
126

Who this home usually serves

TYPE OF STAY

Mix of rehab and long-term care

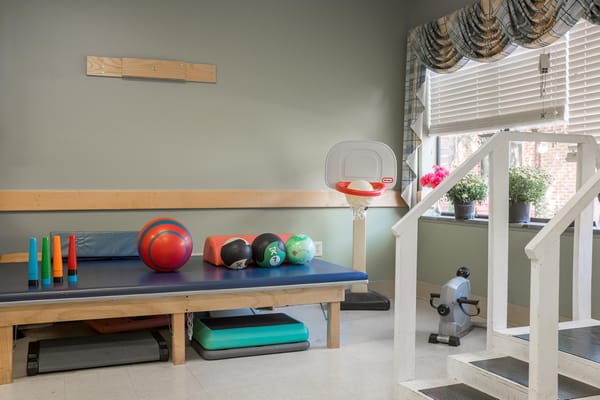
This home supports both short-term rehab and long-term care, with residents staying for a wide range of durations.

Breakdown by payment type

Medicare

40% of new residents, usually for short-term rehab.

Typical stay 1 - 2 months

Private pay

43% of new residents, often for short stays.

Typical stay 4 - 5 months

Medicaid

17% of new residents, often for long-term daily care.

Typical stay 2 years

Finances and operations

Privately-owned community
Operated by a business corporation.
Home revenue
$13.1M
Operating loss
-$251.9K
Privately-owned community Operated by a business corporation.
Home revenue
$13,088,232.00
Operating loss
$-251,915.00
Payroll costs Info The portion of the home's budget spent on staff, including nurses, caregivers, and other employees who support care and operations.
$6.9M
53% of revenue
Other operating costs Info All remaining costs needed to run the home, such as food, utilities, building maintenance, supplies and administrative expenses.
$6.4M
Total costs $13.3M
Bed community size
132-bed community
A larger shared setting that may offer more common spaces and organized community services.
Walk Score
Walk Score: 8 / 100
Car-dependent. Most errands require a car, with limited nearby walkable options.

About this community

License details

Facility type
Nursing Homes
Status Active
Expiration August 31, 2026
County: Lancaster

Additional licensing details

License number: NCF-1089
CMS Certification Number: 425017

Ownership & operating entity

White Oak Manor Lancaster is legally operated by NHC HEALTHCARE/LANCASTER LLC, and administrated by GOSNELL, LISA R..

Ownership type: Limited Liability

Type Of Units

Nursing Home
132 units
Total beds
132 units

Care Services

Offers Alzheimer's Care
Dedicated Alzheimer's Unit
Nursing Services
Rehabilitation Services
Memory Care
Independent Living
Skilled Nursing
Licensed Nurses/CNAs
24-Hour Staffing
Short-Term Rehab

All Levels of Care

Assisted Living
Short Term Rehabilitation
Nursing Homes
Independent Living
Memory Care

Contact Information

Programs & Activities

Specific Programs
Assisted Living, Short Term Rehabilitation, Nursing Homes, Independent Living, Memory Care
Operating Hours
24/7

What does this home offer?

Accepts Medicaid icon

Accept Medicaid: Yes

Total residents icon

Total Residents: 132

Building type icon
Building type icon

Building Type: Single-story

Types of Care at White Oak Manor Lancaster

Nursing Home
Contact White Oak Manor Lancaster

Health Inspection History

Inspections
Total health inspections 2

South Carolina average 3.9


Last Health inspection on May 2025

Total health citations 6
Citations per inspection
3

Health citations are formal notices following inspections when they fail to comply with safety and care standards.

All 6 citations resulted from standard inspections.

Breakdown of citation severity (last 3 years)
Critical Health citations More info 0
100% better than South Carolina average

South Carolina average: 1


Serious Health citations More info 0
100% better than South Carolina average

South Carolina average: 0.3

0 critical citations More info South Carolina average: 1

0 serious citations More info South Carolina average: 0.3

6 moderate citations More info South Carolina average: 12.3

0 minor citations More info South Carolina average: 0.1
Citations history (last 3 years)
Nutrition moderate citation May 06, 2025
Corrected

Pharmacy moderate citation May 06, 2025
Corrected

Quality of Care moderate citation May 06, 2025
Corrected

Resident Rights moderate citation May 06, 2025
Corrected

Compare Memory Care around Lancaster

The information below is reported by the South Carolina Department of Public Health, Bureau of Healthcare Quality.
White Oak Manor Lancaster
AL

Assisted Living For seniors needing help with daily tasks but not full-time nursing.

MC

Memory Care Specialized care for those with Memory Loss, Alzheimer's, or dementia, ensuring safety and support.

SNF

Nursing Homes 24/7 care needed

RC

Respite Care

Lancaster
132
No
8
Lancaster Grove Senior Living
AL

Assisted Living For seniors needing help with daily tasks but not full-time nursing.

MC

Memory Care Specialized care for those with Memory Loss, Alzheimer's, or dementia, ensuring safety and support.

SNF

Nursing Homes 24/7 care needed

RC

Respite Care

Lancaster
65
No
18

Places of interest near White Oak Manor Lancaster

Address 2.3 miles from city center

Address 253 Craig Manor Rd, Lancaster, SC 29720

Calculate Travel Distance to White Oak Manor Lancaster

Add your location

Address

Staffing Data

Source: CMS Payroll-Based Journal (Q2 2025)

149
Total Staff
130
Employees
19
Contractors
46,527
Total Hours (Quarter)
65
Avg Staff/Day
7.9
Avg Shift (hrs)
Nursing Staff Breakdown
Role Count Avg Shift (hrs) Uses Contractors?
Registered Nurse79 No
Licensed Practical Nurse259.6 No
Certified Nursing Assistant837.6 No
Staff by Category
Administration
2 staff
7.7hs shift avg
Nursing Staff
115 staff
8.1hs shift avg
Physicians & Practitioners
6 staff
7.7hs shift avg
Therapy Services
17 staff
5.9hs shift avg
Activities & Recreation
0 staff
0hs shift avg
Social Services
2 staff
7.4hs shift avg
Dietary Services
3 staff
7.5hs shift avg
Other Services
4 staff
7.9hs shift avg
Contractor Analysis
5.1%
of total hours from contractors
2,383 contractor hours this quarter
Physical Therapy Assistant: 2 Respiratory Therapy Technician: 2 Medical Director: 1 Physical Therapy Aide: 4 Speech Language Pathologist: 5 Qualified Social Worker: 2 Occupational Therapy Assistant: 3
Role Employees Contractors Total Staff Total Hours Days Worked % of Days Avg Shift (hrs)
Certified Nursing Assistant8308326,30391100%7.6
Licensed Practical Nurse250259,82691100%9.6
Clinical Nurse Specialist5052,2756774%7.7
Registered Nurse7072,20291100%9
Other Dietary Services Staff2029547684%7.3
Physical Therapy Aide0446626673%6.6
Speech Language Pathologist0555036571%6.2
Administrator1014725965%8
Nurse Practitioner1014726167%7.7
Qualified Social Worker0224696369%7.4
Mental Health Service Worker2024645965%7.9
Occupational Therapy Aide1014365864%7.5
Dietitian1014135257%7.9
Respiratory Therapy Technician0223896369%6
Dental Services Staff2023304246%7.8
Physical Therapy Assistant0222225662%3.7
Occupational Therapy Assistant0331092932%3.8
Medical Director0113067%5

Facility Characteristics

Source: CMS Long-Term Care Facility Characteristics (Data as of Jan 2026)

Total census
129 residents
Residents by payment source
Medicare
7 residents (5.4%)
Medicaid
91 residents (70.5%)
Private pay or other
31 residents (24%)
Programs & Services
Residents' Group

Residents meet regularly to discuss policies, care quality, and activities

Active Resident Council

Organized group of residents that meets regularly to discuss facility policies, quality of life, and activities.

Quality of care over time

These measures show how residents usually do over time at this home, based on health outcomes and preventive care.

High-risk clinical events score Info A composite score based on pressure ulcers, falls with injury, weight loss, walking ability decline, and activities of daily living decline. 7.9
9% better than South Carolina average

South Carolina average: 8.7

Functional decline score Info A composite score based on activities of daily living decline, walking ability decline, and incontinence. 11.9
23% better than South Carolina average

South Carolina average: 15.5

Long-stay resident measures
Significantly above average South Carolina avg: 4.0 Info CMS star rating based on long-stay quality measure performance. 5 stars = significantly above average, 1 star = significantly below average.
Need for Help with Daily Activities Increased Info Percent of long-stay residents whose need for help with daily activities has increased 9.7%
26% better than South Carolina average

South Carolina average: 13.1%

Walking Ability Worsened Info Percent of long-stay residents whose ability to move independently worsened 10.5%
35% better than South Carolina average

South Carolina average: 16.2%

Low Risk Residents with Bowel/Bladder Incontinence Info Percent of low risk long-stay residents who lose control of their bowels or bladder 15.6%
9% better than South Carolina average

South Carolina average: 17.0%

Falls with Major Injury Info Percent of long-stay residents experiencing one or more falls with major injury 4.7%
57% worse than South Carolina average

South Carolina average: 3.0%

High Risk Residents with Pressure Ulcers Info Percent of long-stay high risk residents with pressure ulcers 8.8%
44% worse than South Carolina average

South Carolina average: 6.1%

Urinary Tract Infection Info Percent of long-stay residents with a urinary tract infection 0.9%
46% better than South Carolina average

South Carolina average: 1.6%

Lost Too Much Weight Info Percent of long-stay residents who lose too much weight 6.0%
In line with South Carolina average

South Carolina average: 6.2%

Depressive Symptoms Info Percent of long-stay residents who have depressive symptoms 0.0%
100% better than South Carolina average

South Carolina average: 2.8%

Antipsychotic Use Info Percent of long-stay residents who received an antipsychotic medication 15.6%
7% worse than South Carolina average

South Carolina average: 14.5%

Pneumococcal Vaccine Info Percent of long-stay residents assessed and appropriately given the pneumococcal vaccine 86.0%
5% worse than South Carolina average

South Carolina average: 90.5%

Influenza Vaccine Info Percent of long-stay residents assessed and appropriately given the seasonal influenza vaccine 85.5%
6% worse than South Carolina average

South Carolina average: 90.6%

Hospitalizations per 1,000 days Info Number of hospitalizations per 1,000 long-stay resident days. 0.81
60% better than South Carolina average

South Carolina average: 2.03

ED visits per 1,000 days Info Number of outpatient emergency department visits per 1,000 long-stay resident days. 0.78
59% better than South Carolina average

South Carolina average: 1.91

Short-stay resident measures
Above average South Carolina avg: 3.4 Info CMS star rating based on short-stay quality measure performance. 5 stars = much above average, 1 star = much below average.
Pneumococcal Vaccine Info Percent of short-stay residents assessed and appropriately given the pneumococcal vaccine 58.3%
27% worse than South Carolina average

South Carolina average: 79.5%

Antipsychotic medication increase Info Percent of short-stay residents who newly received an antipsychotic medication 0.0%
100% better than South Carolina average

South Carolina average: 1.7%

Influenza Vaccine Info Percent of short-stay residents assessed and appropriately given the seasonal influenza vaccine 61.4%
21% worse than South Carolina average

South Carolina average: 78.0%

Re-hospitalized after SNF stay Info Percentage of short-stay residents who were re-hospitalized after their nursing home admission. 20.3%
18% better than South Carolina average

South Carolina average: 24.7%

Emergency department visits Info Percentage of short-stay residents who had an outpatient emergency department visit. 8.2%
42% better than South Carolina average

South Carolina average: 14.1%

Falls with major injury Info Percentage of SNF residents who experience falls with major injury during their stay. 0.9%
13% worse than South Carolina average

South Carolina average: 0.8%

Ability to care for self at discharge Info Percentage of residents at or above expected ability to care for themselves at discharge. 65.5%
22% better than South Carolina average

South Carolina average: 53.7%

Successful return to home or community Info Rate of successful return to home or community from a skilled nursing facility. 45.8%
9% worse than South Carolina average

South Carolina average: 50.6%

Guides for Better Senior Living

Care Cost Calculator: See Prices in Your Area

Nursing Home Data Explorer

Don’t Wait Too Long: 7 Red Flag Signs Your Parent Needs Assisted Living Now

The True Cost of Assisted Living in 2025 – And How Families Are Paying For It

Understanding Senior Living Costs: Pricing Models, Discounts & Financial Assistance

Financial Aid for South Carolina Seniors

Get financial aid guidance

Community Long Term Care (CLTC)

SC Medicaid CLTC

Age 65+ or disabled, South Carolina resident, Medicaid-eligible, nursing home-level care need.

~$2,829/month (300% FBR, individual).

$2,000 (individual), $3,000 (couple).

High rural demand; waitlists possible.

South Carolina Respite Care Program

SC NFCSP Respite

Caregiver of someone 60+ (or with dementia), South Carolina resident.

No strict limit; prioritizes low-income.

Not applicable.

Limited slots; rural/urban balance.

Medicare Savings Program (MSP)

South Carolina Medicare Savings Program

Age 65+ or disabled, SC resident, Medicare Part A/B.

~$2,510/month (QMB), ~$3,380/month (SLMB), ~$3,598/month (QI)—individual.

$9,430 (individual), $14,130 (couple).

Three tiers; includes Extra Help for Part D; no waitlist.

Low-Income Home Energy Assistance Program (LIHEAP)

South Carolina LIHEAP

Age 60+ prioritized, SC resident, low-income household.

~$3,970/month (individual, 185% FPL).

Not assessed; income-focused.

Covers gas, electric, oil; emergency aid via ECAP (~$500 max).

Senior Community Service Employment Program (SCSEP)

South Carolina SCSEP

Age 55+, unemployed, low-income, SC resident.

~$1,983/month (125% FPL).

Not specified; income-focused.

Priority for veterans, rural residents; Goodwill/AARP partnership.

VA Aid and Attendance (A&A) and Housebound Benefits

South Carolina VA Aid and Attendance/Housebound

Age 65+ or disabled veteran/spouse, SC resident, wartime service, need for ADL help (A&A) or homebound.

Net income < ~$1,984/month (veteran with dependent, A&A); pension offsets income.

~$155,356 (net worth limit).

High veteran population; supports rural/urban care needs.

Senior Farmers’ Market Nutrition Program (SFMNP)

South Carolina SFMNP

Age 60+, SC resident, low-income.

~$2,322/month (individual, 185% FPL).

Not assessed.

Vouchers (~$50/season); serves ~20,000 annually via 10 AAAs.

Homestead Exemption Program

South Carolina Homestead Exemption

Age 65+ (or disabled/blind), SC resident 1+ year, homeowner.

None; tax-based eligibility.

Not assessed; home-focused.

Saves ~$500-$1,000/year avg.; applies to primary residence.

Elderly Simplified Application Project (ESAP)

South Carolina ESAP (SNAP for Seniors)

Age 60+, SC resident, no earned income, not on SCCAP.

~$1,732/month (133% FPL, individual).

$4,250 (individual, higher than standard SNAP).

Simplified process; serves ~50,000 seniors annually.

Tour Icon
Planning a tour? Check our touring checklist.
Chat Icon
Thinking of living here? We can help you speak to a current resident