WhiteStone
Nursing Home, Assisted Living, Independent Living & Memory Care · Greensboro, NC
CMS overall rating Info CMS (the Centers for Medicare & Medicaid Services) is the federal agency that rates nursing home quality. Its Overall Rating runs from 1 to 5 stars, combining health inspections, staffing, and quality measures, with inspections weighted most heavily.

WhiteStone

Nursing Home, Assisted Living, Independent Living & Memory Care · Greensboro, NC
CMS overall rating Info CMS (the Centers for Medicare & Medicaid Services) is the federal agency that rates nursing home quality. Its Overall Rating runs from 1 to 5 stars, combining health inspections, staffing, and quality measures, with inspections weighted most heavily.
Calculator: See prices in your area
WhiteStone accepts Medicare and private pay.

Overview of Whitestone

Whitestone is a blissful senior living community in Guilford County, Greensboro, NC, offering a vibrant independent living environment. Residents are provided plenty of options for their living space, including spacious apartments, cozy cottages, and free standing single residences, set in beautifully maintained 42-acre ground. In addition to a maintenance-free living, residents are also given access to an array of healthcare services, such as routine checkups, rehabilitation therapy, short- and long-term skilled nursing, and memory care should they need it.

Without the worries of housekeeping, maintenance, and meal preparation, residents can focus on living their life to the fullest. Hence, the community offers plenty of beautiful amenities and enriching activities. Here, residents are free to pursue their hobbies, explore new interests, make new friends, or visit all those places they’ve always wanted to explore.

Quality ratings

Measured by Centers for Medicare & Medicaid Services (CMS)

Overall rating Info The Overall CMS Rating combines results from health inspections, staffing levels and quality measures. Health inspections carry the most weight. Staffing and quality scores can increase or decrease the final rating based on performance compared to state and national standards.
Health Inspection Info Based on the results of the facility's three most recent standard inspections and any complaint investigations. CMS reviews the number, scope, and severity of deficiencies, with more recent findings weighted more heavily.
Staffing Info Measures average nursing staff hours per resident per day, including Registered Nurses (RNs) and total nursing staff. Ratings are adjusted based on the level of care residents require and are compared to state and national benchmarks.
Quality Measures Info Based on clinical and physical health indicators reported to CMS, such as hospital readmissions, falls, pressure ulcers, and improvements in mobility. These measures reflect how well residents' health needs are being managed.

Staffing hours breakdown

Info Daily nursing hours per resident by staff type, reported to CMS. Higher is generally better — compare this facility to state and national averages to see where staffing stands.

Hours per resident per day — compared to state averages

Total nursing care / resident Info Total adjusted nursing hours per resident per day, combining RN, LPN, and aide time. CMS adjusts this for case-mix so facilities can be fairly compared.
4h 13m per day
Rank #35 / 97Nurse hours — State benchmarkedThis home is ranked 35th out of 97 homes in North Carolina. Shows adjusted nurse hours per resident per day benchmarked to the North Carolina average, with a ranking across 97 North Carolina facilities. More hours mean more direct care. The national average is about 3.5 hrs; below 3.0 is a red flag.Rankings are based only on facilities in North Carolina that report data for that category. Facilities without available data are excluded from the ranking.Click the rank badge to see the full State ranking.Click here to see the full State ranking.
vs avg
Staff typeHours / Day / Residentvs state avg
Registered Nurse (RN) Info RNs hold the highest nursing license and can assess residents, interpret test results, and direct care plans. More RN hours per day often signals stronger clinical oversight and faster response to health changes. 51m per day
LPN / LVN Info Licensed Practical Nurses (LPNs) or Licensed Vocational Nurses (LVNs) deliver routine hands-on care — medication administration, wound dressing, and monitoring vital signs. They work under RN supervision and make up a large share of daily bedside care. 51m per day
Nurse Aide Info Certified Nurse Aides (CNAs) provide the most direct day-to-day assistance: bathing, dressing, feeding, and mobility. Nurse aide hours are typically the largest staffing category and directly affect residents' quality of life. 2h 44m per day
Weekend Total Nursing Info Combined nursing hours (RN + LPN + Nurse Aide) per resident per day on weekends. Staffing often drops on weekends — this figure reveals whether the facility maintains adequate coverage outside of weekday hours. 3h 45m per day
Physical Therapist Info Hours per resident per day provided by licensed Physical Therapists (PTs) or PT Assistants. PT services help residents recover mobility after injury or illness and are especially important for post-acute (short-stay) rehabilitation. 5m per day
Weekend RN Info Registered nurse hours specifically on weekends. Facilities sometimes reduce RN presence on Saturdays and Sundays — a low weekend RN figure compared to weekday hours can indicate reduced clinical oversight when most administrative staff are absent. 32m per day

Capacity and availability

This home usually has availability

Lower occupancy than the state average
Occupancy rate
69.2% Rank #152 / 271Occupancy rate — State benchmarkedThis home is ranked 152nd out of 271 homes in North Carolina. Shows this facility's occupancy rate versus the North Carolina average, with its Statewide rank out of 271. Higher occupancy signals strong local demand and financial stability.Rankings are based only on facilities in North Carolina that report data for that category. Facilities without available data are excluded from the ranking.Click the rank badge to see the full State ranking.Click here to see the full State ranking.
Avg. Length of Stay
92 days
Bed community size
60-bed community Rank #233 / 390Bed count — State benchmarkedThis home is ranked 233rd out of 390 homes in North Carolina. Shows this facility's certified or reported bed count compared to other North Carolina facilities. Larger communities may offer more amenities, programs, and on-site services for residents and families.Rankings are based only on facilities in North Carolina that report data for that category. Facilities without available data are excluded from the ranking.Click the rank badge to see the full State ranking.Click here to see the full State ranking.
A moderately sized community that may balance personal attention with shared amenities and social activities.
Walk Score
Walk Score: 31 / 100 Rank #294 / 572Walk Score — State benchmarkedThis home is ranked 294th out of 572 homes in North Carolina. Shows how walkable this facility's neighborhood is compared to the average Walk Score across North Carolina facilities. Higher scores benefit residents, families, and staff.Rankings are based only on facilities in North Carolina that report data for that category. Facilities without available data are excluded from the ranking.Click the rank badge to see the full State ranking.Click here to see the full State ranking.
Somewhat walkable. A few nearby services may be reachable on foot, but most trips require transportation.
BBB Rating
BBB Rating: A+ (Not Accredited)
An independent rating from the Better Business Bureau based on factors such as complaint history, transparency, and business practices.
How BBB ratings work

About this community

Awards

2025-26 Best Nursing Home for Short-Term Rehabilitation by U.S. News & World Report

Staffing

Key information about the people who lead and staff this community.

Leadership

ContactMr. Mark Lewis, Executive Director

Therapy & Rehabilitation

1 service
Rehabilitation Services

Amenities & Lifestyle

On-Site Dining
Wellness Programs
Specific ProgramsIn-Home Care

Contact WhiteStone

Health Inspection History

Inspections since 2022
Total health inspections 2

State average N/A


Last Health inspection on Apr 2025
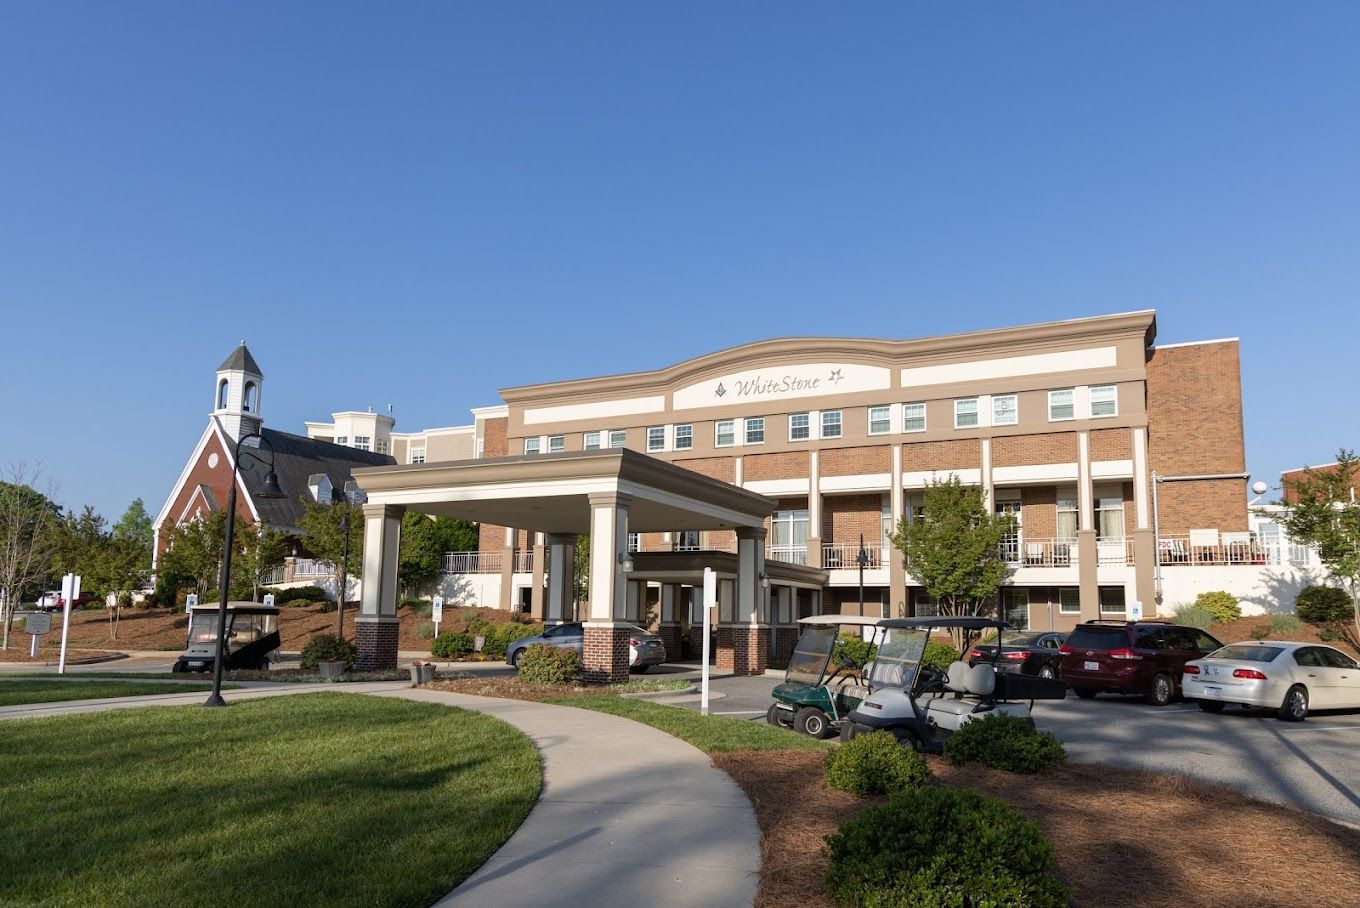
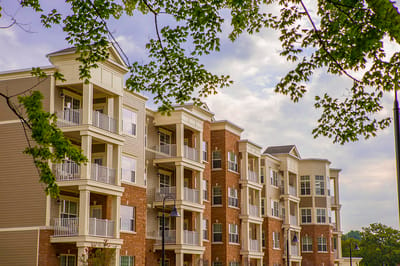
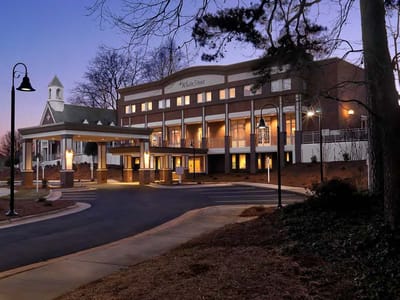
Total health citations
9 Rank #34 / 101Health citations — State benchmarkedThis home is ranked 34th out of 101 homes in North Carolina. Shows this facility's total health deficiency citations benchmarked to the North Carolina State average, with a ranking across all 101 NC facilities. Lower citation counts earn a better rank.Rankings are based only on facilities in North Carolina that report data for that category. Facilities without available data are excluded from the ranking.Click the rank badge to see the full State ranking.Click here to see the full State ranking.

State average N/A

Citations per inspection
4.5 Rank #55 / 101Citations per inspection — State benchmarkedThis home is ranked 55th out of 101 homes in North Carolina. Shows average deficiency citations per CMS inspection for this facility versus the North Carolina mean across 101 facilities with citation data. Lower is better.Rankings are based only on facilities in North Carolina that report data for that category. Facilities without available data are excluded from the ranking.Click the rank badge to see the full State ranking.Click here to see the full State ranking.

State average N/A


Health citations are formal notices following inspections when they fail to comply with safety and care standards.

5 of 9 citations resulted from standard inspections; and 4 of 9 came from combined inspections (standard and complaint).

Breakdown of citation severity (last 4 years)
Critical health citations
1
In line with State average

State average: N/A


Serious health citations
1
In line with State average

State average: N/A

1 critical citation State average: N/A

1 serious citation State average: N/A

7 moderate citations State average: N/A

0 minor citations State average: N/A
Citations history (last 4 years)
Administration moderate citation Apr 17, 2025
Corrected

Pharmacy moderate citation Apr 17, 2025
Corrected

Pharmacy moderate citation Apr 17, 2025
Corrected

Quality of Care moderate citation Apr 17, 2025
Corrected

Staffing Data

Reporting period: October 1 – December 31, 2025 (Q4 2025). Source: CMS Payroll-Based Journal report.

Total staff 159
Employees 131
Contractors 28
Staff to resident ratio 3.24 : 1
0% compared with State average

State average ratio: 0 : 0

Avg staff/day 57
Average shift 4.8 hours
0% compared with State average

State average: 0 hours

Total staff hours (quarter) 24,956

Nursing staff breakdown

Q4 2025 · Oct 1 – Dec 31 More info This data comes from the CMS Payroll-Based Journal report covering October 1 – December 31, 2025.
Registered Nurse

Manages medical care and health needs.

RN Staff Info All 10 RN Staff are full-time employees. No contractors work on this role. 10
Average shift length Info Average shift length. Calculated as total hours divided by days worked and average staff per day. 5.7 hours
Licensed Practical Nurse

Assists with medical care and medications.

LPN Staff Info All 1 LPN Staff are full-time employees. No contractors work on this role. 1
Average shift length Info Average shift length. Calculated as total hours divided by days worked and average staff per day. 5.1 hours
Certified Nursing Assistant

Helps with daily care and mobility.

CNA Staff Info All 81 CNA Staff are full-time employees. No contractors work on this role. 81
Average shift length Info Average shift length. Calculated as total hours divided by days worked and average staff per day. 4.8 hours

Contractor staffing

Q4 2025 · Oct 1 – Dec 31 More info This data comes from the CMS Payroll-Based Journal report covering October 1 – December 31, 2025.

Total hours from contractors

10%

2,491 contractor hours this quarter

Speech Language Pathologist: 8 Physical Therapy Assistant: 7 Respiratory Therapy Technician: 4 Physical Therapy Aide: 4 Occupational Therapy Assistant: 2 Qualified Social Worker: 2 Occupational Therapy Aide: 1

Staff by category

Q4 2025 · Oct 1 – Dec 31 More info This data comes from the CMS Payroll-Based Journal report covering October 1 – December 31, 2025.
Certified Nursing Assistant8108112,70592100%4.8
RN Director of Nursing260263,63092100%4.5
Registered Nurse100102,03492100%5.7
Clinical Nurse Specialist6061,5379098%5.4
Other Social Services Staff30391892100%5.2
Speech Language Pathologist0887928188%3.7
Physical Therapy Assistant0776947784%3.8
Dental Services Staff1013917784%5.1
Respiratory Therapy Technician0443526874%3.2
Nurse Practitioner1013366470%5.3
Mental Health Service Worker1013316368%5.3
Licensed Practical Nurse1013156267%5.1
Qualified Social Worker0222716571%4.2
Administrator1012685155%5.3
Occupational Therapy Aide0111903437%5.6
Physical Therapy Aide0441484448%3.3
Occupational Therapy Assistant022451112%3.2
81 Certified Nursing Assistant
% of Days 100%
26 RN Director of Nursing
% of Days 100%
10 Registered Nurse
% of Days 100%
6 Clinical Nurse Specialist
% of Days 98%
3 Other Social Services Staff
% of Days 100%
8 Speech Language Pathologist
% of Days 88%
7 Physical Therapy Assistant
% of Days 84%
1 Dental Services Staff
% of Days 84%
4 Respiratory Therapy Technician
% of Days 74%
1 Nurse Practitioner
% of Days 70%
1 Mental Health Service Worker
% of Days 68%
1 Licensed Practical Nurse
% of Days 67%
2 Qualified Social Worker
% of Days 71%
1 Administrator
% of Days 55%
1 Occupational Therapy Aide
% of Days 37%
4 Physical Therapy Aide
% of Days 48%
2 Occupational Therapy Assistant
% of Days 12%

Penalties and fines

Includes penalties issued in 2025

Federal penalties imposed by CMS for regulatory violations, including civil money penalties (fines) and denials of payment for new Medicare/Medicaid admissions.

Source: CMS Penalties Database (Data as of Jan 2026)

Total fines amount $25K Rank #71 / 105Federal fines — State benchmarkedThis home is ranked 71st out of 105 homes in North Carolina. Shows this facility's cumulative CMS federal fine dollars versus the North Carolina average among facilities with fines, and where it ranks among 105 facilities in the pool. Lower total dollars mean a better rank.Rankings are based only on facilities in North Carolina that report data for that category. Facilities without available data are excluded from the ranking.Click the rank badge to see the full State ranking.Click here to see the full State ranking.
66% lower than State average

State average: $76K

Number of fines 1
57% fewer fines than State average

State average: 2.3

Payment Denials Info Serious action where Medicare and/or Medicaid temporarily stops payments for new residents until issues are fixed. 0
100% fewer payment denials than State average

State average: 0.4

Fines amount comparison
This facility $25K
State average $76K
Penalty History

Penalties are imposed by CMS for violations of federal nursing home regulations.

1 penalty in the past 3 years

Apr 17, 2025 · $25K

Civil Money Penalty Info Fines imposed for noncompliance, which can be assessed per day or per instance of violation. Apr 17, 2025
$25K

Last updated: Jan 2026

Quality of care over time

These measures show how residents usually do over time at this home, based on health outcomes and preventive care.

High-risk clinical events score Info A composite score based on pressure ulcers, falls with injury, weight loss, walking ability decline, and activities of daily living decline. 16.0
40% worse than State average

State average: 11.5

Functional decline score Info A composite score based on activities of daily living decline, walking ability decline, and incontinence. 29.7
44% worse than State average

State average: 20.6

Long-stay resident measures
Need for Help with Daily Activities Increased Info Percent of long-stay residents whose need for help with daily activities has increased 27.7%
58% worse than State average

State average: 17.5%

Walking Ability Worsened Info Percent of long-stay residents whose ability to move independently worsened 31.3%
35% worse than State average

State average: 23.3%

Low Risk Residents with Bowel/Bladder Incontinence Info Percent of low risk long-stay residents who lose control of their bowels or bladder 30.1%
41% worse than State average

State average: 21.4%

Falls with Major Injury Info Percent of long-stay residents experiencing one or more falls with major injury 9.5%
161% worse than State average

State average: 3.6%

High Risk Residents with Pressure Ulcers Info Percent of long-stay high risk residents with pressure ulcers 4.8%
24% better than State average

State average: 6.3%

Urinary Tract Infection Info Percent of long-stay residents with a urinary tract infection 0.0%
100% better than State average

State average: 2.6%

Lost Too Much Weight Info Percent of long-stay residents who lose too much weight 6.9%
7% better than State average

State average: 7.4%

Depressive Symptoms Info Percent of long-stay residents who have depressive symptoms 1.1%
76% better than State average

State average: 4.4%

Antipsychotic Use Info Percent of long-stay residents who received an antipsychotic medication 5.9%
56% better than State average

State average: 13.4%

Pneumococcal Vaccine Info Percent of long-stay residents assessed and appropriately given the pneumococcal vaccine 68.6%
25% worse than State average

State average: 91.6%

Influenza Vaccine Info Percent of long-stay residents assessed and appropriately given the seasonal influenza vaccine 76.9%
18% worse than State average

State average: 94.1%

Short-stay resident measures
Pneumococcal Vaccine Info Percent of short-stay residents assessed and appropriately given the pneumococcal vaccine 33.6%
58% worse than State average

State average: 79.9%

Antipsychotic medication increase Info Percent of short-stay residents who newly received an antipsychotic medication 1.2%
21% better than State average

State average: 1.5%

Influenza Vaccine Info Percent of short-stay residents assessed and appropriately given the seasonal influenza vaccine 28.3%
64% worse than State average

State average: 78.1%

Breakdown by payment type

Medicare

27% of new residents, usually for short-term rehab.

Typical stay 29 days

Private pay

72% of new residents, often for short stays.

Typical stay 2 - 3 months

Facility Characteristics

Source: CMS Long-Term Care Facility Characteristics (Data as of Jan 2026)

Total residents 49
Medicare
24
49% of residents
Medicaid
19
38.8% of residents
Private pay or other
6
12.2% of residents
Programs & Services
Residents Group

Residents meet regularly to discuss policies, care quality, and activities

CCRC

Part of a Continuing Care Retirement Community offering multiple care levels

Active Resident Council

Organized group of residents that meets regularly to discuss facility policies, quality of life, and activities.

Finances and operations

Based on CMS SNF Cost Report for fiscal year ending in 12/2023.
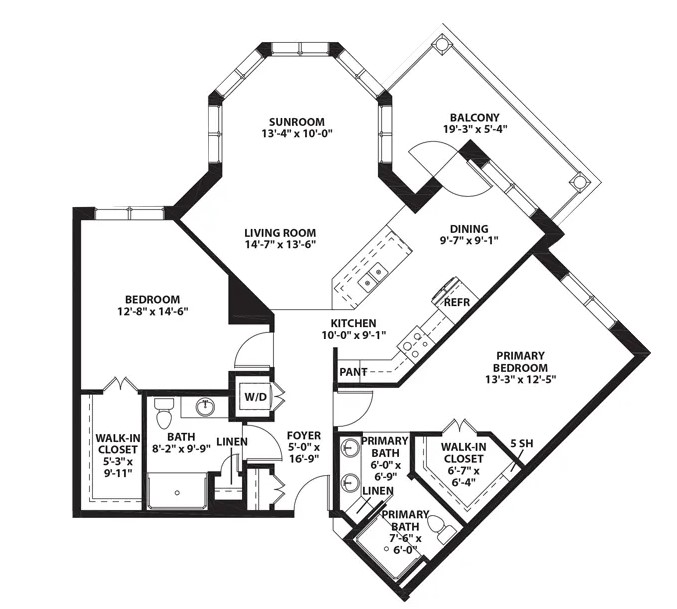
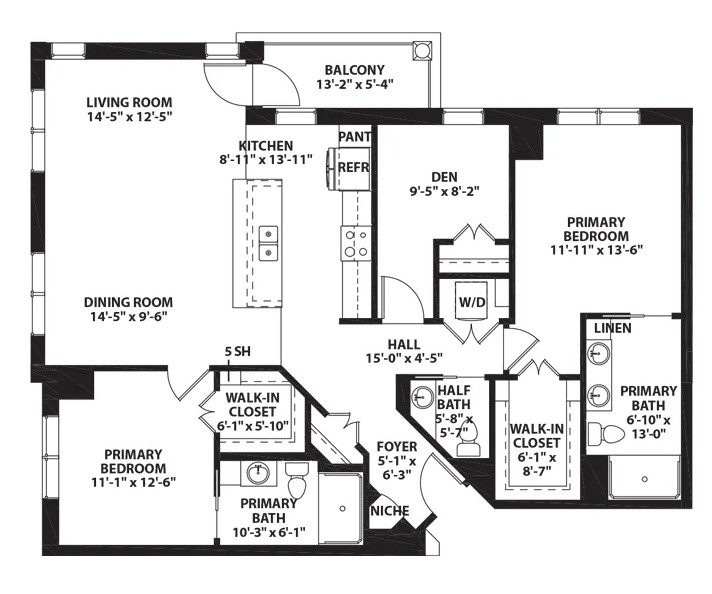
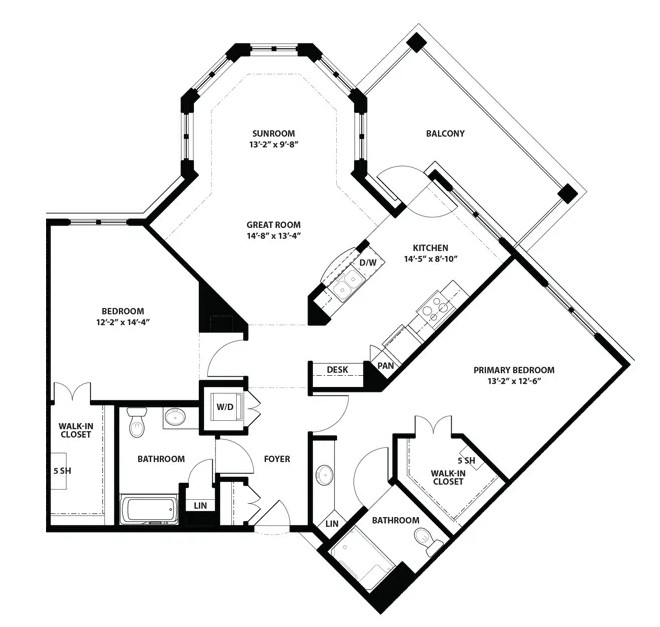
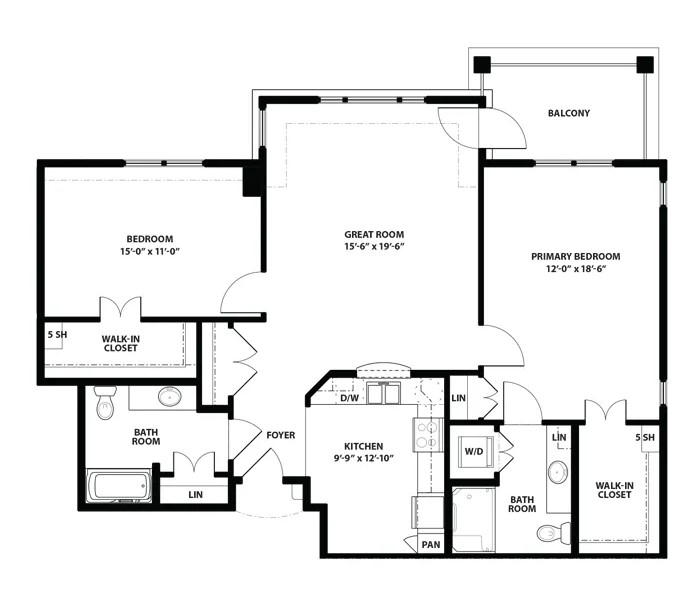
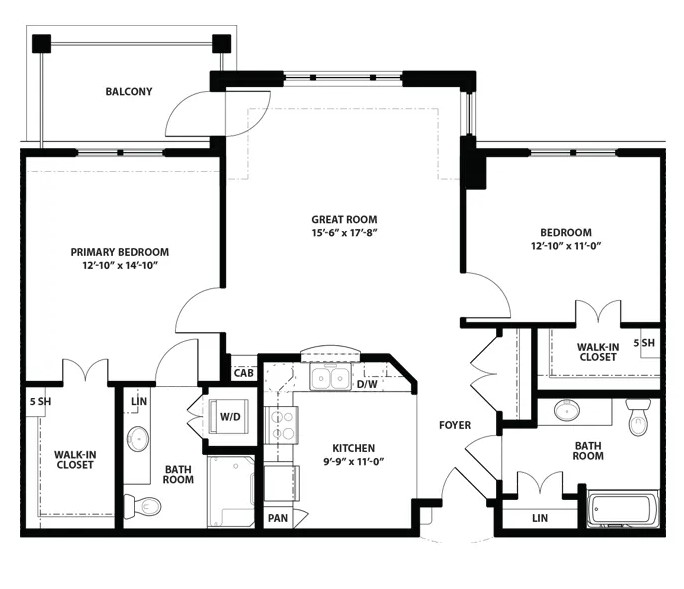
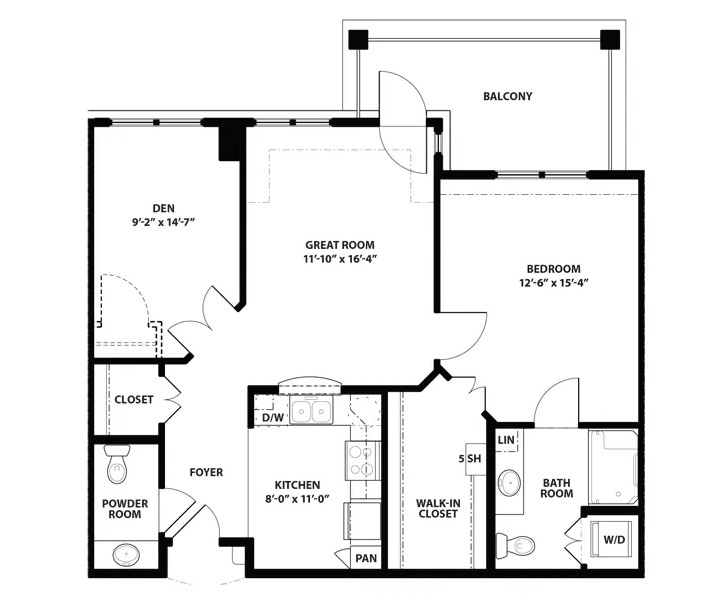
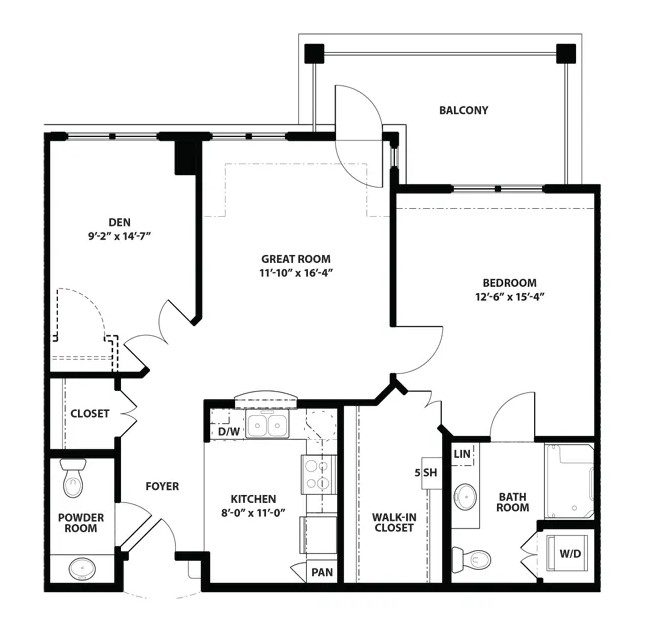
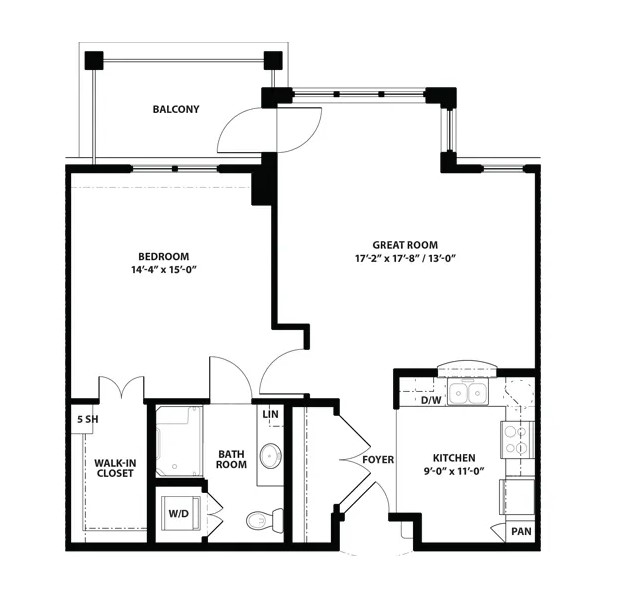
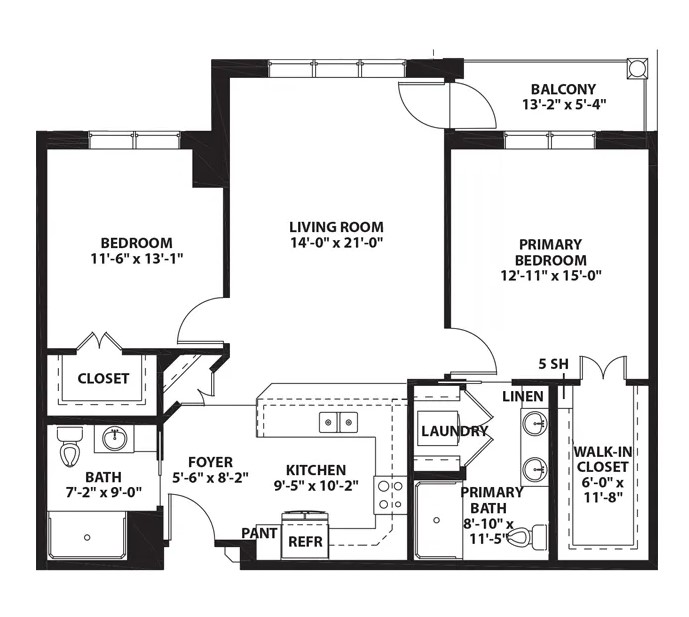
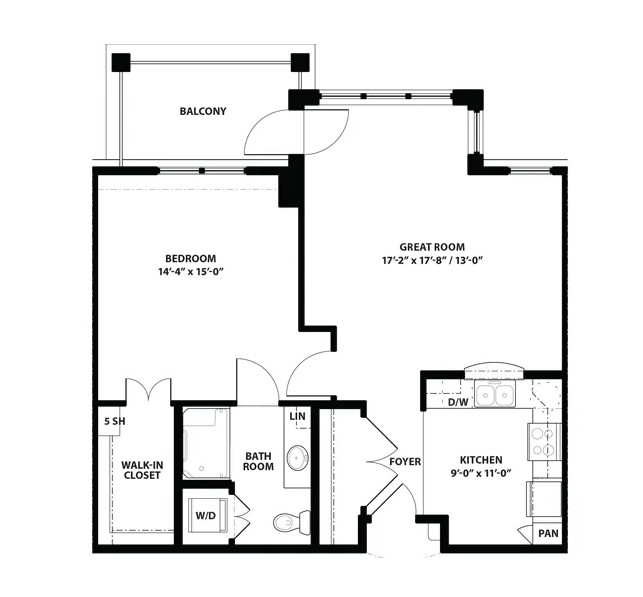
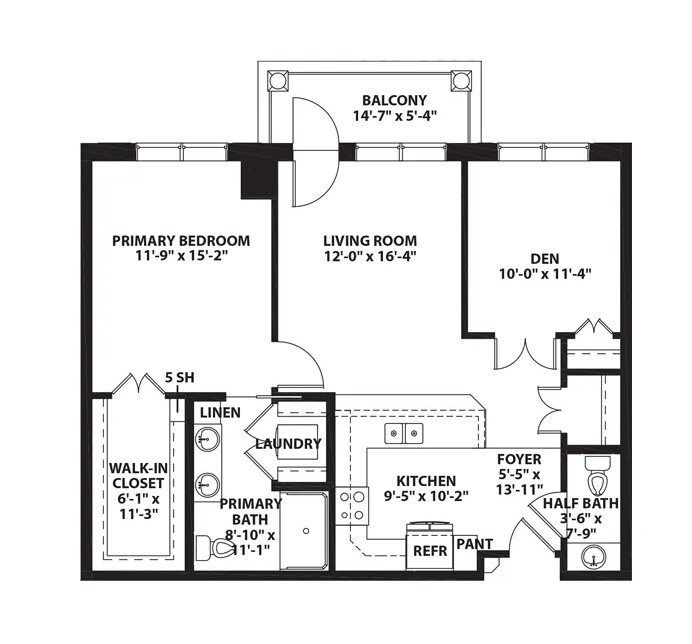
Nonprofit
Nonprofit Corporation
Net patient revenue Info Net patient revenue — what the home actually collects for resident care, after contractual allowances, bad debt and discounts are subtracted from its gross charges (CMS cost report, Worksheet G-3). It covers resident care only; money the home earns from other sources is shown separately as "Other income."
$7.6M
Net patient income Info Net patient income: net patient revenue minus the home's total operating expenses. A positive figure means it earns more from resident care than it spends to deliver it; a negative figure means the opposite. It excludes non-operating "other income."
-$16.2M
Nonprofit Nonprofit Corporation
Net patient revenue Info Net patient revenue — what the home actually collects for resident care, after contractual allowances, bad debt and discounts are subtracted from its gross charges (CMS cost report, Worksheet G-3). It covers resident care only; money the home earns from other sources is shown separately as "Other income."
$7.6M Rank #26 / 104Revenue — State benchmarkedThis home is ranked 26th out of 104 homes in North Carolina. Shows this facility's annual revenue compared to the North Carolina average. Higher revenue generally means more resources for staffing and capital — read alongside Payroll %.Rankings are based only on facilities in North Carolina that report data for that category. Facilities without available data are excluded from the ranking.Click the rank badge to see the full State ranking.Click here to see the full State ranking.
Net patient income Info Net patient income: net patient revenue minus the home's total operating expenses. A positive figure means it earns more from resident care than it spends to deliver it; a negative figure means the opposite. It excludes non-operating "other income."
-$16.2M
Other income Info Money the home earns outside of resident care — such as investments, grants, rentals and other non-operating sources (CMS cost report, Worksheet G-3). It is tracked separately from net patient revenue: it is not part of that figure, and it is not included in net patient income.
$14.3M
Payroll costs Info Staff salaries plus wage-related costs — benefits such as payroll taxes, health insurance and retirement — from the home's own accounting records (CMS cost report, Worksheet A). Contract or agency labor is counted separately, under other operating costs. Rank #26 / 104Payroll — State benchmarkedThis home is ranked 26th out of 104 homes in North Carolina. Shows total annual staff payroll benchmarked to the North Carolina average. Higher payroll investment relative to peers often signals better staffing and less reliance on cheaper contract labor.Rankings are based only on facilities in North Carolina that report data for that category. Facilities without available data are excluded from the ranking.Click the rank badge to see the full State ranking.Click here to see the full State ranking.
$10.2M 134.2% of net patient revenue Info Payroll as a share of revenue: staff salaries and wage-related benefits divided by net patient revenue. A higher figure means more of each revenue dollar goes to staff pay. Rank #37 / 104Payroll % — State benchmarkedThis home is ranked 37th out of 104 homes in North Carolina. Shows payroll as a percentage of revenue versus the North Carolina average. Well-run North Carolina facilities typically land around 49–62% — the top third Statewide. Below 25% may signal understaffing or heavy agency use — read with Staffing ratings.Rankings are based only on facilities in North Carolina that report data for that category. Facilities without available data are excluded from the ranking.Click the rank badge to see the full State ranking.Click here to see the full State ranking.
Other operating costs Info Everything it costs to run the home apart from payroll — food, utilities, supplies, maintenance, contract labor and administration. Calculated as total operating expense minus payroll (staff salaries and wage-related benefits).
$13.6M
Total costs Info The home's total operating expense for the year — all the costs of running it, salaries included (CMS cost report, Worksheet G-3).
$23.8M

What does this home offer?

Pets allowed icon
Pets allowed icon

Pets Allowed

Room sizes icon
Room sizes icon

Room Sizes: 1 Bed / 2 Bed

Building type icon
Building type icon

Building Type: Mid-rise

Fitness and recreation icon

Fitness and Recreation

Dining services icon

Three Meals Per Day

Who this home usually serves

TYPE OF STAY

Primarily short stays

Residents typically stay for brief periods, with frequent admissions and discharges throughout the year.

Most new residents arrive under private pay (72% of admissions), and a typical private pay stay runs around 2 - 3 months.

Admissions
282 total

Coverage residents most often arrive under.

Medicare 27%
Private pay 72%
Discharges
274 total

Coverage residents most often leave under.

Medicare 25%
Private pay 74%
Medicaid 1%

Managed by Joshua Hillegass

Health Center Administrator

Living Spaces & Floor Plans for WhiteStone

Places of interest near WhiteStone

Address 3.7 miles from city center Info Estimated distance in miles from Greensboro's city center to WhiteStone's address, calculated via Google Maps.

Calculate Travel Distance to WhiteStone

Add your location

Address

Compare Nursing Homes around the area

The information below is reported by the North Carolina Department of Health and Human Services, Division of Health Service Regulation.

WhiteStone
NH
AL
IL
MC
Greensboro (Hewitt Area) -60 A+ 31 1 Bed / 2 Bed
Walnut Ridge
NH
AL
IL
MC
Walnut Cove (Windmill Street) -63 A+ 50 Studio / Suite
Givens Highland Farms
NH
HC
IL
NC
RC
Black Mountain -60 - 12 Studio / 1 Bed / 2 Bed / 3 Bed
Wesley Pines
NH
AL
IL
MC
Lumberton -62 A+ 9 1 Bed / Cottage / Villa
Parkwood Village and The Landing
NH
AL
IL
MC
RC
Wilson (Westwood) -70 - 42 1 Bed / 2 Bed

Frequently Asked Questions about WhiteStone

What neighborhood is WhiteStone in?

WhiteStone is in the Hewitt Area neighborhood of Greensboro.

Is WhiteStone in a walkable area?

WhiteStone has a walk score of 31. Somewhat walkable. A few nearby services may be reachable on foot, but most trips require transportation.

What is the occupancy rate at WhiteStone?

WhiteStone's occupancy is 69.2%.

Does WhiteStone operate as a for-profit or non-profit?

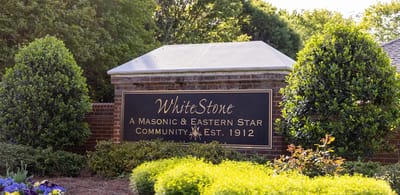
WhiteStone is registered as a non-profit in NC.

Are there photos of WhiteStone?

Yes — there are 4 photos of WhiteStone in the photo gallery on this page.

What is the address of WhiteStone?

WhiteStone is located at 700 S Holden Rd, Greensboro, NC 27407.

What is the phone number of WhiteStone?

(336) 299-0031 will put you in contact with the team at WhiteStone.

Guides for Better Senior Living

Care Cost Calculator: See Prices in Your Area

Nursing Home Data Explorer

Don’t Wait Too Long: 7 Red Flag Signs Your Parent Needs Assisted Living Now

The True Cost of Assisted Living in 2025 – And How Families Are Paying For It

Understanding Senior Living Costs: Pricing Models, Discounts & Financial Assistance