

Total health inspections
6
California average 12.5
Last Health inspection on Aug 2025

We arrange tours, appointments, and even moving support so you don’t have to

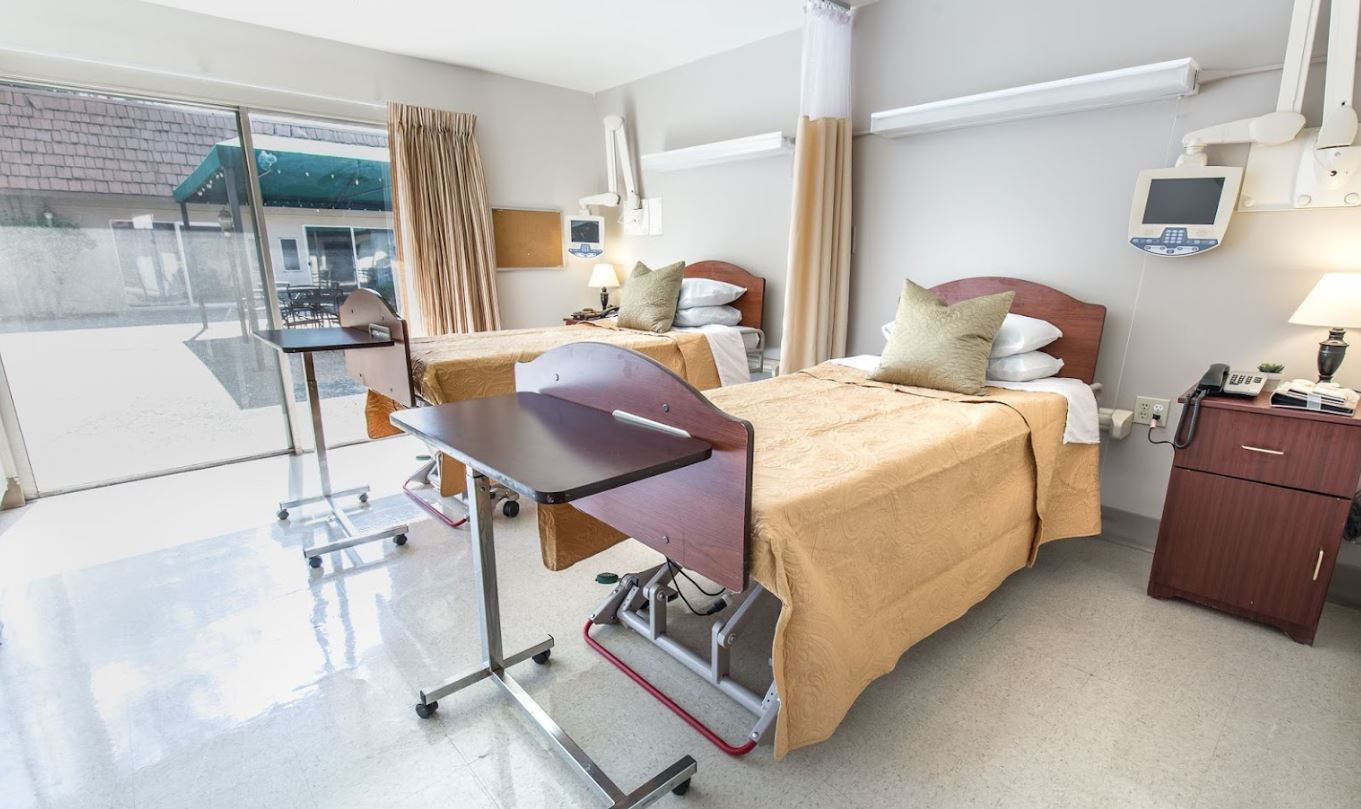
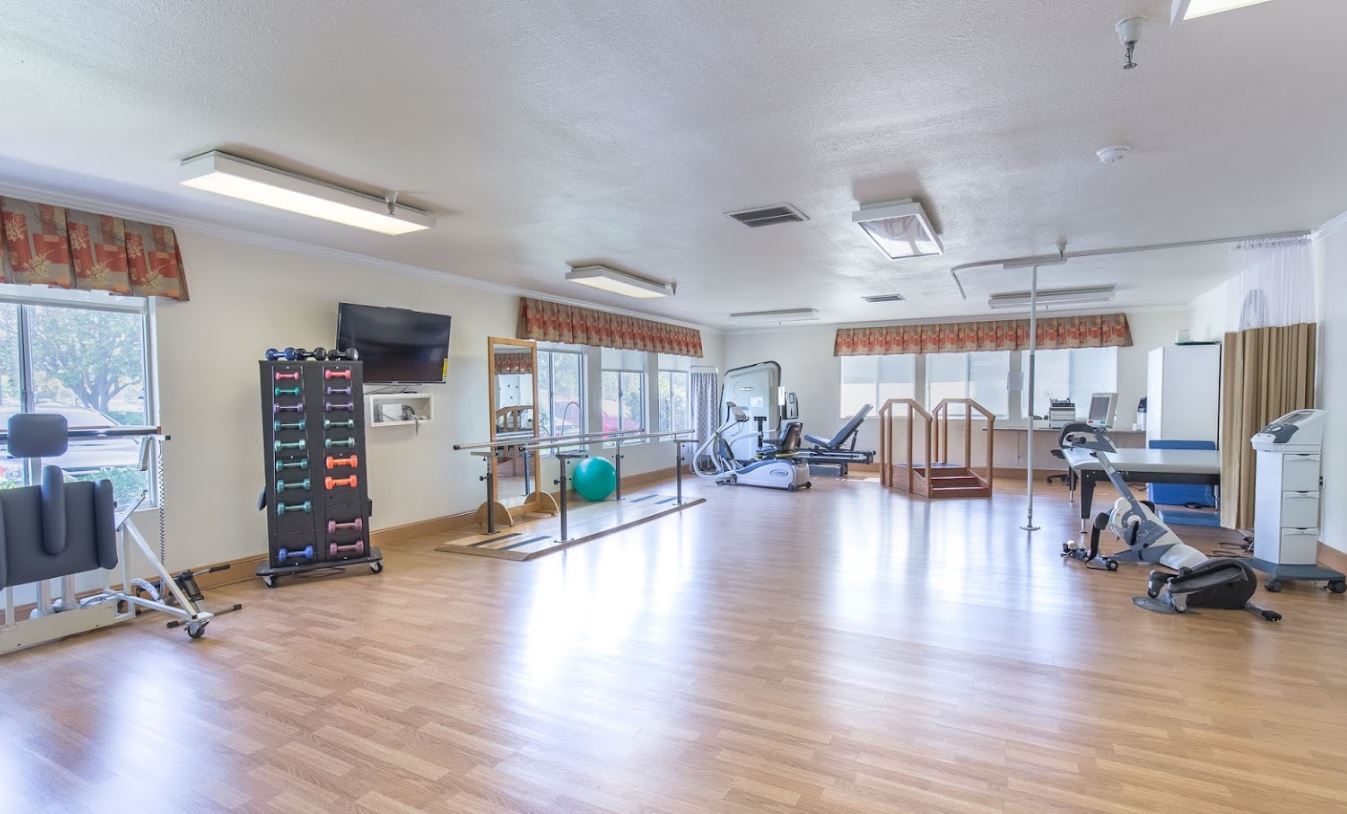
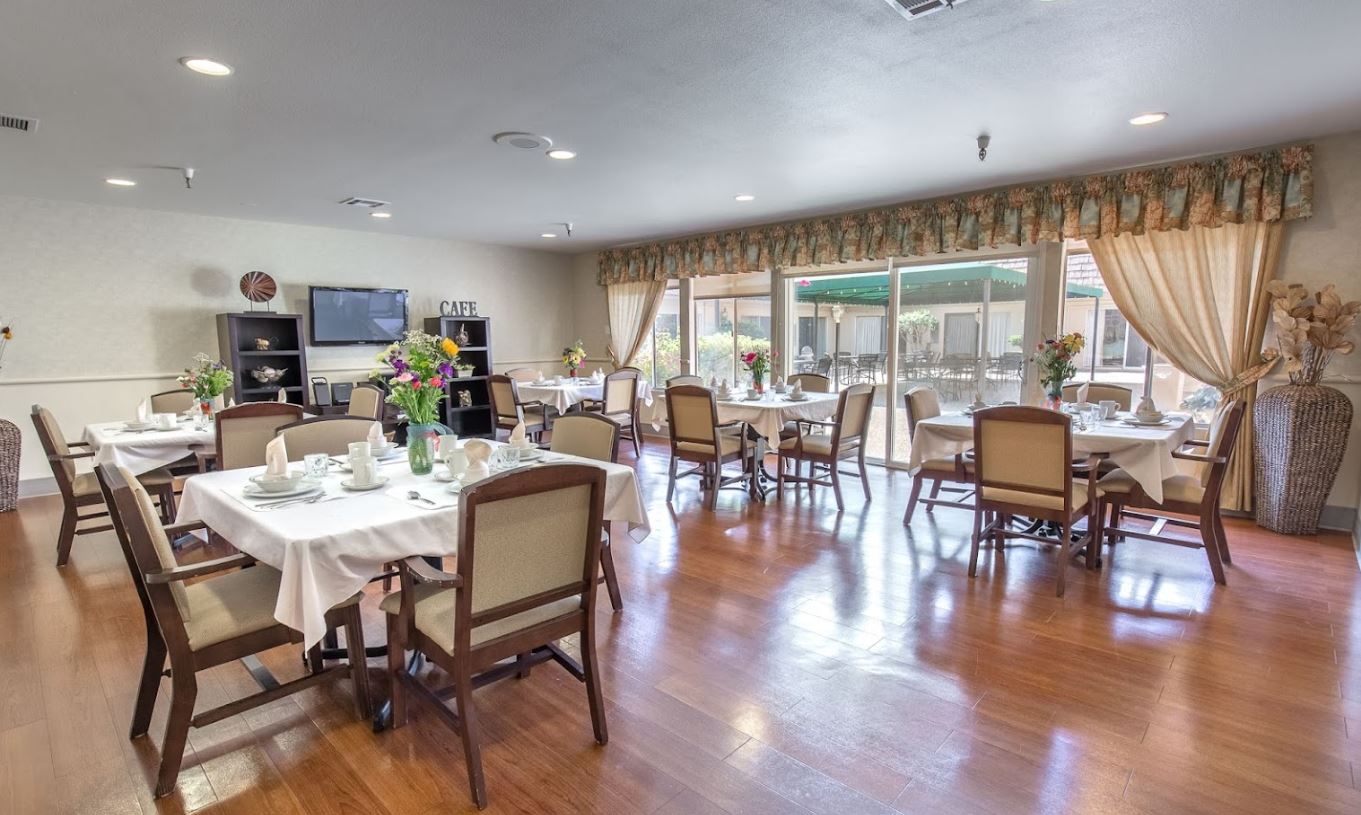
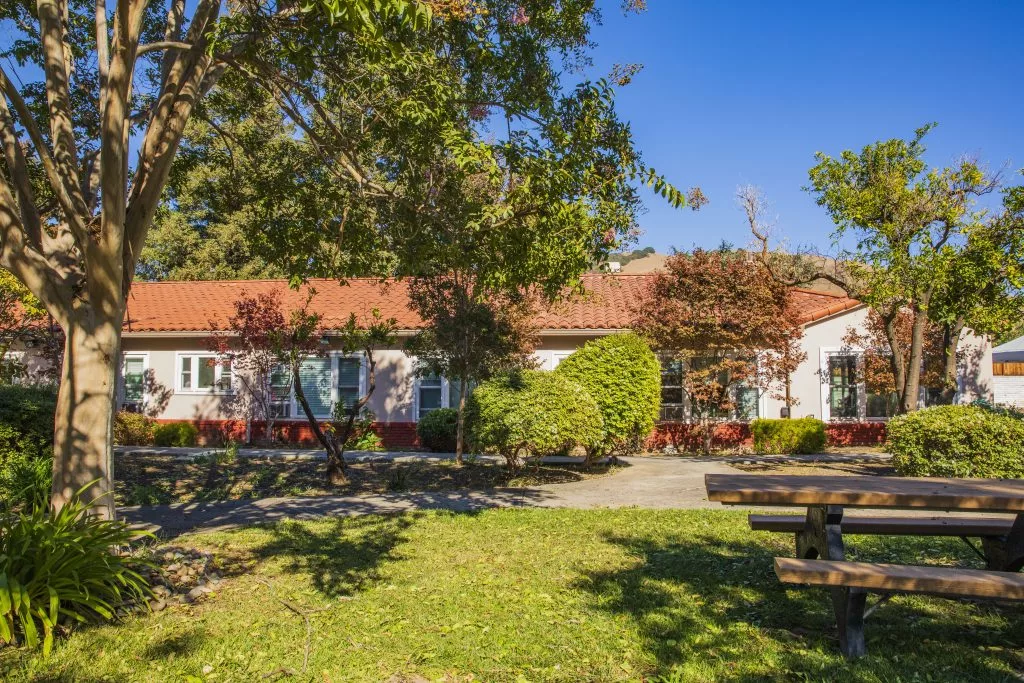
Windsor Country Drive Care Center is a tight-knit nursing home with a cozy atmosphere. With an emphasis on rehabilitation services, the community excels in delivering family-like treatment in support of a comfortable and secure environment for recovery. The patient-care center ensures that residents also cultivate a sense of freedom and enjoyment during healing.
Windsor Country Drive Care Center practices a resident-focused approach to achieve results. With its professional and patient caregivers and comprehensive care plans, residents will get to immerse themselves in a range of services that include 24/7 nursing care, calendar-filled activities, rehabilitative programs, diabetes management, medication monitoring, and ADLs.
Cynthia Lagatuz serves as the Administrator at Windsor Country Drive Care Center, leading the community with dedication and professionalism. She oversees operations to ensure quality care and a supportive environment for all residents.
 Official CMS rating based on health inspections, staffing and quality measures.
Official CMS rating based on deficiencies found during state health inspections.
Official CMS rating based on nurse staffing hours per resident per day.
Official CMS rating based on clinical outcomes for residents.
Average daily nursing hours per resident (adjusted for acuity). Higher values indicate more nursing time per resident.
Official CMS rating based on health inspections, staffing and quality measures.
Official CMS rating based on deficiencies found during state health inspections.
Official CMS rating based on nurse staffing hours per resident per day.
Official CMS rating based on clinical outcomes for residents.
Average daily nursing hours per resident (adjusted for acuity). Higher values indicate more nursing time per resident.
Offers a balance of services and community atmosphere.
Lower occupancy suggests more openings may be available.
Most residents stay long-term, while a smaller portion are admitted for short-term rehab.
9% of new residents, usually for short-term rehab.
72% of new residents, often for short stays.
19% of new residents, often for long-term daily care.
The portion of the home's budget spent on staff, including nurses, caregivers, and other employees who support care and operations.
All remaining costs needed to run the home, such as food, utilities, building maintenance, supplies and administrative expenses.
Assisted Living For seniors needing help with daily tasks but not full-time nursing.
Nursing Homes 24/7 care needed
Nursing Homes 24/7 care needed
Assisted Living For seniors needing help with daily tasks but not full-time nursing.
Nursing Homes 24/7 care needed
Assisted Living For seniors needing help with daily tasks but not full-time nursing.
Nursing Homes 24/7 care needed
Nursing Homes 24/7 care needed
 Niles Canyon Post Acute
 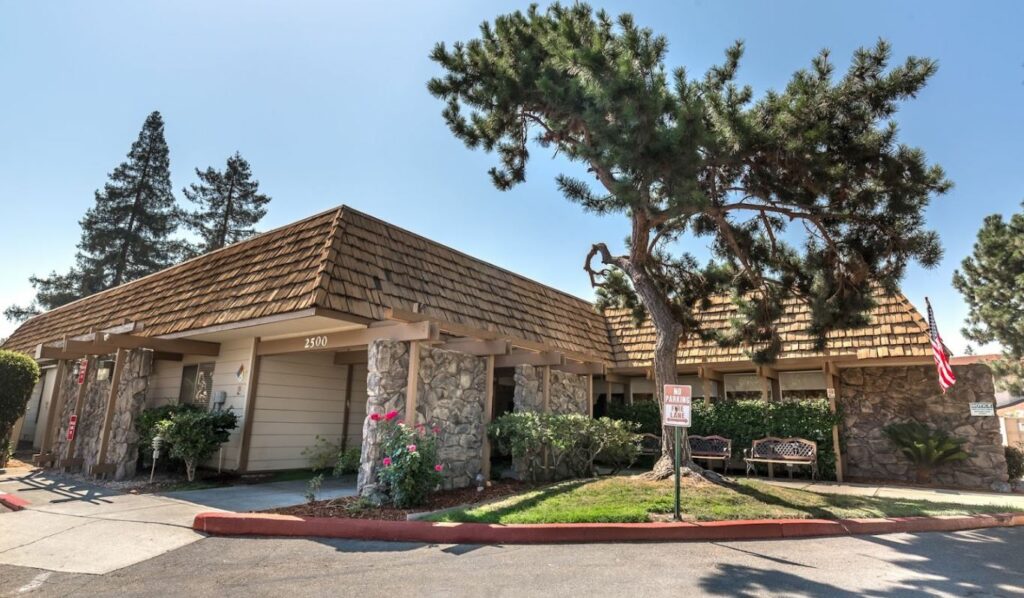 Windsor Country Drive Care Center
  Fremont Healthcare Center
 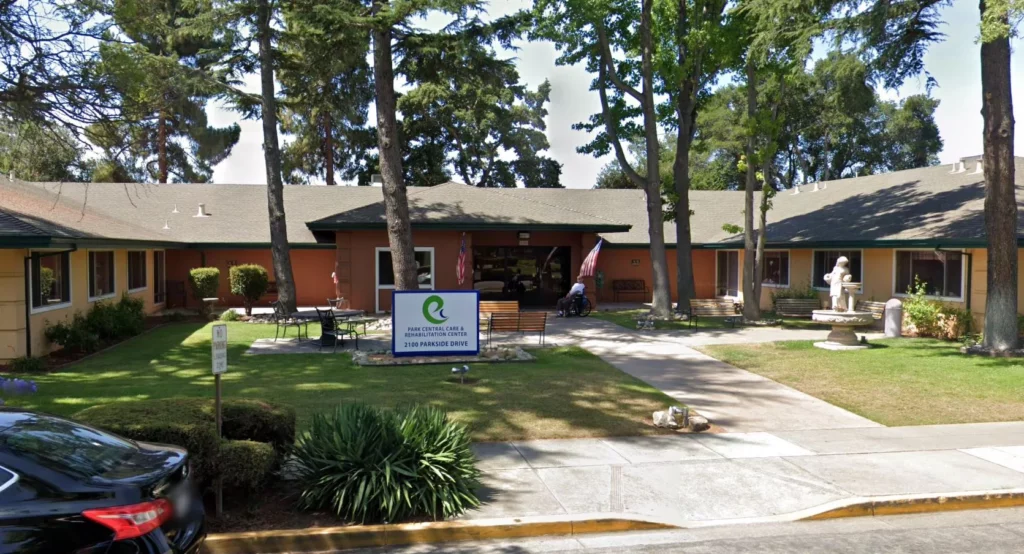 Park Central Care & Rehabilitation Center
![]() 1.2 miles from city center — 0.88 miles to nearest hospital (Pulmonary: Fremont Center: Palo Alto Medical Foundation)
1.2 miles from city center — 0.88 miles to nearest hospital (Pulmonary: Fremont Center: Palo Alto Medical Foundation)
![]() 2500 Country Dr, Fremont, CA 94536
2500 Country Dr, Fremont, CA 94536
Add your location
Source: CMS Payroll-Based Journal (Q2 2025)
| Role ⓘ | Count ⓘ | Avg Shift (hrs) ⓘ | Uses Contractors? ⓘ |
|---|---|---|---|
| Registered Nurse | 15 | 7.6 | No |
| Licensed Practical Nurse | 21 | 8.3 | No |
| Certified Nursing Assistant | 62 | 7.6 | No |
| Role ⓘ | Employees ⓘ | Contractors ⓘ | Total Staff ⓘ | Total Hours ⓘ | Days Worked ⓘ | % of Days ⓘ | Avg Shift (hrs) ⓘ |
|---|---|---|---|---|---|---|---|
| Certified Nursing Assistant | 62 | 0 | 62 | 25,182 | 91 | 100% | 7.6 |
| Licensed Practical Nurse | 21 | 0 | 21 | 7,180 | 91 | 100% | 8.3 |
| Registered Nurse | 15 | 0 | 15 | 5,218 | 91 | 100% | 7.6 |
| Other Dietary Services Staff | 3 | 0 | 3 | 1,411 | 91 | 100% | 7.8 |
| Dental Services Staff | 6 | 0 | 6 | 1,277 | 71 | 78% | 7.4 |
| RN Director of Nursing | 5 | 0 | 5 | 1,171 | 78 | 86% | 7.5 |
| Respiratory Therapy Technician | 0 | 14 | 14 | 1,092 | 84 | 92% | 5.5 |
| Speech Language Pathologist | 0 | 6 | 6 | 839 | 83 | 91% | 6.4 |
| Physical Therapy Assistant | 0 | 10 | 10 | 624 | 72 | 79% | 4.8 |
| Clinical Nurse Specialist | 2 | 0 | 2 | 622 | 66 | 73% | 8.2 |
| Occupational Therapy Aide | 2 | 0 | 2 | 512 | 63 | 69% | 8 |
| Physical Therapy Aide | 0 | 12 | 12 | 467 | 67 | 74% | 4.9 |
| Nurse Practitioner | 1 | 0 | 1 | 464 | 59 | 65% | 7.9 |
| Administrator | 1 | 0 | 1 | 448 | 56 | 62% | 8 |
| Qualified Social Worker | 0 | 5 | 5 | 255 | 49 | 54% | 5 |
| Occupational Therapy Assistant | 0 | 1 | 1 | 57 | 8 | 9% | 7.1 |
| Medical Director | 0 | 1 | 1 | 36 | 12 | 13% | 3 |
| Dietitian | 1 | 0 | 1 | 7 | 1 | 1% | 7 |
California average 12.5
Last Health inspection on Aug 2025
Health citations are formal notices following inspections when they fail to comply with safety and care standards.
30 of 33 citations resulted from standard inspections; and 3 of 33 resulted from complaint investigations.
California average: 0.4
California average: 1
Data sourced from CMS Health Deficiencies reports. Citation severity codes range from A (least serious) to L (most serious). Immediate Jeopardy (J-L) citations indicate situations where the facility's noncompliance has placed residents at risk of death or serious harm.
Source: CMS Long-Term Care Facility Characteristics (Data as of Jan 2026)
Active councils help families stay involved in care decisions and facility operations.
These measures show how residents usually do over time at this home, based on health outcomes and preventive care.
California average: 6.6
California average: 11.3
California average: 11.1%
California average: 12.0%
California average: 11.3%
California average: 1.7%
California average: 5.0%
California average: 1.2%
California average: 4.2%
California average: 6.7%
California average: 10.1%
California average: 98.5%
California average: 98.2%
California average: 94.0%
California average: 1.5%
California average: 93.2%
Quality measures are calculated from Minimum Data Set (MDS) assessments. For most measures, lower percentages indicate better care quality.
Historical financial and operational data for Windsor Country Drive Care Center based on CMS SNF Cost Reports.
Loading trend charts...
Care Cost Calculator: See Prices in Your Area
Nursing Home Data Explorer
Don’t Wait Too Long: 7 Red Flag Signs Your Parent Needs Assisted Living Now
The True Cost of Assisted Living in 2025 – And How Families Are Paying For It
Understanding Senior Living Costs: Pricing Models, Discounts & Financial Assistance

We help families find affordable senior communities and unlock same day discounts, Medicaid, and Medicare options tailored to your needs.
Contact us Today
Touring a community? Use this expert-backed checklist to stay organized, ask the right questions, and find the perfect fit.
We'll send you a PDF version of the touring checklist.


