


Total health inspections
6
California average 12.5
Last Health inspection on Aug 2025
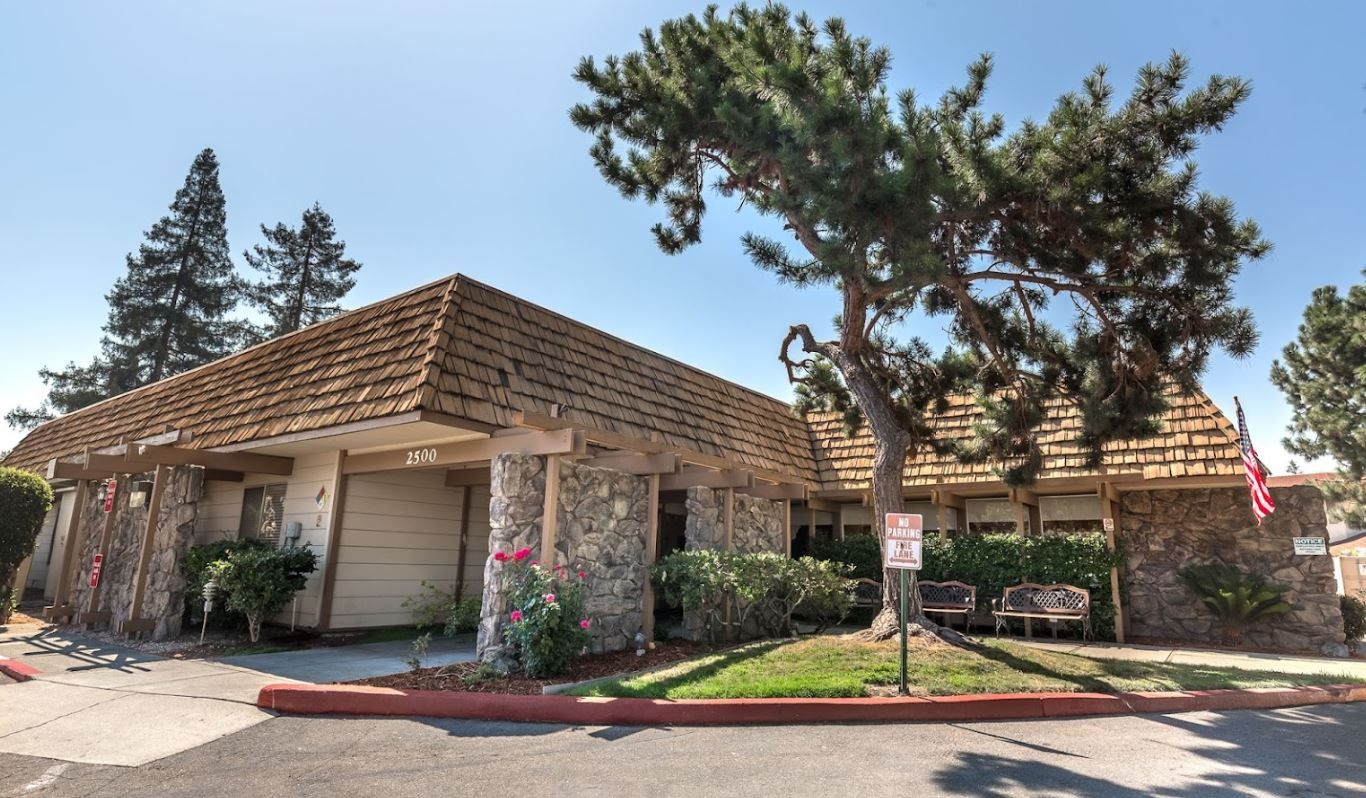
Windsor Country Drive Care Center is a tight-knit nursing home with a cozy atmosphere. With an emphasis on rehabilitation services, the community excels in delivering family-like treatment in support of a comfortable and secure environment for recovery. The patient-care center ensures that residents also cultivate a sense of freedom and enjoyment during healing.
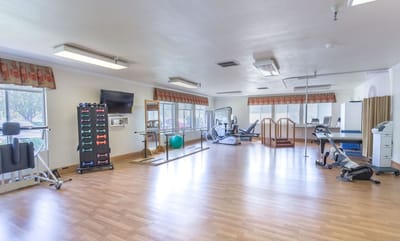
Windsor Country Drive Care Center practices a resident-focused approach to achieve results. With its professional and patient caregivers and comprehensive care plans, residents will get to immerse themselves in a range of services that include 24/7 nursing care, calendar-filled activities, rehabilitative programs, diabetes management, medication monitoring, and ADLs.
| Staff type | Hours / Day / Resident | vs state avg |
|---|---|---|
|
Registered Nurse (RN)
| 46m per day | ▲ 17% State avg: 39m per day · National avg: 41m per day |
|
LPN / LVN
| 36m per day | ▼ 50% State avg: 1h 13m per day · National avg: 52m per day |
|
Nurse Aide
| 2h 37m per day | ■ Avg State avg: 2h 39m per day · National avg: 2h 21m per day |
|
Weekend Total Nursing
| 3h 50m per day | ▼ 6% State avg: 4h 5m per day · National avg: 3h 26m per day |
|
Physical Therapist
| 9m per day | ▲ 75% State avg: 5m per day · National avg: 4m per day |
|
Weekend RN
| 43m per day | ▲ 45% State avg: 30m per day · National avg: 29m per day |
Key information about the people who lead and staff this community.
In California, the Department of Social Services (for assisted living facilities) and the Department of Public Health (for nursing homes) conduct inspections to ensure resident safety and regulatory compliance.
California average 12.5
Last Health inspection on Aug 2025
California average 50.2
California average 4.65
Health citations are formal notices following inspections when they fail to comply with safety and care standards.
30 of 33 citations resulted from standard inspections; and 3 of 33 resulted from complaint investigations.
California average: 0.4
California average: 1
Reporting period: October 1 – December 31, 2025 (Q4 2025). Source: CMS Payroll-Based Journal report.
Manages medical care and health needs.
Assists with medical care and medications.
Helps with daily care and mobility.
Total hours from contractors
5,010 contractor hours this quarter
| Certified Nursing Assistant | 65 | 0 | 65 | 26,923 | 92 | 100% | 7.9 |
| Registered Nurse | 22 | 0 | 22 | 6,925 | 92 | 100% | 7.9 |
| Licensed Practical Nurse | 21 | 0 | 21 | 4,185 | 92 | 100% | 8.6 |
| RN Director of Nursing | 6 | 0 | 6 | 2,045 | 82 | 89% | 8.3 |
| Dental Services Staff | 4 | 0 | 4 | 1,558 | 70 | 76% | 7.9 |
| Respiratory Therapy Technician | 0 | 10 | 10 | 1,499 | 83 | 90% | 6.7 |
| Other Dietary Services Staff | 4 | 0 | 4 | 1,473 | 92 | 100% | 7.7 |
| Physical Therapy Assistant | 0 | 10 | 10 | 992 | 84 | 91% | 6.1 |
| Speech Language Pathologist | 0 | 6 | 6 | 818 | 83 | 90% | 6.1 |
| Physical Therapy Aide | 0 | 5 | 5 | 643 | 73 | 79% | 7.9 |
| Qualified Social Worker | 0 | 5 | 5 | 530 | 65 | 71% | 6.5 |
| Clinical Nurse Specialist | 2 | 0 | 2 | 507 | 54 | 59% | 8 |
| Administrator | 1 | 0 | 1 | 504 | 63 | 68% | 8 |
| Occupational Therapy Aide | 1 | 0 | 1 | 488 | 61 | 66% | 8 |
| Therapeutic Recreation Specialist | 0 | 1 | 1 | 431 | 57 | 62% | 7.6 |
| Nurse Practitioner | 1 | 0 | 1 | 424 | 53 | 58% | 8 |
| Occupational Therapy Assistant | 0 | 1 | 1 | 61 | 10 | 11% | 6.1 |
| Medical Director | 0 | 1 | 1 | 36 | 14 | 15% | 2.6 |
| Dietitian | 1 | 0 | 1 | 8 | 1 | 1% | 8 |
Federal penalties imposed by CMS for regulatory violations, including civil money penalties (fines) and denials of payment for new Medicare/Medicaid admissions.
Source: CMS Penalties Database
No penalties in the past 3 years
No civil money penalties or payment denials were reported in the last 3 years.
These measures show how residents usually do over time at this home, based on health outcomes and preventive care.
California average: 6.6
California average: 11.3
California average: 11.1%
California average: 12.0%
California average: 11.3%
California average: 1.7%
California average: 5.0%
California average: 1.2%
California average: 4.2%
California average: 6.7%
California average: 10.1%
California average: 98.5%
California average: 98.2%
California average: 2.25
California average: 1.59
California average: 94.0%
California average: 1.5%
California average: 93.2%
California average: 23.2%
California average: 11.2%
California average: 0.8%
California average: 53.7%
California average: 50.6%
Quality measures are calculated from Minimum Data Set (MDS) assessments. For most measures, lower percentages indicate better care quality.
9% of new residents, usually for short-term rehab.
72% of new residents, often for short stays.
19% of new residents, often for long-term daily care.
Source: CMS Long-Term Care Facility Characteristics (Data as of Jan 2026)
Residents meet regularly to discuss policies, care quality, and activities
Organized group of residents that meets regularly to discuss facility policies, quality of life, and activities.
Data sourced from CMS Long-Term Care Facility Characteristics quarterly report. Payer mix reflects the current resident census by primary payment source.
Historical financial and operational data for Windsor Country Drive Care Center from 2011–2023, based on CMS SNF Cost Reports.
Key figures below are for fiscal year ending in 12/2023.
Based on CMS SNF Cost Report for fiscal year ending in 12/2023.
Most residents stay long-term, while a smaller portion are admitted for short-term rehab.
Most new residents arrive under private pay (72% of admissions), and a typical private pay stay runs around 29 days.
Coverage residents most often arrive under.
Coverage residents most often leave under.
![]() 1.2 miles from city center
1.2 miles from city center
![]() Estimated distance in miles from Fremont's city center to Windsor Country Drive Care Center's address, calculated via Google Maps.
Estimated distance in miles from Fremont's city center to Windsor Country Drive Care Center's address, calculated via Google Maps.
Add your location
Info below is compiled from CMS reports & the CA Dept. of Social Services (CDSS), senior community websites & trusted data sources such as Walk Score & BBB.
Communities are listed from highest to lowest based on our ranking methodology.
| Niles Canyon Post Acute | NH SNF | Fremont (Canyon Heights - Vallejo Mills) | 73
Facility
73
CA AVG
104
Rank
#973 / 1644 |
87.0%
Facility
87.0%
CA AVG
73.9
Rank
#413 / 1492 | +18% | 4.24
Facility
4.24
CA AVG
4.22
Rank
#116 / 293 | -52% | +1% | $6.3k
Facility
$6.3k
CA AVG
$56.5k
Rank
#184 / 298 | - | 10
Facility
10
CA AVG
50.2
Rank
#5 / 293 | 3.3
Facility
3.3
CA AVG
4.6
Rank
#77 / 293 | - | 64 | A |
30
Facility
30
CA AVG
57
Rank
#1715 / 2087 | - | $10.8MFiscal year ending 12/2023
Facility
$10.8MFiscal year ending 12/2023
CA AVG
$17.0M
Rank
#252 / 295 | $5.1MFiscal year ending 12/2023
Facility
$5.1MFiscal year ending 12/2023
CA AVG
$7.0M
Rank
#226 / 295 | 47.1%Fiscal year ending 12/2023
Facility
47.1%Fiscal year ending 12/2023
CA AVG
45.2%
Rank
#33 / 295 | 55562 | ||||
| Mission Valley Post Acute | NH SNF | Fremont (Centerville) | 85
Facility
85
CA AVG
104
Rank
#879 / 1644 |
96.6%
Facility
96.6%
CA AVG
73.9
Rank
#176 / 1492 | +31% | 3.63
Facility
3.63
CA AVG
4.22
Rank
#222 / 293 | +21% | -14% | $0
Facility
$0
CA AVG
$56.5k
Rank
#1 / 298 | - | 22
Facility
22
CA AVG
50.2
Rank
#47 / 293 | 5.5
Facility
5.5
CA AVG
4.6
Rank
#228 / 293 | - | 82 | A |
72
Facility
72
CA AVG
57
Rank
#673 / 2087 | Kelly Bills | $11.8M*Fiscal year ending 12/2022These figures are from this home's most recent complete cost report — an older period than most facilities report. Compare with that in mind.
Facility
$11.8M*Fiscal year ending 12/2022These figures are from this home's most recent complete cost report — an older period than most facilities report. Compare with that in mind.
CA AVG
$17.0M
Rank
#202 / 295 | $5.6M*Fiscal year ending 12/2022These figures are from this home's most recent complete cost report — an older period than most facilities report. Compare with that in mind.
Facility
$5.6M*Fiscal year ending 12/2022These figures are from this home's most recent complete cost report — an older period than most facilities report. Compare with that in mind.
CA AVG
$7.0M
Rank
#198 / 295 | 47.3%*Fiscal year ending 12/2022These figures are from this home's most recent complete cost report — an older period than most facilities report. Compare with that in mind.
Facility
47.3%*Fiscal year ending 12/2022These figures are from this home's most recent complete cost report — an older period than most facilities report. Compare with that in mind.
CA AVG
45.2%
Rank
#144 / 295 | 55276 | ||||
| Fremont Healthcare Center | NH SNF | Fremont (Sundale) | 115
Facility
115
CA AVG
104
Rank
#615 / 1644 |
89.6%
Facility
89.6%
CA AVG
73.9
Rank
#360 / 1492 | +21% | 4.14
Facility
4.14
CA AVG
4.22
Rank
#134 / 293 | +55% | -2% | $12.1k
Facility
$12.1k
CA AVG
$56.5k
Rank
#209 / 298 | - | 22
Facility
22
CA AVG
50.2
Rank
#47 / 293 | 4.4
Facility
4.4
CA AVG
4.6
Rank
#175 / 293 | - | 103 | A+ |
78
Facility
78
CA AVG
57
Rank
#485 / 2087 | Fremont Holding Company Gp LLC | $16.5MFiscal year ending 12/2023
Facility
$16.5MFiscal year ending 12/2023
CA AVG
$17.0M
Rank
#103 / 295 | $8.2MFiscal year ending 12/2023
Facility
$8.2MFiscal year ending 12/2023
CA AVG
$7.0M
Rank
#91 / 295 | 49.9%Fiscal year ending 12/2023
Facility
49.9%Fiscal year ending 12/2023
CA AVG
45.2%
Rank
#151 / 295 | 56422 | ||||
| Windsor Country Drive Care Center | NH MC SNF | Fremont (Centerville) | 126
Facility
126
CA AVG
104
Rank
#519 / 1644 |
88.9%
Facility
88.9%
CA AVG
73.9
Rank
#377 / 1492 | +20% | 3.81
Facility
3.81
CA AVG
4.22
Rank
#189 / 293 | +48% | -10% | $0
Facility
$0
CA AVG
$56.5k
Rank
#1 / 298 | - | 33
Facility
33
CA AVG
50.2
Rank
#115 / 293 | 5.5
Facility
5.5
CA AVG
4.6
Rank
#228 / 293 | 1 | 112 | C+ |
79
Facility
79
CA AVG
57
Rank
#450 / 2087 | - | $17.4MFiscal year ending 12/2023
Facility
$17.4MFiscal year ending 12/2023
CA AVG
$17.0M
Rank
#92 / 295 | $9.3MFiscal year ending 12/2023
Facility
$9.3MFiscal year ending 12/2023
CA AVG
$7.0M
Rank
#103 / 295 | 53.3%Fiscal year ending 12/2023
Facility
53.3%Fiscal year ending 12/2023
CA AVG
45.2%
Rank
#192 / 295 | 55885 | ||||
| Park Central Care & Rehabilitation Center | NH | Fremont (Centerville) | 99
Facility
99
CA AVG
104
Rank
#724 / 1644 |
62.6%
Facility
62.6%
CA AVG
73.9
Rank
#1144 / 1492 | -15% | 4.42
Facility
4.42
CA AVG
4.22
Rank
#88 / 293 | -42% | +5% | $0
Facility
$0
CA AVG
$56.5k
Rank
#1 / 298 | - | 20
Facility
20
CA AVG
50.2
Rank
#34 / 293 | 6.7
Facility
6.7
CA AVG
4.6
Rank
#262 / 293 | 1 | 62 | A+ |
75
Facility
75
CA AVG
57
Rank
#562 / 2087 | Antony Thekkek | $9.9MFiscal year ending 12/2023
Facility
$9.9MFiscal year ending 12/2023
CA AVG
$17.0M
Rank
#262 / 295 | $6.7MFiscal year ending 12/2023
Facility
$6.7MFiscal year ending 12/2023
CA AVG
$7.0M
Rank
#209 / 295 | 67.4%Fiscal year ending 12/2023
Facility
67.4%Fiscal year ending 12/2023
CA AVG
45.2%
Rank
#8 / 295 | 56298 |
Windsor Country Drive Care Center is located in Fremont, California.
Here are the financial assistance programs available to residents in California.
Windsor Country Drive Care Center is in the Centerville neighborhood of Fremont.
Windsor Country Drive Care Center has a walk score of 79. Very walkable. Most errands can be accomplished on foot, and many essentials are within a short walk.
Windsor Country Drive Care Center's occupancy is 83.8%.
No, Windsor Country Drive Care Center has a no-pet policy.
Windsor Country Drive Care Center is registered as a for-profit in CA.
Yes — there are 4 photos of Windsor Country Drive Care Center in the photo gallery on this page.
Windsor Country Drive Care Center is located at 2500 Country Dr, Fremont, CA 94536.
Care Cost Calculator: See Prices in Your Area
Nursing Home Data Explorer
Don’t Wait Too Long: 7 Red Flag Signs Your Parent Needs Assisted Living Now
The True Cost of Assisted Living in 2025 – And How Families Are Paying For It
Understanding Senior Living Costs: Pricing Models, Discounts & Financial Assistance


