Windsor House at Champion
Nursing Home & Memory Care · Warren, OH
CMS overall rating Info CMS (the Centers for Medicare & Medicaid Services) is the federal agency that rates nursing home quality. Its Overall Rating runs from 1 to 5 stars, combining health inspections, staffing, and quality measures, with inspections weighted most heavily.

Windsor House at Champion

Nursing Home & Memory Care · Warren, OH
CMS overall rating Info CMS (the Centers for Medicare & Medicaid Services) is the federal agency that rates nursing home quality. Its Overall Rating runs from 1 to 5 stars, combining health inspections, staffing, and quality measures, with inspections weighted most heavily.
Calculator: See prices in your area
Windsor House at Champion accepts Medicare, Medicaid, and private pay.

Overview of Windsor House at Champion

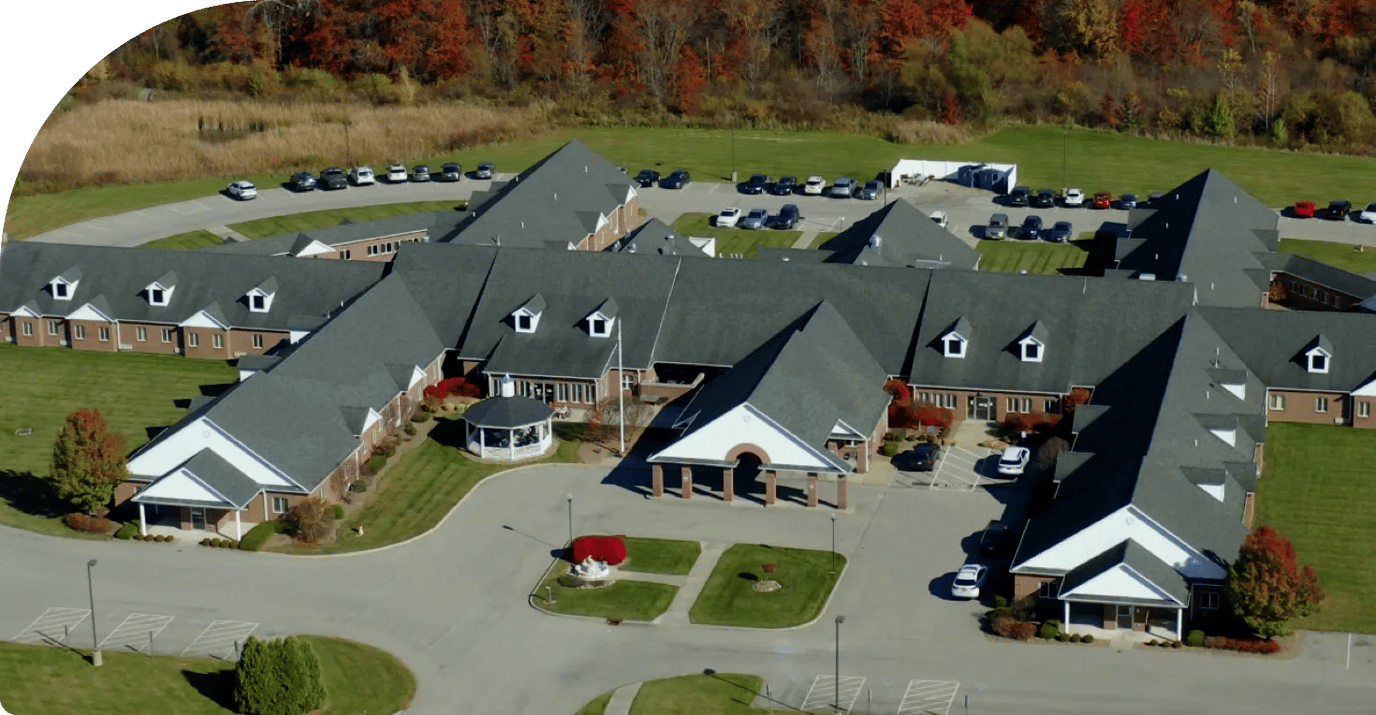
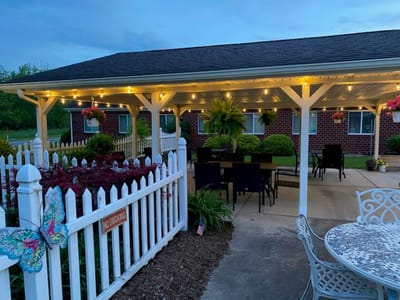
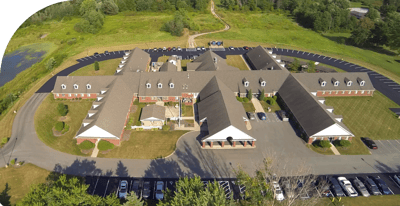
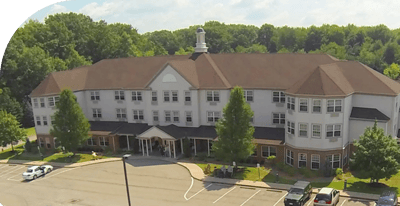
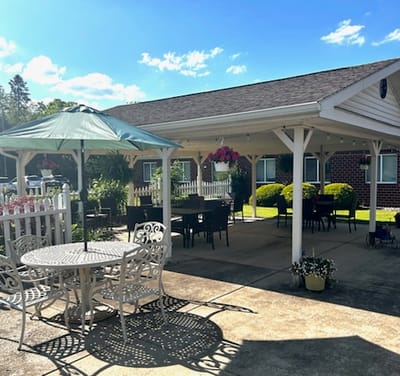
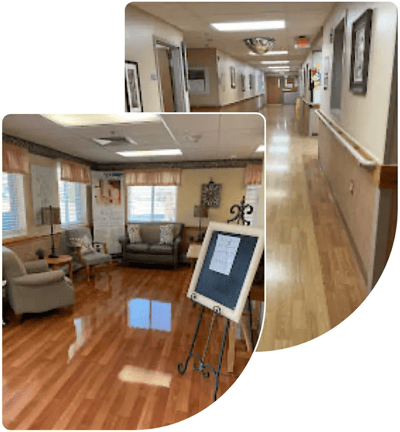
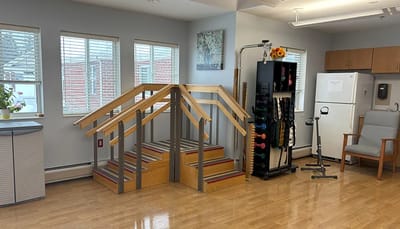
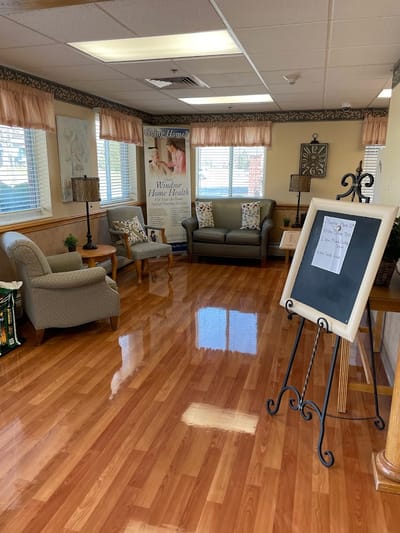
Enjoy a maintenance-free lifestyle within a serene setting at Windsor House at Champion, a blissful senior living community in Warren, OH that offers an array of compassionate services. Residents enjoy access to long-term care, respite and short-term rehabilitation stays, memory care, and hospice care. With beautifully designed accommodations, residents can comfortably enjoy their personal time with utmost safety and convenience.

In addition to tailored care plans, residents are offered vibrant programs and activities, such as games, movies, celebrations, and more to keep residents happy and busy. Convenient services, such as housekeeping, laundry, and maintenance are also available to give residents a carefree living experience. At Windsor House at Champion, everyone is bound to enjoy their lives on their own terms and with utmost convenience.

Quality ratings

Measured by Centers for Medicare & Medicaid Services (CMS)

Overall rating Info The Overall CMS Rating combines results from health inspections, staffing levels and quality measures. Health inspections carry the most weight. Staffing and quality scores can increase or decrease the final rating based on performance compared to state and national standards.
Health Inspection Info Based on the results of the facility's three most recent standard inspections and any complaint investigations. CMS reviews the number, scope, and severity of deficiencies, with more recent findings weighted more heavily.
Staffing Info Measures average nursing staff hours per resident per day, including Registered Nurses (RNs) and total nursing staff. Ratings are adjusted based on the level of care residents require and are compared to state and national benchmarks.
Quality Measures Info Based on clinical and physical health indicators reported to CMS, such as hospital readmissions, falls, pressure ulcers, and improvements in mobility. These measures reflect how well residents' health needs are being managed.

Staffing hours breakdown

Info Daily nursing hours per resident by staff type, reported to CMS. Higher is generally better — compare this facility to state and national averages to see where staffing stands.

Hours per resident per day — compared to state averages

Total nursing care / resident Info Total adjusted nursing hours per resident per day, combining RN, LPN, and aide time. CMS adjusts this for case-mix so facilities can be fairly compared.
3h 40m per day
Rank #72 / 210Nurse hours — State benchmarkedThis home is ranked 72nd out of 210 homes in Ohio. Shows adjusted nurse hours per resident per day benchmarked to the Ohio average, with a ranking across 210 Ohio facilities. More hours mean more direct care. The national average is about 3.5 hrs; below 3.0 is a red flag.Rankings are based only on facilities in Ohio that report data for that category. Facilities without available data are excluded from the ranking.Click the rank badge to see the full State ranking.Click here to see the full State ranking.
vs avg

5 of 6 metrics below state avg

Standout metric LPN / LVN is +16% above state avg
Staff typeHours / Day / Residentvs state avg
Registered Nurse (RN) Info RNs hold the highest nursing license and can assess residents, interpret test results, and direct care plans. More RN hours per day often signals stronger clinical oversight and faster response to health changes. 32m per day ▼ 16% State avg: 38m per day · National avg: 41m per day
LPN / LVN Info Licensed Practical Nurses (LPNs) or Licensed Vocational Nurses (LVNs) deliver routine hands-on care — medication administration, wound dressing, and monitoring vital signs. They work under RN supervision and make up a large share of daily bedside care. 1h 7m per day ▲ 16% State avg: 58m per day · National avg: 52m per day
Nurse Aide Info Certified Nurse Aides (CNAs) provide the most direct day-to-day assistance: bathing, dressing, feeding, and mobility. Nurse aide hours are typically the largest staffing category and directly affect residents' quality of life. 1h 55m per day ▼ 10% State avg: 2h 8m per day · National avg: 2h 21m per day
Weekend Total Nursing Info Combined nursing hours (RN + LPN + Nurse Aide) per resident per day on weekends. Staffing often drops on weekends — this figure reveals whether the facility maintains adequate coverage outside of weekday hours. 3h 0m per day ▼ 9% State avg: 3h 17m per day · National avg: 3h 26m per day
Physical Therapist Info Hours per resident per day provided by licensed Physical Therapists (PTs) or PT Assistants. PT services help residents recover mobility after injury or illness and are especially important for post-acute (short-stay) rehabilitation. 2m per day ▼ 44% State avg: 3m per day · National avg: 4m per day
Weekend RN Info Registered nurse hours specifically on weekends. Facilities sometimes reduce RN presence on Saturdays and Sundays — a low weekend RN figure compared to weekday hours can indicate reduced clinical oversight when most administrative staff are absent. 22m per day ▼ 12% State avg: 25m per day · National avg: 29m per day

Capacity and availability

This home usually has limited availability

Similar occupancy to the state average
Occupancy rate
91.2% Rank #60 / 211Occupancy rate — State benchmarkedThis home is ranked 60th out of 211 homes in Ohio. Shows this facility's occupancy rate versus the Ohio average, with its Statewide rank out of 211. Higher occupancy signals strong local demand and financial stability.Rankings are based only on facilities in Ohio that report data for that category. Facilities without available data are excluded from the ranking.Click the rank badge to see the full State ranking.Click here to see the full State ranking.
Avg. Length of Stay
58 days
Bed community size
100-bed community Rank #72 / 323Bed count — State benchmarkedThis home is ranked 72nd out of 323 homes in Ohio. Shows this facility's certified or reported bed count compared to other Ohio facilities. Larger communities may offer more amenities, programs, and on-site services for residents and families.Rankings are based only on facilities in Ohio that report data for that category. Facilities without available data are excluded from the ranking.Click the rank badge to see the full State ranking.Click here to see the full State ranking.
A larger shared setting that may offer more common spaces and organized community services.
Walk Score
Walk Score: 28 / 100 Rank #465 / 705Walk Score — State benchmarkedThis home is ranked 465th out of 705 homes in Ohio. Shows how walkable this facility's neighborhood is compared to the average Walk Score across Ohio facilities. Higher scores benefit residents, families, and staff.Rankings are based only on facilities in Ohio that report data for that category. Facilities without available data are excluded from the ranking.Click the rank badge to see the full State ranking.Click here to see the full State ranking.
Somewhat walkable. A few nearby services may be reachable on foot, but most trips require transportation.

Staffing & Medical

1 service
24-Hour Staffing

Amenities & Lifestyle

Restaurant-Style Dining
Organized Activities
Inviting Social Spaces
Beautiful Outdoor Spaces
On-Site Religious Services
Craft And Hobby Room
Community Programs
Religious Services

Contact Windsor House at Champion

Staffing Data

Reporting period: October 1 – December 31, 2025 (Q4 2025). Source: CMS Payroll-Based Journal report.

Total staff 162
Employees 121
Contractors 41
Staff to resident ratio 2.03 : 1
0% compared with State average

State average ratio: 0 : 0

Avg staff/day 49
Average shift 7.9 hours
0% compared with State average

State average: 0 hours

Total staff hours (quarter) 35,731

Nursing staff breakdown

Q4 2025 · Oct 1 – Dec 31 More info This data comes from the CMS Payroll-Based Journal report covering October 1 – December 31, 2025.
Registered Nurse

Manages medical care and health needs.

RN Staff Info All 15 RN Staff are full-time employees. No contractors work on this role. 15
Average shift length Info Average shift length. Calculated as total hours divided by days worked and average staff per day. 9.9 hours
Licensed Practical Nurse

Assists with medical care and medications.

LPN Staff Info All 25 LPN Staff are full-time employees. No contractors work on this role. 25
Average shift length Info Average shift length. Calculated as total hours divided by days worked and average staff per day. 9.5 hours
Certified Nursing Assistant

Helps with daily care and mobility.

CNA Staff Info All 52 CNA Staff are full-time employees. No contractors work on this role. 52
Average shift length Info Average shift length. Calculated as total hours divided by days worked and average staff per day. 7.6 hours

Contractor staffing

Q4 2025 · Oct 1 – Dec 31 More info This data comes from the CMS Payroll-Based Journal report covering October 1 – December 31, 2025.

Total hours from contractors

8.5%

3,053 contractor hours this quarter

Speech Language Pathologist: 9 Physical Therapy Aide: 7 Physical Therapy Assistant: 7 Respiratory Therapy Technician: 7 Qualified Social Worker: 6 Feeding Assistant: 2 Medical Director: 2 Occupational Therapy Assistant: 1

Staff by category

Q4 2025 · Oct 1 – Dec 31 More info This data comes from the CMS Payroll-Based Journal report covering October 1 – December 31, 2025.
Certified Nursing Assistant5205215,77892100%7.6
Licensed Practical Nurse250256,60892100%9.5
Registered Nurse150153,30092100%9.9
RN Director of Nursing9092,6377784%8.1
Other Dietary Services Staff5051,3438997%6.5
Speech Language Pathologist0991,0807784%7.2
Physical Therapy Aide0771,0487784%7.6
Clinical Nurse Specialist5055485560%7.4
Mental Health Service Worker3035286065%7
Nurse Practitioner2025206571%8
Occupational Therapy Aide1014786065%8
Dietitian1014705964%8
Administrator2024535459%7.6
Qualified Social Worker0663715964%6.1
Physical Therapy Assistant0772656571%4.1
Respiratory Therapy Technician0772295863%3.9
Feeding Assistant022391415%2.8
Medical Director022192426%0.8
Nurse Aide in Training1011622%8
Occupational Therapy Assistant011322%1.4
52 Certified Nursing Assistant
% of Days 100%
25 Licensed Practical Nurse
% of Days 100%
15 Registered Nurse
% of Days 100%
9 RN Director of Nursing
% of Days 84%
5 Other Dietary Services Staff
% of Days 97%
9 Speech Language Pathologist
% of Days 84%
7 Physical Therapy Aide
% of Days 84%
5 Clinical Nurse Specialist
% of Days 60%
3 Mental Health Service Worker
% of Days 65%
2 Nurse Practitioner
% of Days 71%
1 Occupational Therapy Aide
% of Days 65%
1 Dietitian
% of Days 64%
2 Administrator
% of Days 59%
6 Qualified Social Worker
% of Days 64%
7 Physical Therapy Assistant
% of Days 71%
7 Respiratory Therapy Technician
% of Days 63%
2 Feeding Assistant
% of Days 15%
2 Medical Director
% of Days 26%
1 Nurse Aide in Training
% of Days 2%
1 Occupational Therapy Assistant
% of Days 2%

Penalties and fines

Federal penalties imposed by CMS for regulatory violations, including civil money penalties (fines) and denials of payment for new Medicare/Medicaid admissions.

Source: CMS Penalties Database

No penalties in the past 3 years

No civil money penalties or payment denials were reported in the last 3 years.

Quality of care over time

These measures show how residents usually do over time at this home, based on health outcomes and preventive care.

High-risk clinical events score Info A composite score based on pressure ulcers, falls with injury, weight loss, walking ability decline, and activities of daily living decline. 8.0
37% worse than State average

State average: 5.8

Functional decline score Info A composite score based on activities of daily living decline, walking ability decline, and incontinence. 16.2
28% worse than State average

State average: 12.7

Long-stay resident measures
Significantly above average State avg: 4.7 Info CMS star rating based on long-stay quality measure performance. 5 stars = significantly above average, 1 star = significantly below average.
Need for Help with Daily Activities Increased Info Percent of long-stay residents whose need for help with daily activities has increased 8.3%
22% worse than State average

State average: 6.8%

Walking Ability Worsened Info Percent of long-stay residents whose ability to move independently worsened 11.2%
26% worse than State average

State average: 8.9%

Low Risk Residents with Bowel/Bladder Incontinence Info Percent of low risk long-stay residents who lose control of their bowels or bladder 29.1%
32% worse than State average

State average: 22.0%

Falls with Major Injury Info Percent of long-stay residents experiencing one or more falls with major injury 9.5%
177% worse than State average

State average: 3.4%

High Risk Residents with Pressure Ulcers Info Percent of long-stay high risk residents with pressure ulcers 5.2%
32% worse than State average

State average: 3.9%

Urinary Tract Infection Info Percent of long-stay residents with a urinary tract infection 0.4%
32% better than State average

State average: 0.5%

Lost Too Much Weight Info Percent of long-stay residents who lose too much weight 5.6%
10% better than State average

State average: 6.2%

Depressive Symptoms Info Percent of long-stay residents who have depressive symptoms 1.2%
95% better than State average

State average: 24.0%

Antipsychotic Use Info Percent of long-stay residents who received an antipsychotic medication 4.1%
51% better than State average

State average: 8.4%

Pneumococcal Vaccine Info Percent of long-stay residents assessed and appropriately given the pneumococcal vaccine 90.5%
In line with State average

State average: 92.4%

Influenza Vaccine Info Percent of long-stay residents assessed and appropriately given the seasonal influenza vaccine 90.4%
In line with State average

State average: 94.5%

Short-stay resident measures
Significantly below average State avg: 2.4 Info CMS star rating based on short-stay quality measure performance. 5 stars = much above average, 1 star = much below average.
Pneumococcal Vaccine Info Percent of short-stay residents assessed and appropriately given the pneumococcal vaccine 69.4%
11% worse than State average

State average: 78.0%

Antipsychotic medication increase Info Percent of short-stay residents who newly received an antipsychotic medication 2.8%
122% worse than State average

State average: 1.3%

Influenza Vaccine Info Percent of short-stay residents assessed and appropriately given the seasonal influenza vaccine 75.8%
In line with State average

State average: 75.6%

Re-hospitalized after SNF stay Info Percentage of short-stay residents who were re-hospitalized after their nursing home admission. 33.7%
34% worse than State average

State average: 25.1%

Emergency department visits Info Percentage of short-stay residents who had an outpatient emergency department visit. 24.9%
99% worse than State average

State average: 12.5%

Falls with major injury Info Percentage of SNF residents who experience falls with major injury during their stay. 1.0%
32% worse than State average

State average: 0.8%

Ability to care for self at discharge Info Percentage of residents at or above expected ability to care for themselves at discharge. 51.6%
In line with State average

State average: 53.7%

Successful return to home or community Info Rate of successful return to home or community from a skilled nursing facility. 44.6%
12% worse than State average

State average: 50.6%

Breakdown by payment type

Medicare

19% of new residents, usually for short-term rehab.

Typical stay 24 days

Private pay

59% of new residents, often for short stays.

Typical stay 1 - 2 months

Medicaid

21% of new residents, often for long-term daily care.

Typical stay 4 - 5 months

Facility Characteristics

Source: CMS Long-Term Care Facility Characteristics (Data as of Jan 2026)

Total residents 80
Medicare
4
5% of residents
Medicaid
47
58.8% of residents
Private pay or other
29
36.3% of residents
Programs & Services
Residents Group

Residents meet regularly to discuss policies, care quality, and activities

CCRC

Part of a Continuing Care Retirement Community offering multiple care levels

Active Resident Council

Organized group of residents that meets regularly to discuss facility policies, quality of life, and activities.

Finances and operations

Based on CMS SNF Cost Report for fiscal year ending in 12/2023.

For-profit
Corporation
Net patient revenue Info Net patient revenue — what the home actually collects for resident care, after contractual allowances, bad debt and discounts are subtracted from its gross charges (CMS cost report, Worksheet G-3). It covers resident care only; money the home earns from other sources is shown separately as "Other income."
$9.6M
Net patient income Info Net patient income: net patient revenue minus the home's total operating expenses. A positive figure means it earns more from resident care than it spends to deliver it; a negative figure means the opposite. It excludes non-operating "other income."
$1.0M
For-profit Corporation
Net patient revenue Info Net patient revenue — what the home actually collects for resident care, after contractual allowances, bad debt and discounts are subtracted from its gross charges (CMS cost report, Worksheet G-3). It covers resident care only; money the home earns from other sources is shown separately as "Other income."
$9.6M Rank #89 / 210Revenue — State benchmarkedThis home is ranked 89th out of 210 homes in Ohio. Shows this facility's annual revenue compared to the Ohio average. Higher revenue generally means more resources for staffing and capital — read alongside Payroll %.Rankings are based only on facilities in Ohio that report data for that category. Facilities without available data are excluded from the ranking.Click the rank badge to see the full State ranking.Click here to see the full State ranking.
Net patient income Info Net patient income: net patient revenue minus the home's total operating expenses. A positive figure means it earns more from resident care than it spends to deliver it; a negative figure means the opposite. It excludes non-operating "other income."
$1.0M
Other income Info Money the home earns outside of resident care — such as investments, grants, rentals and other non-operating sources (CMS cost report, Worksheet G-3). It is tracked separately from net patient revenue: it is not part of that figure, and it is not included in net patient income.
$14.9K
Payroll costs Info Staff salaries plus wage-related costs — benefits such as payroll taxes, health insurance and retirement — from the home's own accounting records (CMS cost report, Worksheet A). Contract or agency labor is counted separately, under other operating costs. Rank #150 / 210Payroll — State benchmarkedThis home is ranked 150th out of 210 homes in Ohio. Shows total annual staff payroll benchmarked to the Ohio average. Higher payroll investment relative to peers often signals better staffing and less reliance on cheaper contract labor.Rankings are based only on facilities in Ohio that report data for that category. Facilities without available data are excluded from the ranking.Click the rank badge to see the full State ranking.Click here to see the full State ranking.
$4.3M 44.7% of net patient revenue Info Payroll as a share of revenue: staff salaries and wage-related benefits divided by net patient revenue. A higher figure means more of each revenue dollar goes to staff pay. Rank #201 / 210Payroll % — State benchmarkedThis home is ranked 201st out of 210 homes in Ohio. Shows payroll as a percentage of revenue versus the Ohio average. Well-run Ohio facilities typically land around 54–64% — the top third Statewide. Below 25% may signal understaffing or heavy agency use — read with Staffing ratings.Rankings are based only on facilities in Ohio that report data for that category. Facilities without available data are excluded from the ranking.Click the rank badge to see the full State ranking.Click here to see the full State ranking.
Other operating costs Info Everything it costs to run the home apart from payroll — food, utilities, supplies, maintenance, contract labor and administration. Calculated as total operating expense minus payroll (staff salaries and wage-related benefits).
$4.3M
Total costs Info The home's total operating expense for the year — all the costs of running it, salaries included (CMS cost report, Worksheet G-3).
$8.5M

What does this home offer?

Building type icon
Building type icon

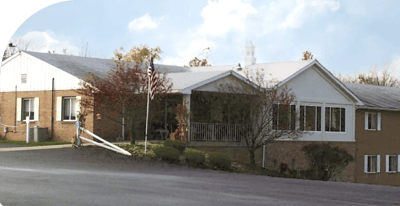
Building Type: Single-story

Who this home usually serves

TYPE OF STAY

Mix of rehab and long-term care

This home supports both short-term rehab and long-term care, with residents staying for a wide range of durations.

Most new residents arrive under private pay (59% of admissions), and a typical private pay stay runs around 1 - 2 months.

Admissions
566 total

Coverage residents most often arrive under.

Medicare 19%
Private pay 59%
Medicaid 21%
Discharges
526 total

Coverage residents most often leave under.

Medicare 14%
Private pay 65%
Medicaid 21%

Places of interest near Windsor House at Champion

Address 4.6 miles from city center Info Estimated distance in miles from Warren's city center to Windsor House at Champion's address, calculated via Google Maps.

Calculate Travel Distance to Windsor House at Champion

Add your location

Address

Compare Nursing Homes around the area

The information below is reported by the Ohio Department of Health, Bureau of Survey and Certification.

Windsor House at Champion
NH
MC
Warren -100 - 28 -
Beachwood Commons by New Perspective
NH
AL
IL
MC
Beachwood -120 A+ 15 Studio / 1 Bed
Brookdale Westlake Village
NH
AL
IL
MC
Westlake -60 A+ 25 1 Bed / 2 Bed
Elizabeth Scott Community
NH
AL
MC
Maumee -60 A+ 0 Studio / 1 Bed
Genoa Retirement Village
NH
AL
IL
MC
Genoa -68 A+ 17 Studio / 1 Bed / 2 Bed

Frequently Asked Questions about Windsor House at Champion

Is Windsor House at Champion in a walkable area?

Windsor House at Champion has a walk score of 28. Somewhat walkable. A few nearby services may be reachable on foot, but most trips require transportation.

What is the occupancy rate at Windsor House at Champion?

Windsor House at Champion's occupancy is 91.2%.

Does Windsor House at Champion operate as a for-profit or non-profit?

Windsor House at Champion is registered as a for-profit.

Are there photos of Windsor House at Champion?

Yes — there are 12 photos of Windsor House at Champion in the photo gallery on this page.

What is the address of Windsor House at Champion?

Windsor House at Champion is located at 200 E Glendola Ave, Warren, OH 44483.

What is the phone number of Windsor House at Champion?

(330) 847-6266 will put you in contact with the team at Windsor House at Champion.

Is Windsor House at Champion Medicare or Medicaid certified?

Yes — Windsor House at Champion is a CMS-certified provider of Medicare and Medicaid.

Guides for Better Senior Living

Care Cost Calculator: See Prices in Your Area

Nursing Home Data Explorer

Don’t Wait Too Long: 7 Red Flag Signs Your Parent Needs Assisted Living Now

The True Cost of Assisted Living in 2025 – And How Families Are Paying For It

Understanding Senior Living Costs: Pricing Models, Discounts & Financial Assistance