Woodbridge Care Center

Nursing Home
Overview of Woodbridge Care Center

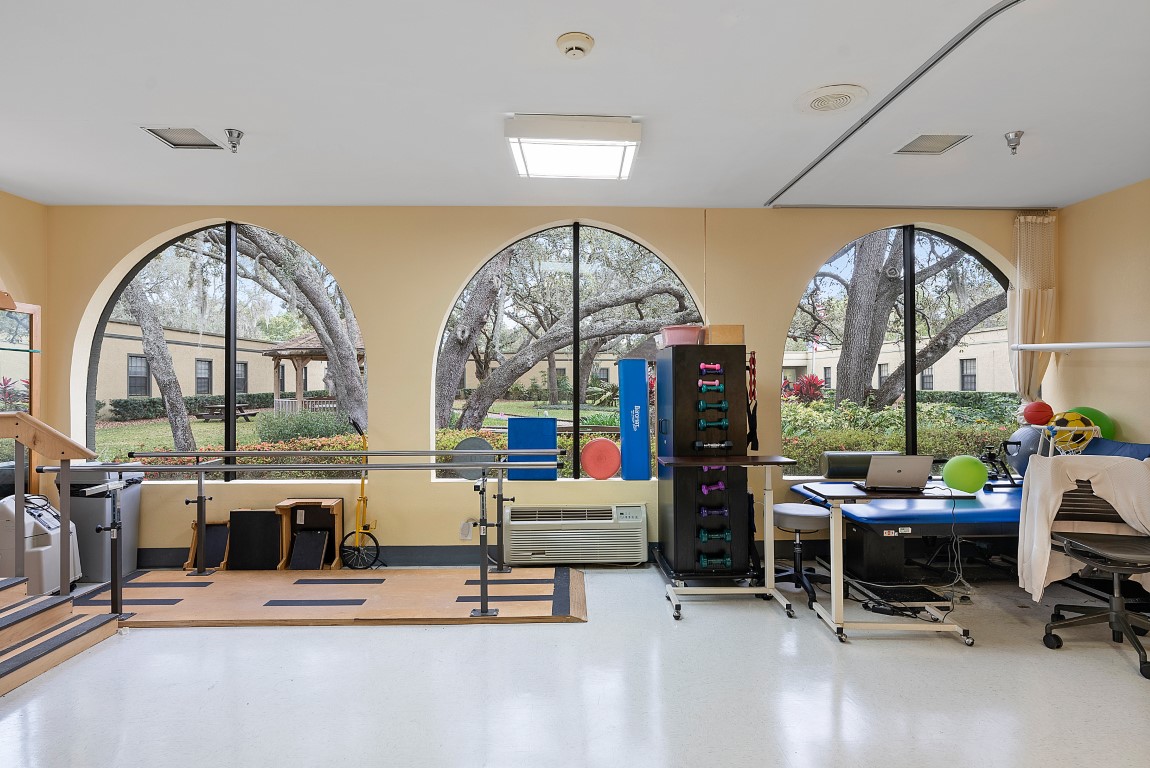
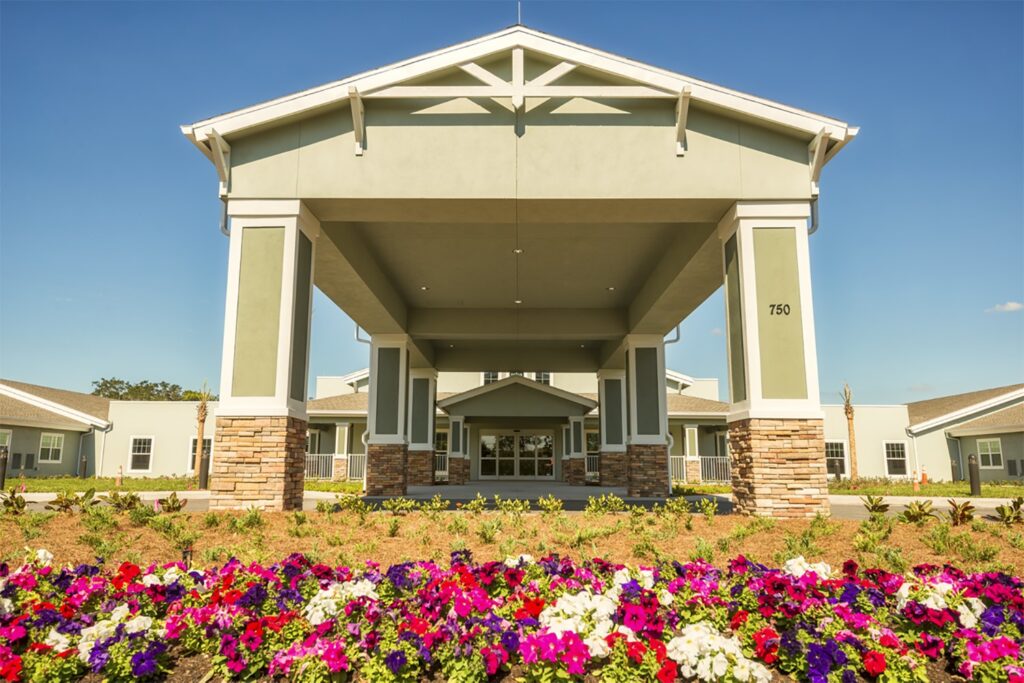
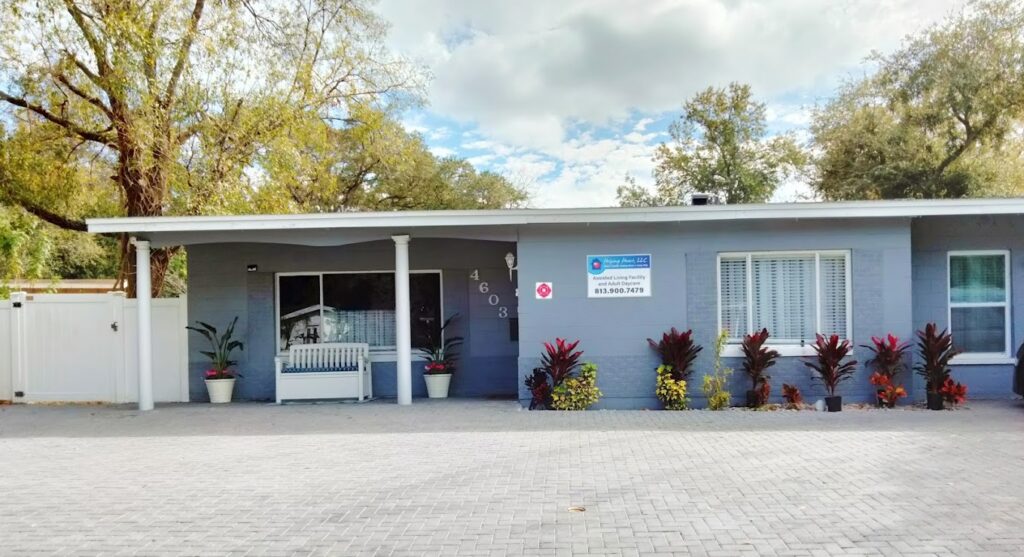
Experience personalized care and support with a personal touch in Woodbridge Care Center, an excellent and vibrant community in Tampa, FL, offering top-notch rehabilitative services. They provide residents with comprehensive care services, including medication management, telehealth consultations, and various therapies tailored to improve their well-being and potential. With 24/7 skilled nursing care from a kind and compassionate team of care experts, residents can enjoy their peace of mind and focus on getting better or improving their skills and abilities.

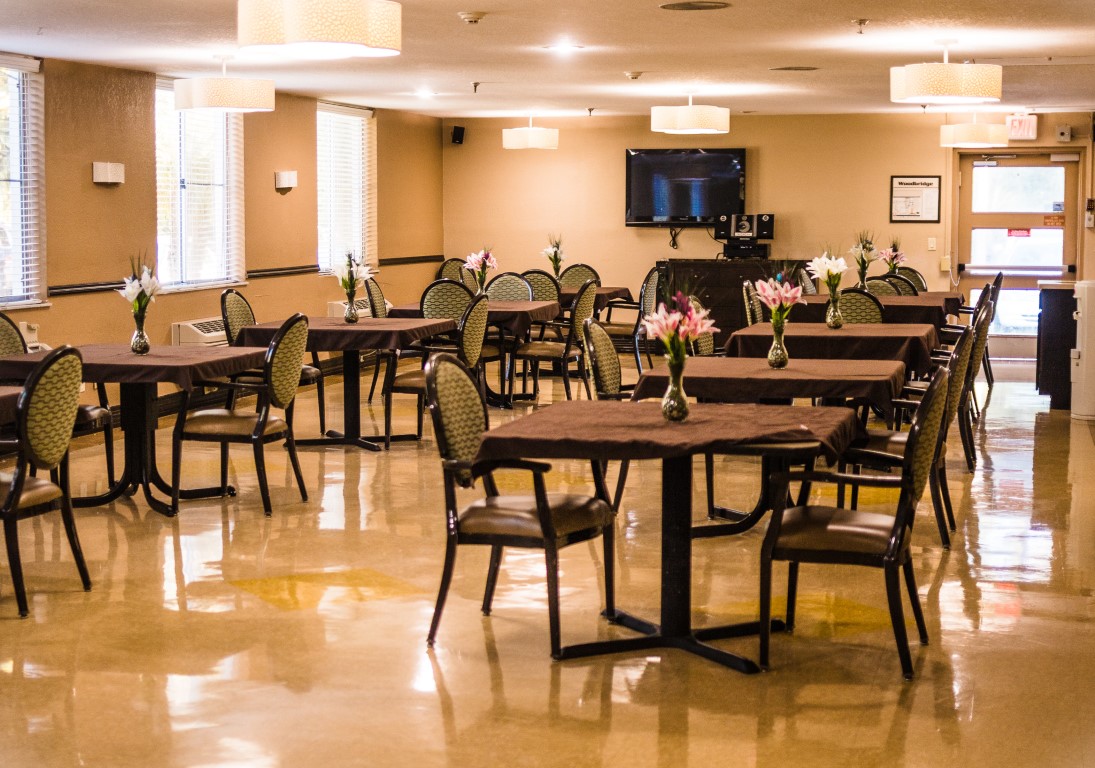
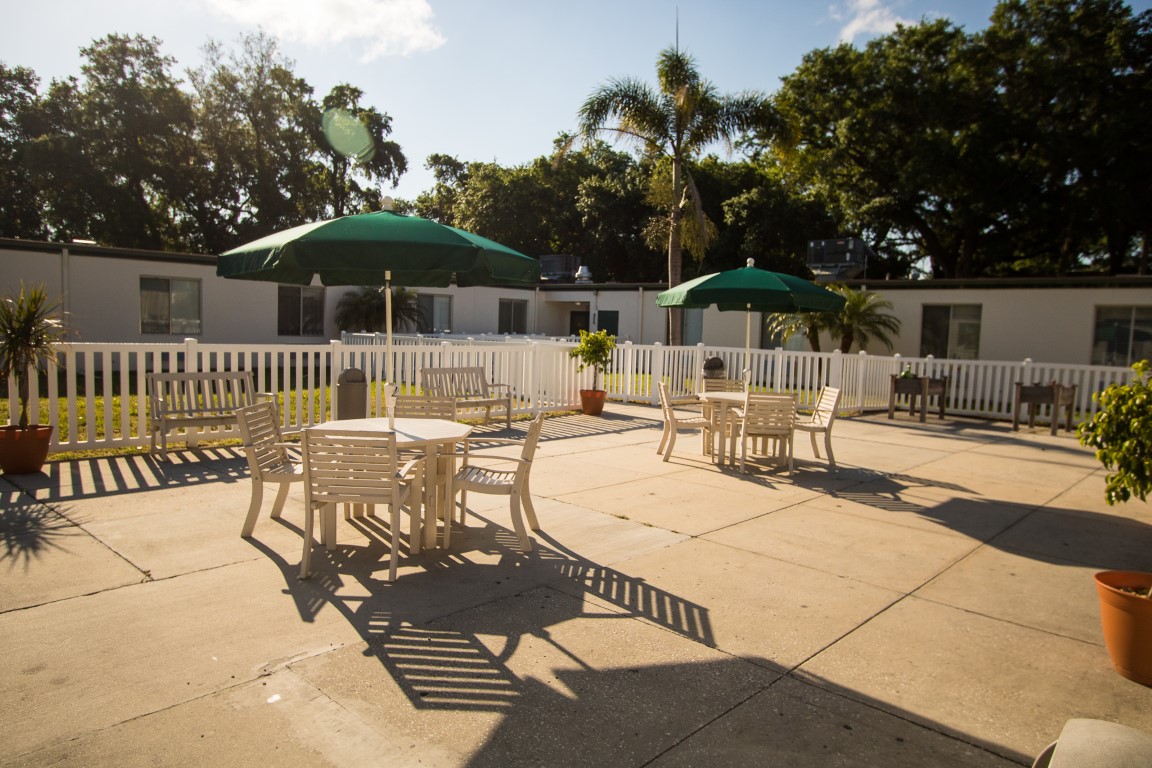
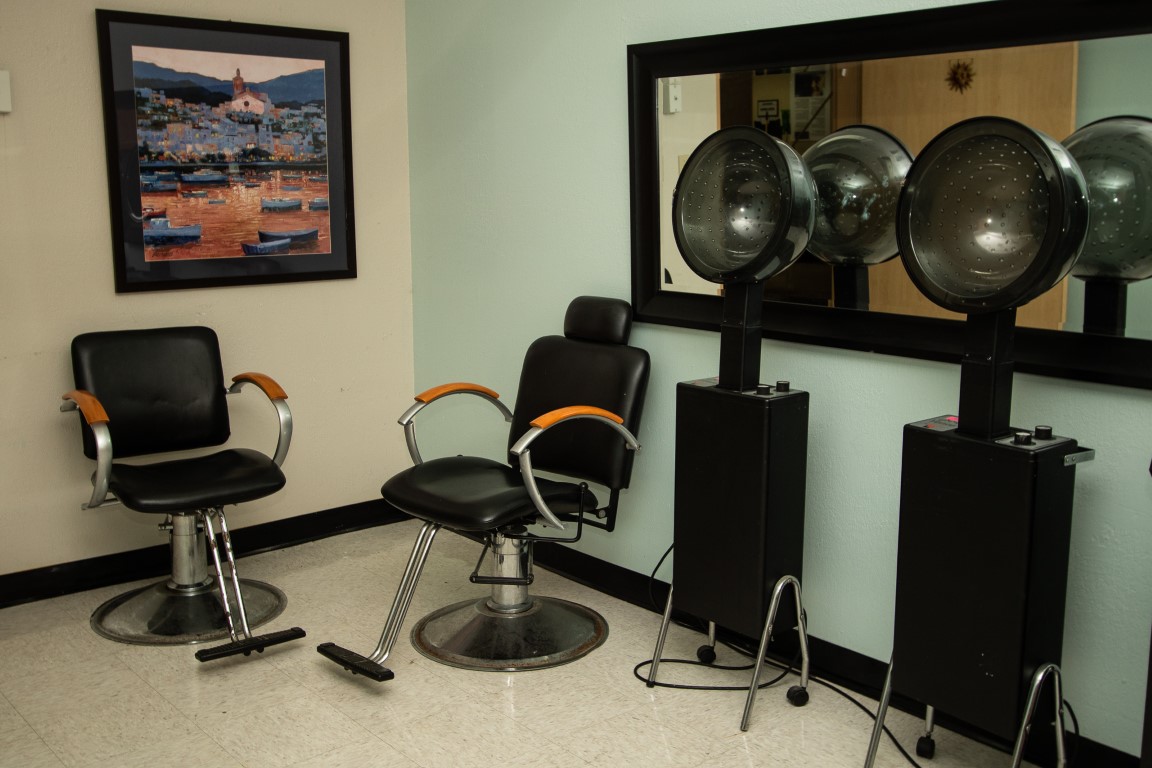
To ensure a safe and secure healing environment for its residents, it maintains the highest cleanliness standard and provides first-rate amenities tailored to their convenience. There are countless activities to keep residents active and engaged and dietician-supervised meal plans to keep residents healthy and well-nourished. From excellent care services to compassionate care professionals and live entertainment, Woodbridge Care Center provides more than the physical aspects of care and gives its residents plenty of opportunities to have fun and live life fully.

(813) 549-6700

Managed by Carlos Moreno

Administrator

Carlos Moreno is the Administrator at Woodbridge Care Center. He holds a bachelor's degree in healthcare management and specializes in medical records, business operations, and human resources. Carlos is dedicated to making a meaningful difference in the lives of elderly residents and their families, focusing on enhancing their experience through compassionate leadership and effective problem-solving.

Quality ratings

Measured by Centers for Medicare & Medicaid Services (CMS)

Overall rating Info Official CMS rating based on health inspections, staffing and quality measures.
3/5
Florida average: 3.2/5
Health Inspection Info Official CMS rating based on deficiencies found during state health inspections.
2/5
Florida average: 2.8/5
Staffing Info Official CMS rating based on nurse staffing hours per resident per day.
4/5
Florida average: 3.4/5
Quality Measures Info Official CMS rating based on clinical outcomes for residents.
5/5
Florida average: 4.1/5

Nursing care per resident

Info Average daily nursing hours per resident (adjusted for acuity). Higher values indicate more nursing time per resident.
3h 22m per day

This home provides 17% less nursing time per resident than the state average.

Florida average: 4h 2m per day

Staffing hours breakdown

Info Hours of care per resident per day, broken down by staff type. Data from CMS Medicare.
Staff type Facility State avg National avg
Registered Nurse (RN) Info Registered nurse hours per resident per day. 1h 3m per day 44m per day 41m per day
LPN / LVN Info Licensed Practical Nurse / Licensed Vocational Nurse hours per resident per day. 12m per day 47m per day 52m per day
Nurse Aide Info Nurse aide hours per resident per day. 2h 19m per day 2h 20m per day 2h 21m per day
Total Nursing (Weekend) Info Total number of nurse staff hours per resident per day on weekends. 3h 17m per day 3h 31m per day 3h 26m per day
Physical Therapist Info Physical therapist staff hours per resident per day. 9m per day 5m per day 4m per day
RN (Weekend) Info Registered nurse hours per resident per day on weekends. 50m per day 32m per day 29m per day

Capacity and availability

Medium-capacity home

Offers a balance of services and community atmosphere.

Total beds 120

This home is often near full

That suggests steady demand, but availability may be limited.

Higher demand than most homes in Florida
Occupancy rate 100.8%
Residents per day (avg) 112
Occupancy rate
100.8%
Residents per day (avg)
112

Who this home usually serves

TYPE OF STAY

Mix of rehab and long-term care

This home supports both short-term rehab and long-term care, with residents staying for a wide range of durations.

Breakdown by payment type

Medicare

37% of new residents, usually for short-term rehab.

Typical stay 2 - 3 months

Private pay

57% of new residents, often for short stays.

Typical stay 1 months

Medicaid

6% of new residents, often for long-term daily care.

Typical stay 2 years

Finances and operations

Proprietary home
Other
Home revenue
$11.9M
Profit
$845.6K
Proprietary home Other
Home revenue
$11,864,903.00
Profit
$845,603.00
Payroll costs Info The portion of the home's budget spent on staff, including nurses, caregivers, and other employees who support care and operations.
$2.5M
21.1% of revenue
Other operating costs Info All remaining costs needed to run the home, such as food, utilities, building maintenance, supplies and administrative expenses.
$8.5M
Total costs $11.0M

What does this home offer?

Housing options icon

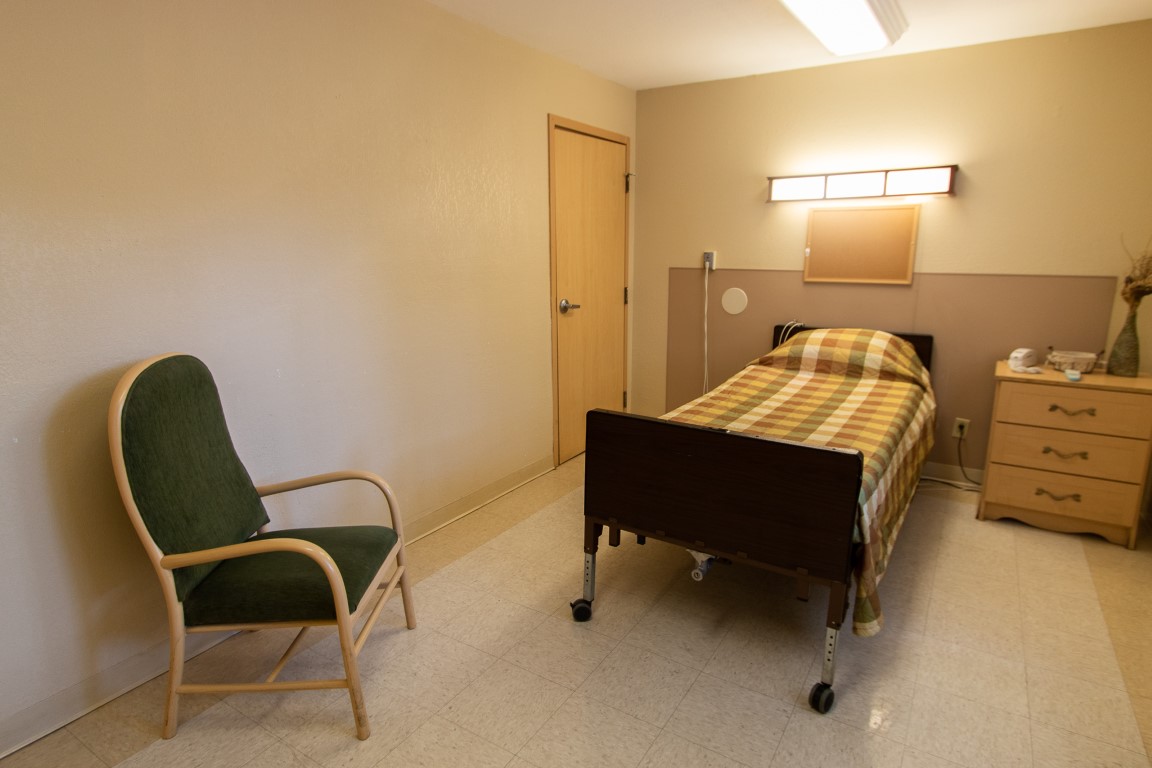
Housing Options: Private / Semi-Private Rooms

Building type icon
Building type icon

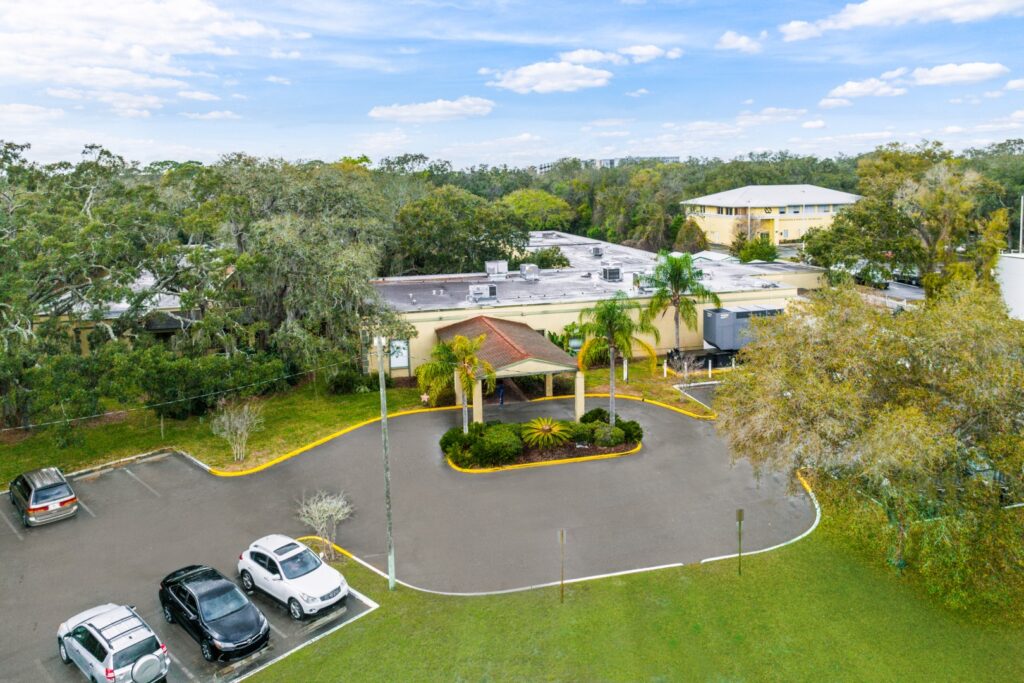
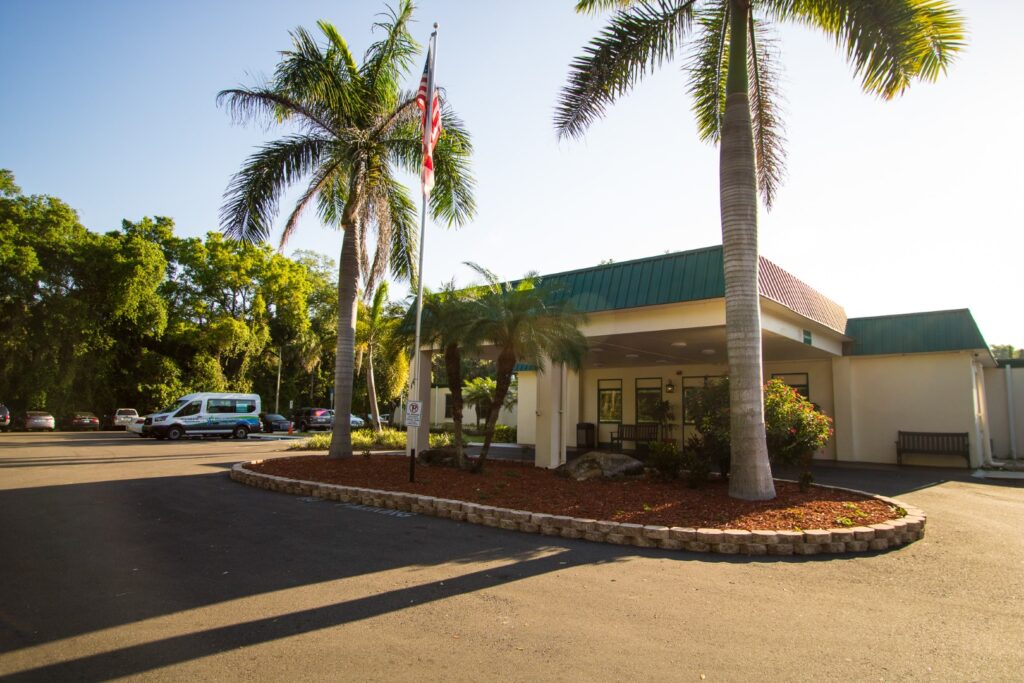
Building Type: Single-story

Dining services icon

Dining Services

Housekeeping icon
Housekeeping icon

Housekeeping Services

Recreational activities icon

Recreational Activities

Exercise program icon

Exercise Programs

Health Programs icon

Health Programs

Types of Care at Woodbridge Care Center

Nursing Home
Contact Woodbridge Care Center

Compare Nursing Homes around Hillsborough County

The information below is reported by the Florida Agency for Health Care Administration (AHCA).
Tampa Lakes Health And Rehabilitation Center
SNF

Nursing Homes 24/7 care needed

Lutz
179
No
A+
19
-
92.1%
$29,249,273.00
$9,753,866.00
33.3%
173.40
4/5
3.4983
3/5
3/5
5/5
-
16
-
-15%
-13%
+9%
Private / Semi-Private Rooms
Fairway Oaks Center
SNF

Nursing Homes 24/7 care needed

Tampa
120
No
C+
32
DEBRUNNER, DAWN
93.5%
$13,326,523.00
$5,713,804.00
42.9%
108.00
3/5
3.2848
3/5
2/5
3/5
-
26
-
-40%
-19%
+11%
Semi-Private Rooms
Woodbridge Care Center
SNF

Nursing Homes 24/7 care needed

Tampa (Town N County Park)
120
No
-
72
WOODBRIDGE NURSING HOLDCO LLC
100.8%
$11,864,890.00
$2,508,266.00
21.1%
112.30
3/5
3.3666
2/5
4/5
5/5
2
21
-
+38%
-17%
+20%
Private / Semi-Private Rooms
The Bristol at Tampa Rehabilitation & Nursing Center
SNF

Nursing Homes 24/7 care needed

Tampa (Cross Fletcher)
266
No
A+
75
BRISTOL HOLDCO LLC
88.0%
$24,424,708.00
$11,477,096.00
47%
228.80
-
3.9092
-
-
-
7
54
6
+13%
-3%
+4%
Private / Semi-Private Rooms
Helping Hearts LLC
AL

Assisted Living For seniors needing help with daily tasks but not full-time nursing.

IL

Independent Living For self-sufficient seniors seeking community and minimal assistance.

MC

Memory Care Specialized care for those with Memory Loss, Alzheimer's, or dementia, ensuring safety and support.

SNF

Nursing Homes 24/7 care needed

Tampa (Del Rio)
6 Residents
No
-
24
-
-
-
-
-
-
-
-
-
-
-
-
-
-
-
-
-
Private / Semi-Private Rooms

Places of interest near Woodbridge Care Center

Address 10.7 miles from city center

Address 8720 Jackson Springs Rd, Tampa, FL 33615

Calculate Travel Distance to Woodbridge Care Center

Add your location

Address

Staffing Data

Source: CMS Payroll-Based Journal (Q2 2025)

152
Total Staff
134
Employees
18
Contractors
44,631
Total Hours (Quarter)
65
Avg Staff/Day
7.5
Avg Shift (hrs)
Nursing Staff Breakdown
Role Count Avg Shift (hrs) Uses Contractors?
Registered Nurse257.9 No
Licensed Practical Nurse77.4 No
Certified Nursing Assistant637.9 No
Staff by Category
Administration
1 staff
8hs shift avg
Nursing Staff
112 staff
7.6hs shift avg
Physicians & Practitioners
9 staff
8.5hs shift avg
Therapy Services
22 staff
6.9hs shift avg
Activities & Recreation
0 staff
0hs shift avg
Social Services
3 staff
7.6hs shift avg
Dietary Services
2 staff
8.1hs shift avg
Other Services
3 staff
7.3hs shift avg
Contractor Analysis
0.4%
of total hours from contractors
179 contractor hours this quarter
Feeding Assistant: 15 Physician Assistant: 1 Diagnostic X-ray Services Staff: 1 Other Physician: 1
Role Employees Contractors Total Staff Total Hours Days Worked % of Days Avg Shift (hrs)
Certified Nursing Assistant6306322,85891100%7.9
Registered Nurse250257,52091100%7.9
Clinical Nurse Specialist5052,22691100%8.7
Licensed Practical Nurse7071,69891100%7.4
Respiratory Therapy Technician6061,5877684%7.1
Physical Therapy Aide7071,5587886%6.6
Speech Language Pathologist5051,5207077%6.9
Dietitian2021,0058088%8.1
Qualified Social Worker3039576673%7.6
RN Director of Nursing2029008189%6.9
Physical Therapy Assistant4047406369%7.6
Administrator1014966268%8
Mental Health Service Worker1014886167%8
Nurse Practitioner2024525763%7.9
Dental Services Staff1014465965%7.6
Feeding Assistant015151395257%1
Diagnostic X-ray Services Staff011331213%2.8
Other Physician011622%3
Physician Assistant011111%1.3

Health Inspection History

Inspections
Total health inspections 3

Florida average 4.3


Last Health inspection on Aug 2025

Total health citations 21
Citations per inspection
7

Health citations are formal notices following inspections when they fail to comply with safety and care standards.

All 21 citations resulted from standard inspections.

Breakdown of citation severity (last 3 years)
Critical Health citations More info 0
100% better than Florida average

Florida average: 0.8


Serious Health citations More info 0
100% better than Florida average

Florida average: 0.4

0 critical citations More info Florida average: 0.8

0 serious citations More info Florida average: 0.4

21 moderate citations More info Florida average: 18.4

0 minor citations More info Florida average: 0.2
Citations history (last 3 years)
Nursing Services moderate citation Aug 06, 2025
Corrected

Nutrition moderate citation Aug 06, 2025
Corrected

Pharmacy moderate citation Aug 06, 2025
Corrected

Pharmacy moderate citation Aug 06, 2025
Corrected

Facility Characteristics

Source: CMS Long-Term Care Facility Characteristics (Data as of Jan 2026)

Ownership: For-Profit Individual
Resident Census by Payment Source
115 Total Residents
Medicare 29 (25.2%)
Medicaid 74 (64.3%)
Private Pay/Other 12 (10.4%)
Programs & Services
Residents' Group
Family Engagement

Active councils help families stay involved in care decisions and facility operations.

Quality of care over time

These measures show how residents usually do over time at this home, based on health outcomes and preventive care.

High-risk clinical events score Info A composite score based on pressure ulcers, falls with injury, weight loss, walking ability decline, and activities of daily living decline. 6.1
18% better than Florida average

Florida average: 7.4

Functional decline score Info A composite score based on activities of daily living decline, walking ability decline, and incontinence. 4.1
67% better than Florida average

Florida average: 12.4

Long-stay resident measures
Need for Help with Daily Activities Increased Info Percent of long-stay residents whose need for help with daily activities has increased 3.5%
67% better than Florida average

Florida average: 10.5%

Walking Ability Worsened Info Percent of long-stay residents whose ability to move independently worsened 7.7%
40% better than Florida average

Florida average: 12.9%

Low Risk Residents with Bowel/Bladder Incontinence Info Percent of low risk long-stay residents who lose control of their bowels or bladder 1.0%
93% better than Florida average

Florida average: 13.5%

Falls with Major Injury Info Percent of long-stay residents experiencing one or more falls with major injury 2.5%
5% better than Florida average

Florida average: 2.6%

High Risk Residents with Pressure Ulcers Info Percent of long-stay high risk residents with pressure ulcers 7.6%
42% worse than Florida average

Florida average: 5.4%

Urinary Tract Infection Info Percent of long-stay residents with a urinary tract infection 0.3%
67% better than Florida average

Florida average: 0.9%

Lost Too Much Weight Info Percent of long-stay residents who lose too much weight 8.9%
48% worse than Florida average

Florida average: 6.0%

Depressive Symptoms Info Percent of long-stay residents who have depressive symptoms 2.2%
35% better than Florida average

Florida average: 3.3%

Antipsychotic Use Info Percent of long-stay residents who received an antipsychotic medication 1.4%
82% better than Florida average

Florida average: 8.0%

Pneumococcal Vaccine Info Percent of long-stay residents assessed and appropriately given the pneumococcal vaccine 99.7%
In line with Florida average

Florida average: 97.7%

Influenza Vaccine Info Percent of long-stay residents assessed and appropriately given the seasonal influenza vaccine 100.0%
In line with Florida average

Florida average: 99.2%

Hospitalizations per 1,000 days Info Number of hospitalizations per 1,000 long-stay resident days. 2.00
5% better than Florida average

Florida average: 2.10

ED visits per 1,000 days Info Number of outpatient emergency department visits per 1,000 long-stay resident days. 0.62
47% better than Florida average

Florida average: 1.18

Short-stay resident measures
Pneumococcal Vaccine Info Percent of short-stay residents assessed and appropriately given the pneumococcal vaccine 93.1%
In line with Florida average

Florida average: 94.0%

Antipsychotic medication increase Info Percent of short-stay residents who newly received an antipsychotic medication 0.3%
80% better than Florida average

Florida average: 1.5%

Influenza Vaccine Info Percent of short-stay residents assessed and appropriately given the seasonal influenza vaccine 99.2%
5% better than Florida average

Florida average: 94.7%

Re-hospitalized after SNF stay Info Percentage of short-stay residents who were re-hospitalized after their nursing home admission. 29.9%
14% worse than Florida average

Florida average: 26.2%

Emergency department visits Info Percentage of short-stay residents who had an outpatient emergency department visit. 4.9%
47% better than Florida average

Florida average: 9.3%

Falls with major injury Info Percentage of SNF residents who experience falls with major injury during their stay. 0.0%
100% better than Florida average

Florida average: 0.8%

Ability to care for self at discharge Info Percentage of residents at or above expected ability to care for themselves at discharge. 40.5%
25% worse than Florida average

Florida average: 53.7%

Successful return to home or community Info Rate of successful return to home or community from a skilled nursing facility. 48.0%
5% worse than Florida average

Florida average: 50.6%

Penalties and fines

Federal penalties imposed by CMS for regulatory violations, including civil money penalties (fines) and denials of payment for new Medicare/Medicaid admissions.

Source: CMS Penalties Database (Data as of Jan 2026)

Total fines amount $5K
93% lower than Florida average

Florida average: $72K

Number of fines 2
24% fewer fines than Florida average

Florida average: 2.6

Payment Denials Info Serious action where Medicare and/or Medicaid temporarily stops payments for new residents until issues are fixed. 0
100% fewer payment denials than Florida average

Florida average: 0.1

Fines amount comparison
This facility $5K
Florida average $72K
Penalty History

Penalties are imposed by CMS for violations of federal nursing home regulations.

Civil Money Penalty Info Fines imposed for noncompliance, which can be assessed per day or per instance of violation. Oct 2, 2023
$2K
Civil Money Penalty Info Fines imposed for noncompliance, which can be assessed per day or per instance of violation. Sep 11, 2023
$3K

Last updated: Jan 2026

Guides for Better Senior Living

Care Cost Calculator: See Prices in Your Area

Nursing Home Data Explorer

Don’t Wait Too Long: 7 Red Flag Signs Your Parent Needs Assisted Living Now

The True Cost of Assisted Living in 2025 – And How Families Are Paying For It

Understanding Senior Living Costs: Pricing Models, Discounts & Financial Assistance

Financial Aid for Florida Seniors

Get financial aid guidance

Long-Term Care Waiver

Florida Medicaid LTC Waiver

Age 65+ or 21+ disabled, Florida resident, Medicaid- eligible, nursing home-level care need.

~$2,829/month (300% FBR, individual).

$2,000 (individual), $3,000 (couple).

High demand; waitlists common.

Community Care for the Elderly (CCE)

Florida CCE

Age 60+, Florida resident, at risk of nursing home.

~$2,000/month (varies).

$5,000 (individual).

Limited funding; regional variation.

Home Care for the Elderly (HCE)

Florida Home Care for the Elderly

Age 60+, Florida resident, at risk of nursing home placement; caregiver must be approved.

~$2,829/month (individual, aligned with Medicaid thresholds).

~$2,000 (individual); varies by case manager discretion.

Limited funding (~3,500 served annually); prioritizes low-income frail seniors.

Program of All-Inclusive Care for the Elderly (PACE)

Florida Medicaid PACE

Age 55+, Florida resident, nursing home-level care need, safe with PACE support.

~$2,829/month (300% FBR).

$2,000 (individual), $3,000 (couple).

Limited to specific counties (e.g., Hillsborough, Miami-Dade); ~10 sites statewide.

Optional State Supplementation (OSS)

Florida Optional State Supplementation

Age 65+ or disabled, Florida resident, living in approved facility, receiving SSI or low-income.

~$1,004/month (individual, including SSI).

$2,000 (individual), $3,000 (couple).

Limited to specific facility types; ~$78.40/month max supplement.

Senior Community Service Employment Program (SCSEP)

Florida SCSEP (federally funded, state-administered)

Age 55+, unemployed, low-income, Florida resident.

~$1,983/month (125% FPL, individual).

Not specified; income-focused.

Priority for veterans, rural residents; ~1,000 slots/year.

Who we are

Your Senior Care Partner, Every Step of the Way

We help families find affordable senior communities and unlock same day discounts, Medicaid, and Medicare options tailored to your needs.

Contact us Today
Tour Icon
Planning a tour? Check our touring checklist.
Chat Icon
Thinking of living here? We can help you speak to a current resident