Nursing Home

Wurzbach Nursing and Rehabilitation

Nursing Home

Wurzbach Nursing and Rehabilitation

8300 Wurzbach Rd, San Antonio, TX 78229 View map
Overview of Wurzbach Nursing and Rehabilitation

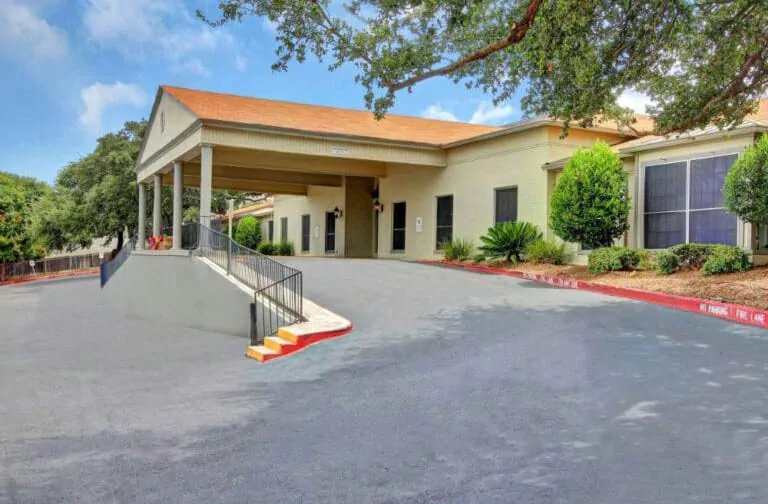
Wurzbach Nursing and Rehab is a highly skilled nursing home in San Antonio that boasts a secure and safe environment that enhances the quality of life for each of its residents.  The nursing home promotes a list of comprehensive programs and engaging activities– designed for residents to cultivate their emotional, mental, and physical aspects. Residents at Wurzbach Nursing and Rehab are guaranteed to get personalized care that is catered to their needs in an inviting community with fine hospitality.
A Careday Healthcare community, Wurzbach is ensured to be a relaxing and convenient nursing home. Their skilled care services focus on individualized treatments– physical, occupational, and speech therapy; joint replacement therapy, spine and back therapy; wound care, dysphagia management, and palliative care. They have an in-house respiratory therapist, extensive clinical service, 24-hour medical and nursing services, and continual tracheostomy care.

(210) 617-2200

Quality ratings

Measured by Centers for Medicare & Medicaid Services (CMS)

Overall rating Info Official CMS rating based on health inspections, staffing and quality measures.
1/5
Texas average: 3.0/5
Health Inspection Info Official CMS rating based on deficiencies found during state health inspections.
2/5
Texas average: 2.9/5
Staffing Info Official CMS rating based on nurse staffing hours per resident per day.
1/5
Texas average: 2.4/5
Quality Measures Info Official CMS rating based on clinical outcomes for residents.
2/5
Texas average: 4.0/5

Nursing care per resident

Info Average daily nursing hours per resident (adjusted for acuity). Higher values indicate more nursing time per resident.
3h 14m per day

This home provides 14% less nursing time per resident than the Texas average.

Texas average: 3h 46m per day

Staffing hours breakdown

Info Hours of care per resident per day, broken down by staff type. Data from CMS Medicare.
Staff type Facility State avg National avg
Registered Nurse (RN) Info Registered nurse hours per resident per day. 22m per day 21m per day 29m per day

Capacity and availability

Medium-capacity home

Offers a balance of services and community atmosphere.

Total beds 140

This home usually has availability

Lower occupancy suggests more openings may be available.

Lower demand than the Texas average
Occupancy rate 62%
Residents per day (avg) 86
Occupancy rate
62%
Residents per day (avg)
86

Who this home usually serves

TYPE OF STAY

Mostly long-term care residents

Most residents stay for extended periods and receive ongoing daily care.

Might be optimal for
Long-term daily care Ongoing support needs

Breakdown by payment type

Medicare

18% of new residents, usually for short-term rehab.

Typical stay 1 - 2 months

Private pay

52% of new residents, often for short stays.

Typical stay 5 - 6 months

Medicaid

31% of new residents, often for long-term daily care.

Typical stay 1 - 2 years

Finances and operations

Privately-owned community
Home revenue
$8.3M
Profit
$166.9K
Privately-owned community
Home revenue
$8,335,048.00
Profit
$166,886.00
Payroll costs Info The portion of the home's budget spent on staff, including nurses, caregivers, and other employees who support care and operations.
$3.3M
39.4% of revenue
Other operating costs Info All remaining costs needed to run the home, such as food, utilities, building maintenance, supplies and administrative expenses.
$4.9M
Total costs $8.2M
Bed community size
140-bed community
A larger shared setting that may offer more common spaces and organized community services.
Years in operation
43 years in operation
A longer operating history, which may indicate experience navigating regulations and delivering ongoing care.
Walk Score
Walk Score: 75 / 100
Very walkable. Most errands can be accomplished on foot, and many essentials are within a short walk.
BBB Rating
BBB Rating: C (Not Accredited)
An independent rating from the Better Business Bureau based on factors such as complaint history, transparency, and business practices.
How BBB ratings work

Services

Medicare/medicaid

About this community

Occupancy

Occupancy rate
62%
In line with Texas average
Occupied beds
87 / 140
Average residents 75 per day

License details

Facility type
Nursing
Status Active
Issuance January 1, 2024
Expiration January 1, 2027
County: BEXAR

Additional licensing details

License number: 307662
Year opened: 8/1/1982
CMS Certification Number: 455824

Ownership & operating entity

Wurzbach Nursing and Rehabilitation is administrated by JOSE RUIZ.

Management company: CARADAY MANAGEMENT LLC
Owner: CARADAY WURZBACH LLC
Ownership type: Limited Liability Company (LLC)

Type Of Units

Medicare
10 units
Medicaid and Medicare
130 units
Total beds
140 units

Staffing

Key information about the people who lead and staff this community.

Leadership

Contact: Customer Contact, Customer Contact
Administrator email: [email protected]
Contact Wurzbach Nursing and Rehabilitation

Health Inspection History

Inspections
Total health inspections 13

Texas average 7.4


Last Health inspection on Jun 2025

Total health citations 57
Citations per inspection
4.38

Health citations are formal notices following inspections when they fail to comply with safety and care standards.

35 of 57 citations resulted from standard inspections; 18 of 57 resulted from complaint investigations; and 4 of 57 came from combined inspections (standard and complaint).

Breakdown of citation severity (last 3 years)
Critical Health citations More info 3
50% worse than Texas average

Texas average: 2


Serious Health citations More info 1
150% worse than Texas average

Texas average: 0.4

3 critical citations More info Texas average: 2

1 serious citation More info Texas average: 0.4

53 moderate citations More info Texas average: 23

0 minor citations More info Texas average: 0.4
Citations history (last 3 years)
Abuse/Neglect moderate citation Jun 13, 2025
Corrected

Administration moderate citation Jun 13, 2025
Corrected

Administration moderate citation Jun 13, 2025
Corrected

Administration moderate citation Jun 13, 2025
Corrected

Compare Nursing Homes around San Antonio

The information below is reported by the Texas Health and Human Services Commission.
Legend Oaks West Rehab
SNF

Nursing Home 24/7 care needed

AL

Assisted Living For seniors needing help with daily tasks but not full-time nursing.

San Antonio (Far West Side)
124
-
24
BERTETTI HEALTHCARE, INC.
85.1%
$14,660,285.00
$6,880,084.00
46.9%
109.50
5/5
3.8564
4/5
4/5
5/5
1
11
1
+9%
+6%
+34%
Lakeside Nursing and Rehabilitation Center
SNF

Nursing Home 24/7 care needed

AL

Assisted Living For seniors needing help with daily tasks but not full-time nursing.

San Antonio (Far West Side)
118
-
19
CRYSTAL LAKE HEALTHCARE, INC.
84.5%
$14,956,233.00
$6,190,471.00
41.4%
112.30
4/5
3.4176
4/5
2/5
4/5
1
24
3
-3%
-6%
+33%
Juniper Village at Lincoln Heights
SNF

Nursing Home 24/7 care needed

AL

Assisted Living For seniors needing help with daily tasks but not full-time nursing.

TX 78209
143
-
-
WEISER, TIFFANY
58.8%
$9,001,708.00
$3,781,873.00
42%
27
4/5
4.7792
3/5
5/5
4/5
1
18
1
+32%
+32%
-7%
Blue Skies of Texas East
SNF

Nursing Home 24/7 care needed

AL

Assisted Living For seniors needing help with daily tasks but not full-time nursing.

San Antonio (Valley High North)
80
-
47
AIR FORCE VILLAGE INC
68.3%
$15,242,760.00
$4,568,530.00
30%
45.70
3/5
6.5100
3/5
4/5
4/5
2
31
2
+1%
+79%
+8%
Wurzbach Nursing and Rehabilitation
SNF

Nursing Home 24/7 care needed

AL

Assisted Living For seniors needing help with daily tasks but not full-time nursing.

San Antonio (Northwest Side)
140
C
75
E&R CUNNINGHAM INVESTMENTS LP
62.0%
$7,812,099.00
$3,283,072.00
42%
86
1/5
3.2252
2/5
1/5
2/5
4
57
4
-67%
-11%
-2%

Places of interest near Wurzbach Nursing and Rehabilitation

Address 8.0 miles from city center — 0.43 miles to nearest hospital (St. Luke's Baptist Hospital)

Address 8300 Wurzbach Rd, San Antonio, TX 78229

Calculate Travel Distance to Wurzbach Nursing and Rehabilitation

Add your location

Address

Staffing Data

Source: CMS Payroll-Based Journal (Q2 2025)

203
Total Staff
64
Employees
139
Contractors
28,242
Total Hours (Quarter)
39
Avg Staff/Day
8
Avg Shift (hrs)
Nursing Staff Breakdown
Role Count Avg Shift (hrs) Uses Contractors?
Registered Nurse510.4 No
Licensed Practical Nurse618 Yes
Certified Nursing Assistant1037.5 Yes
Staff by Category
Administration
3 staff
7.6hs shift avg
Nursing Staff
184 staff
7.9hs shift avg
Physicians & Practitioners
4 staff
7.7hs shift avg
Therapy Services
10 staff
7.9hs shift avg
Activities & Recreation
0 staff
0hs shift avg
Social Services
0 staff
0hs shift avg
Dietary Services
2 staff
8hs shift avg
Other Services
0 staff
0hs shift avg
Contractor Analysis
30.8%
of total hours from contractors
8,706 contractor hours this quarter
Licensed Practical Nurse: 48 Certified Nursing Assistant: 77 Medication Aide/Technician: 12 Medical Director: 2
Role Employees Contractors Total Staff Total Hours Days Worked % of Days Avg Shift (hrs)
Certified Nursing Assistant267710310,82691100%7.5
Licensed Practical Nurse1348616,50291100%8
Physical Therapist100104,61291100%7.9
Medication Aide/Technician112132,0848593%9.6
Clinical Nurse Specialist3031,0218897%7.6
RN Director of Nursing2029677481%7.6
Registered Nurse5057075763%10.4
Administrator1015206571%8
Other Dietary Services Staff1015025965%8.5
Dietitian1014716268%7.6
Medical Director0221867%3
Nurse Practitioner1011511%15

Facility Characteristics

Source: CMS Long-Term Care Facility Characteristics (Data as of Jan 2026)

Total census
140 residents
Residents by payment source
Medicare
8 residents (5.7%)
Medicaid
132 residents (94.3%)
Programs & Services
Residents' Group

Residents meet regularly to discuss policies, care quality, and activities

Active Resident Council

Organized group of residents that meets regularly to discuss facility policies, quality of life, and activities.

Quality of care over time

These measures show how residents usually do over time at this home, based on health outcomes and preventive care.

High-risk clinical events score Info A composite score based on pressure ulcers, falls with injury, weight loss, walking ability decline, and activities of daily living decline. 9.4
9% worse than Texas average

Texas average: 8.6

Functional decline score Info A composite score based on activities of daily living decline, walking ability decline, and incontinence. 19.8
23% worse than Texas average

Texas average: 16.0

Long-stay resident measures
Above average Texas avg: 4.2 Info CMS star rating based on long-stay quality measure performance. 5 stars = significantly above average, 1 star = significantly below average.
Need for Help with Daily Activities Increased Info Percent of long-stay residents whose need for help with daily activities has increased 23.7%
46% worse than Texas average

Texas average: 16.2%

Walking Ability Worsened Info Percent of long-stay residents whose ability to move independently worsened 10.6%
35% better than Texas average

Texas average: 16.2%

Low Risk Residents with Bowel/Bladder Incontinence Info Percent of low risk long-stay residents who lose control of their bowels or bladder 25.1%
60% worse than Texas average

Texas average: 15.7%

Falls with Major Injury Info Percent of long-stay residents experiencing one or more falls with major injury 6.2%
92% worse than Texas average

Texas average: 3.2%

High Risk Residents with Pressure Ulcers Info Percent of long-stay high risk residents with pressure ulcers 0.8%
82% better than Texas average

Texas average: 4.4%

Urinary Tract Infection Info Percent of long-stay residents with a urinary tract infection 1.2%
50% worse than Texas average

Texas average: 0.8%

Lost Too Much Weight Info Percent of long-stay residents who lose too much weight 5.6%
62% worse than Texas average

Texas average: 3.5%

Depressive Symptoms Info Percent of long-stay residents who have depressive symptoms 2.9%
In line with Texas average

Texas average: 2.9%

Pneumococcal Vaccine Info Percent of long-stay residents assessed and appropriately given the pneumococcal vaccine 87.9%
10% worse than Texas average

Texas average: 97.3%

Influenza Vaccine Info Percent of long-stay residents assessed and appropriately given the seasonal influenza vaccine 94.4%
In line with Texas average

Texas average: 97.9%

Hospitalizations per 1,000 days Info Number of hospitalizations per 1,000 long-stay resident days. 5.25
146% worse than Texas average

Texas average: 2.13

ED visits per 1,000 days Info Number of outpatient emergency department visits per 1,000 long-stay resident days. 1.17
43% better than Texas average

Texas average: 2.07

Short-stay resident measures
Significantly below average Texas avg: 2.9 Info CMS star rating based on short-stay quality measure performance. 5 stars = much above average, 1 star = much below average.
Pneumococcal Vaccine Info Percent of short-stay residents assessed and appropriately given the pneumococcal vaccine 23.5%
74% worse than Texas average

Texas average: 90.4%

Antipsychotic medication increase Info Percent of short-stay residents who newly received an antipsychotic medication 1.9%
28% worse than Texas average

Texas average: 1.4%

Influenza Vaccine Info Percent of short-stay residents assessed and appropriately given the seasonal influenza vaccine 31.3%
64% worse than Texas average

Texas average: 88.0%

Re-hospitalized after SNF stay Info Percentage of short-stay residents who were re-hospitalized after their nursing home admission. 29.1%
12% worse than Texas average

Texas average: 25.9%

Emergency department visits Info Percentage of short-stay residents who had an outpatient emergency department visit. 13.7%
14% worse than Texas average

Texas average: 12.0%

Falls with major injury Info Percentage of SNF residents who experience falls with major injury during their stay. 0.0%
100% better than Texas average

Texas average: 0.8%

Penalties and fines

Federal penalties imposed by CMS for regulatory violations, including civil money penalties (fines) and denials of payment for new Medicare/Medicaid admissions.

Source: CMS Penalties Database (Data as of Jan 2026)

Total fines amount $130K
62% higher than Texas average

Texas average: $80K

Number of fines 4
61% more fines than Texas average

Texas average: 2.5

Payment Denials Info Serious action where Medicare and/or Medicaid temporarily stops payments for new residents until issues are fixed. 1
354% more payment denials than Texas average

Texas average: 0.2

Fines amount comparison
This facility $130K
Texas average $80K
Penalty History

Penalties are imposed by CMS for violations of federal nursing home regulations.

Civil Money Penalty Info Fines imposed for noncompliance, which can be assessed per day or per instance of violation. Mar 9, 2025
$10K
Civil Money Penalty Info Fines imposed for noncompliance, which can be assessed per day or per instance of violation. Dec 1, 2023
$9K
Civil Money Penalty Info Fines imposed for noncompliance, which can be assessed per day or per instance of violation. Oct 26, 2023
$15K
Civil Money Penalty Info Fines imposed for noncompliance, which can be assessed per day or per instance of violation. Mar 3, 2023
$95K

Last updated: Jan 2026

Guides for Better Senior Living

Care Cost Calculator: See Prices in Your Area

Nursing Home Data Explorer

Don’t Wait Too Long: 7 Red Flag Signs Your Parent Needs Assisted Living Now

The True Cost of Assisted Living in 2025 – And How Families Are Paying For It

Understanding Senior Living Costs: Pricing Models, Discounts & Financial Assistance

Financial Aid for Texas Seniors

Get financial aid guidance

Community Care for the Aged and Disabled (CCAD)

TX Medicaid CCAD

Age 65+ or disabled, Texas resident, Medicaid-eligible, care need (not always nursing home level).

~$2,829/month (300% FBR, individual).

$2,000 (individual), $3,000 (couple).

Large state; rural access challenges.

Texas Community Care Services

TX CCS

Age 60+, Texas resident, at risk of decline.

~$2,000/month (individual, varies).

$5,000 (individual).

Limited funding; high demand in urban areas.

Area Agency on Aging (AAA) Services

Texas AAA Services

Age 60+, TX resident; no income/asset limits.

None; donations encouraged.

Not assessed.

28 AAAs; includes Meals on Wheels in some areas.

Medicare Savings Program (MSP)

Texas Medicare Savings Program

Age 65+ or disabled, TX resident, Medicare Part A/B.

~$2,510/month (QMB), ~$3,380/month (SLMB), ~$3,598/month (QI)—individual.

$9,430 (individual), $14,130 (couple).

Includes Extra Help for Part D; no waitlist.

Low-Income Home Energy Assistance Program (LIHEAP)

Texas Comprehensive Energy Assistance Program (CEAP)

Age 60+ prioritized, TX resident, low-income.

~$3,970/month (185% FPL).

Not assessed.

Priority for elderly/disabled; covers gas, electric, propane.

Family Caregiver Support Program (FCSP)

Texas Family Caregiver Support Program

Caregivers of 60+ needing care or 55+ caregivers of others; TX resident; 2+ ADLs.

No strict cap; prioritizes low-income (~$24,980/year).

Not assessed.

High rural demand; includes grandparent caregivers.

Senior Community Service Employment Program (SCSEP)

Texas SCSEP

Age 55+, unemployed, low-income, TX resident.

~$1,983/month (125% FPL).

Not specified.

Priority for veterans, rural residents; AARP partnership.

VA Aid and Attendance (A&A) and Housebound Benefits

Texas VA Aid and Attendance/Housebound

Age 65+ or disabled veteran/spouse, TX resident, wartime service, ADL help (A&A) or homebound.

Net income < ~$1,984/month (veteran with dependent, A&A); pension offsets income.

~$155,356 (net worth).

High veteran population; supports rural/urban needs.

Property Tax Exemption for Seniors

Texas Senior Property Tax Exemption

Age 65+, TX resident, homeowner (homestead).

None; tax-based eligibility.

Not assessed.

$25,000+ exemption; optional freeze in some counties; saves ~$500-$1,000/year.

Senior Farmers’ Market Nutrition Program (SFMNP)

Texas SFMNP

Age 60+, TX resident, low-income.

~$2,322/month (185% FPL).

Not assessed.

Vouchers (~$50/season); serves ~20,000 via 28 AAAs.