Total health inspections
8
California average 12.5
Last Health inspection on Nov 2025

We arrange tours, appointments, and even moving support so you don’t have to
Thank you for your interest!
Our team will be in touch shortly to help with next steps.


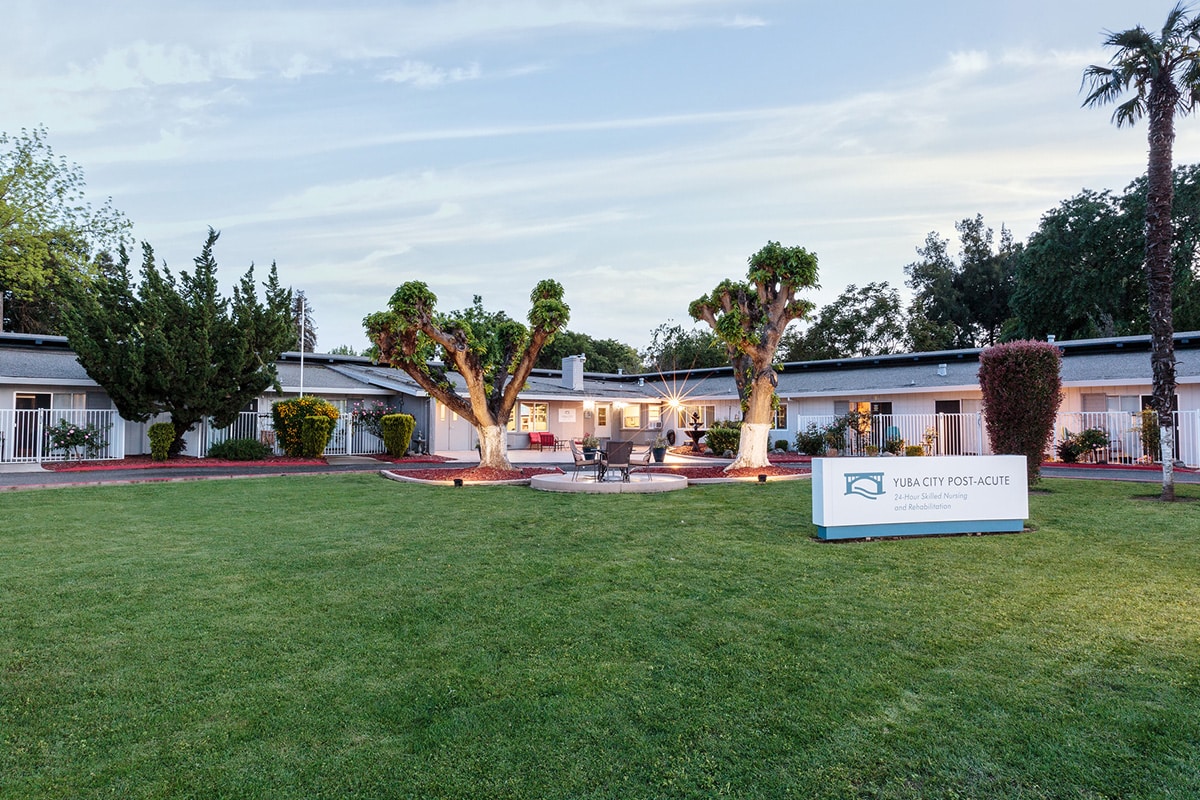
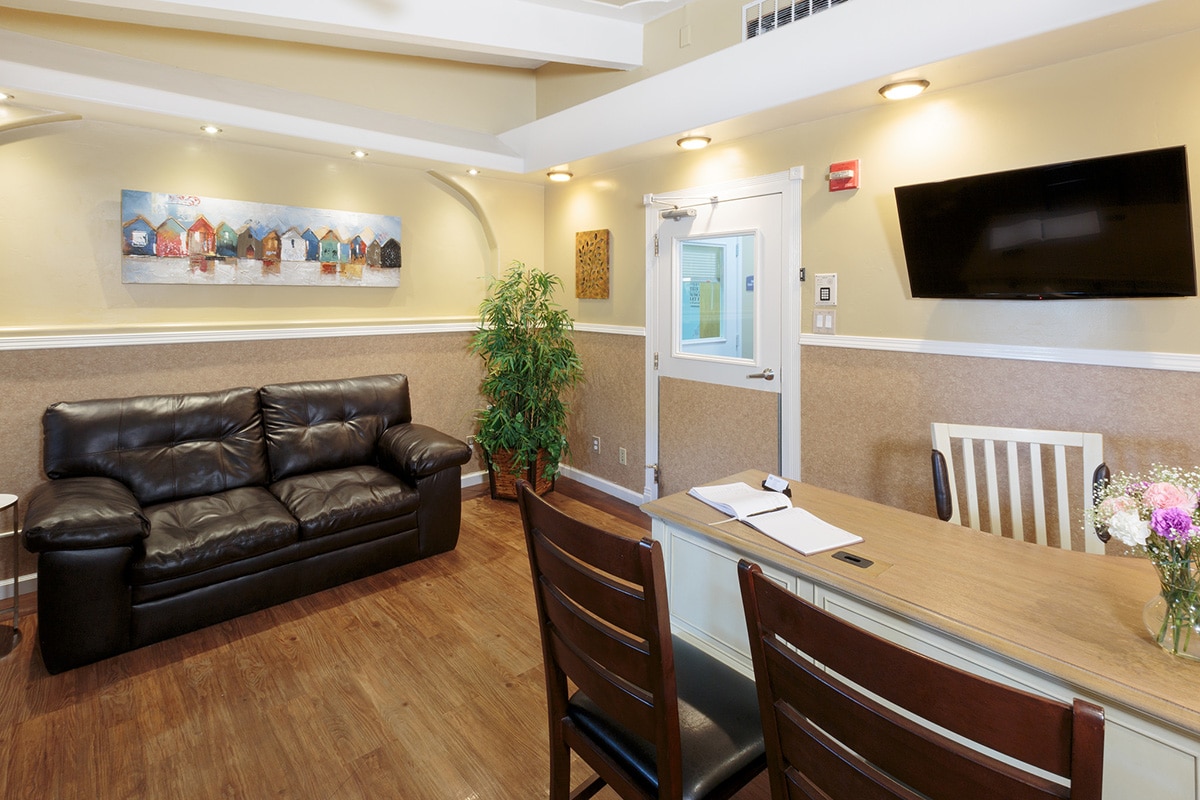
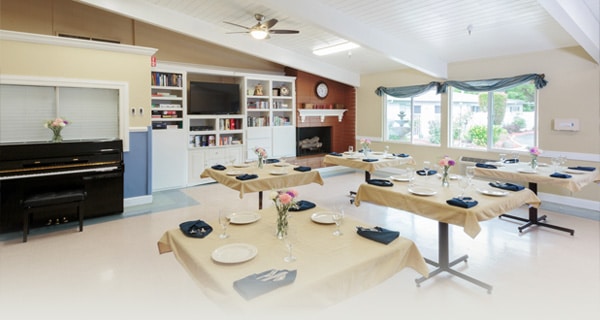
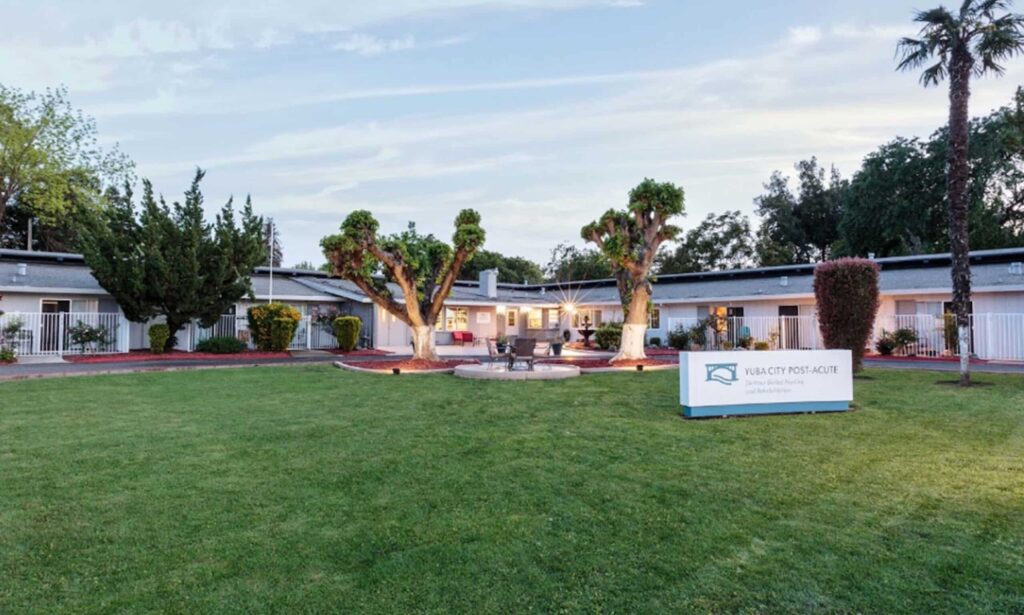
Situated in the vibrant California, Yuba City Post-acute is a Medicare-certified facility renowned for its cheerful staff dedicated to surpassing expectations and aiding seniors in achieving their optimal functional state. With round-the-clock skilled nursing care, the facility stands out as a four-star haven with 59 beds.
Yuba City Post-acute sets itself apart by providing comprehensive nursing home care, offering services such as speech, physical, and occupational therapy. The facility’s commitment to excellence is reflected not only in its skilled nursing offerings but also in its adherence to nursing home qualifications, making it a great choice for those seeking top-tier care in a vibrant and supportive environment.
May offer a more intimate, personalized care environment.
Occupancy is moderate, suggesting balanced demand.
Most residents typically stay for a few weeks or months before returning home or moving on.
65% of new residents, usually for short-term rehab.
32% of new residents, often for short stays.
3% of new residents, often for long-term daily care.
California average 12.5
Last Health inspection on Nov 2025
California average 50.2
California average 4.65
Health citations are formal notices following inspections when they fail to comply with safety and care standards.
40 of 48 citations resulted from standard inspections; 6 of 48 resulted from complaint investigations; and 2 of 48 came from combined inspections (standard and complaint).
California average: 0.4
California average: 1
Data sourced from CMS Health Deficiencies reports. Citation severity codes range from A (least serious) to L (most serious). Immediate Jeopardy (J-L) citations indicate situations where the facility's noncompliance has placed residents at risk of death or serious harm.
Home Care Professional care delivered in the person's own home — from companionship and errands to skilled nursing and therapy. Allows seniors to age in place. Medicare covers skilled home health when medically necessary.
Nursing Home Licensed facility providing 24/7 skilled nursing care for residents with complex, ongoing medical needs. Staffed by RNs, LPNs, and CNAs. Inspected and star-rated annually by CMS. Accepts Medicare (short-term rehab) and Medicaid (long-term care).
Nursing Home Licensed facility providing 24/7 skilled nursing care for residents with complex, ongoing medical needs. Staffed by RNs, LPNs, and CNAs. Inspected and star-rated annually by CMS. Accepts Medicare (short-term rehab) and Medicaid (long-term care).
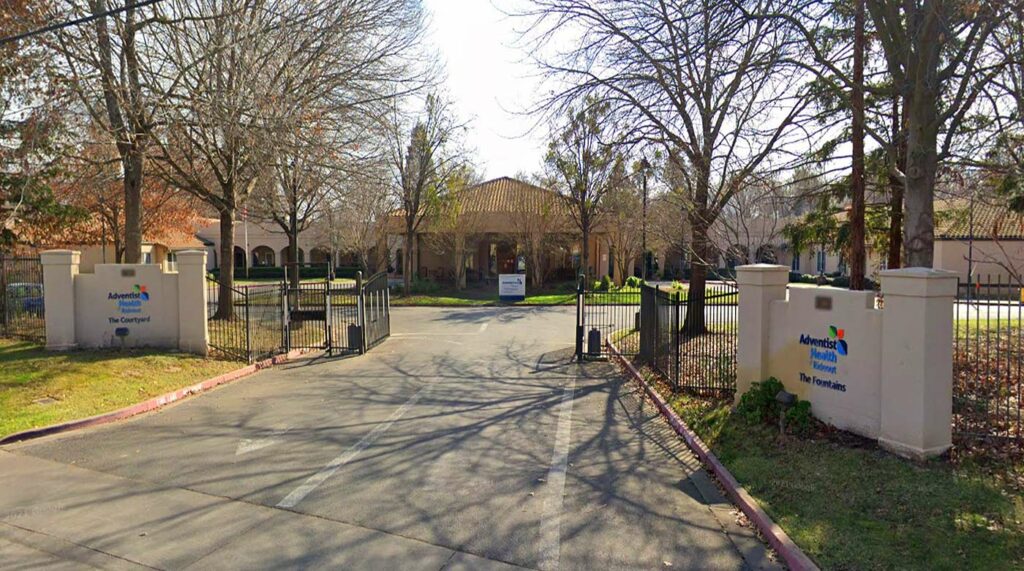
![]() 0.5 miles from city center — 0.43 miles to nearest hospital (The Ortner Management Group)
0.5 miles from city center — 0.43 miles to nearest hospital (The Ortner Management Group)
![]() 1220 Plumas St, Yuba City, CA 95991
1220 Plumas St, Yuba City, CA 95991
Add your location
This data corresponds to Q2 2025 and is based on CMS Payroll-Based Journal.
California average ratio: 0.00:1
California average: 7.7 hours
Manages medical care and health needs.
No contractors work on this role.
Assists with medical care and medications.
No contractors work on this role.
Helps with daily care and mobility.
No contractors work on this role.
Total hours from contractors
2,593 contractor hours this quarter
| Certified Nursing Assistant | 57 | 0 | 57 | 13,688 | 91 | 100% | 7.4 |
| Licensed Practical Nurse | 13 | 0 | 13 | 4,251 | 91 | 100% | 7.7 |
| Registered Nurse | 5 | 0 | 5 | 1,477 | 91 | 100% | 7.6 |
| Speech Language Pathologist | 0 | 3 | 3 | 1,045 | 66 | 73% | 8 |
| RN Director of Nursing | 2 | 0 | 2 | 1,016 | 77 | 85% | 7.3 |
| Other Dietary Services Staff | 7 | 0 | 7 | 920 | 91 | 100% | 7.3 |
| Dental Services Staff | 1 | 0 | 1 | 541 | 66 | 73% | 8.2 |
| Physical Therapy Assistant | 0 | 1 | 1 | 522 | 65 | 71% | 8 |
| Nurse Practitioner | 1 | 0 | 1 | 512 | 64 | 70% | 8 |
| Physical Therapy Aide | 0 | 1 | 1 | 503 | 63 | 69% | 8 |
| Dietitian | 1 | 0 | 1 | 354 | 68 | 75% | 5.2 |
| Respiratory Therapy Technician | 0 | 5 | 5 | 264 | 70 | 77% | 2.6 |
| Qualified Social Worker | 0 | 1 | 1 | 259 | 43 | 47% | 6 |
| Administrator | 1 | 0 | 1 | 256 | 64 | 70% | 4 |
| Occupational Therapy Aide | 1 | 0 | 1 | 134 | 19 | 21% | 7.1 |
Source: CMS Long-Term Care Facility Characteristics (Data as of Jan 2026)
Residents meet regularly to discuss policies, care quality, and activities
State-approved Nurse Aide Training and Competency Evaluation Program on-site
Organized group of residents that meets regularly to discuss facility policies, quality of life, and activities.
Data sourced from CMS Long-Term Care Facility Characteristics quarterly report. Payer mix reflects the current resident census by primary payment source.
These measures show how residents usually do over time at this home, based on health outcomes and preventive care.
California average: 6.6
California average: 11.3
California average: 11.1%
California average: 12.0%
California average: 11.3%
California average: 1.7%
California average: 5.0%
California average: 1.2%
California average: 4.2%
California average: 6.7%
California average: 10.1%
California average: 98.5%
California average: 98.2%
California average: 2.25
California average: 1.59
California average: 94.0%
California average: 1.5%
California average: 93.2%
California average: 23.2%
California average: 11.2%
California average: 0.8%
California average: 53.7%
California average: 50.6%
Quality measures are calculated from Minimum Data Set (MDS) assessments. For most measures, lower percentages indicate better care quality.
Historical financial and operational data for Yuba City Post-Acute based on CMS SNF Cost Reports.
Loading trend charts...
Care Cost Calculator: See Prices in Your Area
Nursing Home Data Explorer
Don’t Wait Too Long: 7 Red Flag Signs Your Parent Needs Assisted Living Now
The True Cost of Assisted Living in 2025 – And How Families Are Paying For It
Understanding Senior Living Costs: Pricing Models, Discounts & Financial Assistance

Touring a community? Use this expert-backed checklist to stay organized, ask the right questions, and find the perfect fit.
We'll send you a PDF version of the touring checklist.