Carmi Manor Rehabilitation and Nursing
Nursing Home & Respite Care · Carmi, IL
CMS overall rating Info The Overall CMS Rating is scored from 1 to 5 stars and combines results from health inspections, staffing levels, and quality measures. Health inspections carry the most weight. Staffing and quality scores can increase or decrease the final rating based on performance compared to state and national standards.

Carmi Manor Rehabilitation and Nursing

Nursing Home & Respite Care · Carmi, IL
CMS overall rating Info The Overall CMS Rating is scored from 1 to 5 stars and combines results from health inspections, staffing levels, and quality measures. Health inspections carry the most weight. Staffing and quality scores can increase or decrease the final rating based on performance compared to state and national standards.
Calculator: See prices in your area
Carmi Manor Rehabilitation and Nursing accepts Medicare, Medicaid, and private pay.

Overview of Carmi Manor Rehabilitation and Nursing

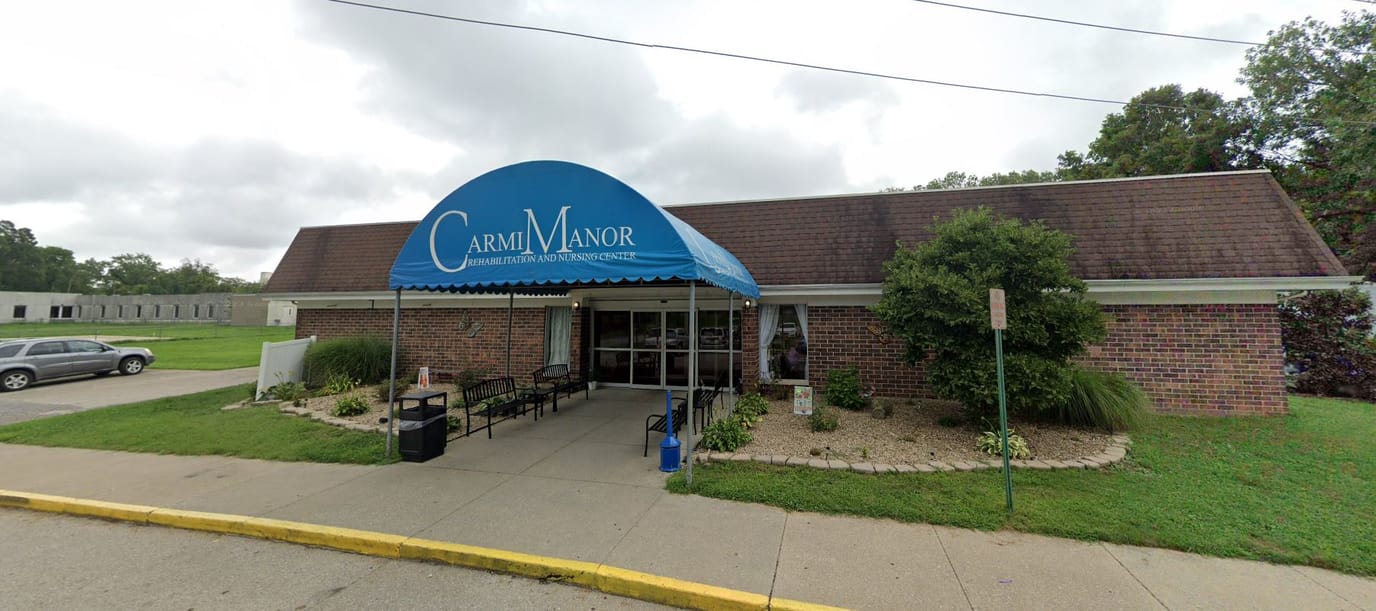
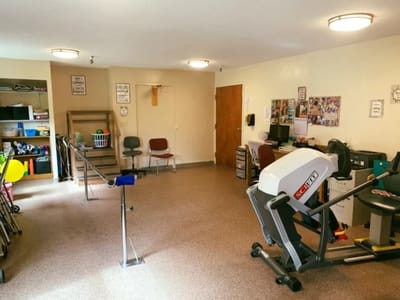
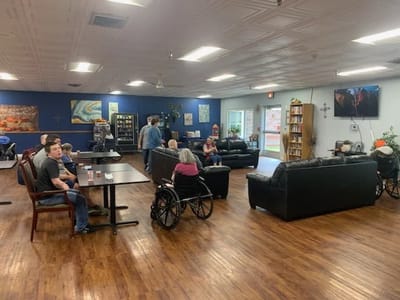
Burrowed in the historic city of Carmi, IL, Carmi Manor Rehabilitation and Nursing Center is an excellent senior care provider that offers nursing care, speech therapy, physical therapy, occupational therapy, post-operative care, short-term care, and long-term care. A team of licensed clinical nurses provides 24/7 assessments and care under the supervision of a medical director and attending physicians. The community ensures their dedicated and expertly trained team members provide the highest standard of care with utmost empathy and professionalism.

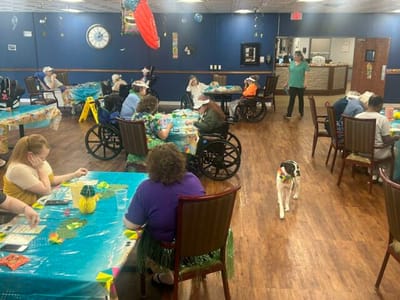
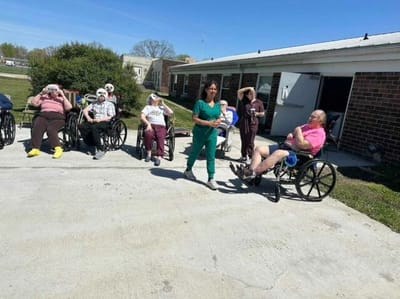
Carmi Manor goes above and beyond to ensure that all aspects of its residents’ well-being from physical health to emotional and mental aspects are cared for. The community features a variety of amenities and activities that supports healing, wellness, and a renewed sense of vitality. Residents find entertainment from complimentary cable and internet, telephone service, and enriching activity programs. Home-like living room setting, enhanced dining options, and beautiful outdoor courtyard adds to the comfort of residents, giving them a completely warm and supportive environment that fosters quick recovery.

Quality ratings

Measured by Centers for Medicare & Medicaid Services (CMS)

Overall rating Info The Overall CMS Rating combines results from health inspections, staffing levels and quality measures. Health inspections carry the most weight. Staffing and quality scores can increase or decrease the final rating based on performance compared to state and national standards.
▼ 60.3% Below IL avg.
Health Inspection Info Based on the results of the facility's three most recent standard inspections and any complaint investigations. CMS reviews the number, scope, and severity of deficiencies, with more recent findings weighted more heavily.
▼ 28.0% Below IL avg.
Staffing Info Measures average nursing staff hours per resident per day, including Registered Nurses (RNs) and total nursing staff. Ratings are adjusted based on the level of care residents require and are compared to state and national benchmarks.
▼ 53.2% Below IL avg.
Quality Measures Info Based on clinical and physical health indicators reported to CMS, such as hospital readmissions, falls, pressure ulcers, and improvements in mobility. These measures reflect how well residents' health needs are being managed.
▲ 42.1% Above IL avg.

Staffing hours breakdown

Info Daily nursing hours per resident by staff type, reported to CMS. Higher is generally better — compare this facility to state and national averages to see where staffing stands.

Hours per resident per day — compared to Illinois state averages

Total nursing care / resident Info This home is ranked 99th out of 122 homes in Illinois.

Total adjusted nursing hours per resident per day, combining RN, LPN, and aide time. CMS adjusts this for case-mix so facilities can be fairly compared.
2h 23m per day
Rank #99 / 122Nurse hours — state benchmarkedThis home is ranked 99th out of 122 homes in Illinois.Shows adjusted nurse hours per resident per day benchmarked to the Illinois average, with a ranking across 122 Illinois SNFs. More hours mean more direct care. The national average is about 3.5 hrs; below 3.0 is a red flag.
This facility Illinois avg (3h 6m per day)
vs Illinois avg
-23%

4 of 6 metrics below state avg

Standout metric Nurse Aide is +18% above state avg
Staff type Hours / day vs state avg
Registered Nurse (RN) Info RNs hold the highest nursing license and can assess residents, interpret test results, and direct care plans. More RN hours per day often signals stronger clinical oversight and faster response to health changes. 28m per day ▼ 36% State avg: 44m per day · National avg: 41m per day
LPN / LVN Info Licensed Practical Nurses (LPNs) or Licensed Vocational Nurses (LVNs) deliver routine hands-on care — medication administration, wound dressing, and monitoring vital signs. They work under RN supervision and make up a large share of daily bedside care. 38m per day ■ Avg State avg: 38m per day · National avg: 52m per day
Nurse Aide Info Certified Nurse Aides (CNAs) provide the most direct day-to-day assistance: bathing, dressing, feeding, and mobility. Nurse aide hours are typically the largest staffing category and directly affect residents' quality of life. 2h 31m per day ▲ 18% State avg: 2h 8m per day · National avg: 2h 21m per day
Total Nursing (Weekend) Info Combined nursing hours (RN + LPN + Nurse Aide) per resident per day on weekends. Staffing often drops on weekends — this figure reveals whether the facility maintains adequate coverage outside of weekday hours. 2h 49m per day ▼ 9% State avg: 3h 5m per day · National avg: 3h 26m per day
Physical Therapist Info Hours per resident per day provided by licensed Physical Therapists (PTs) or PT Assistants. PT services help residents recover mobility after injury or illness and are especially important for post-acute (short-stay) rehabilitation. 1m per day ▼ 67% State avg: 3m per day · National avg: 4m per day
RN (Weekend) Info Registered nurse hours specifically on weekends. Facilities sometimes reduce RN presence on Saturdays and Sundays — a low weekend RN figure compared to weekday hours can indicate reduced clinical oversight when most administrative staff are absent. 19m per day ▼ 44% State avg: 34m per day · National avg: 29m per day

Capacity and availability

This home usually has availability

Occupancy lower than 85% suggests more openings may be available.

Lower occupancy than the Illinois average: 69.3%
Occupancy rate 63.2% Rank #90 / 122Occupancy rate — state benchmarkedThis home is ranked 90th out of 122 homes in Illinois.Shows this facility's occupancy rate versus the Illinois average, with its statewide rank out of 122. Higher occupancy signals strong local demand and financial stability.
Avg. Length of Stay 187 days
Occupancy rate
63.2% Rank #90 / 122Occupancy rate — state benchmarkedThis home is ranked 90th out of 122 homes in Illinois.Shows this facility's occupancy rate versus the Illinois average, with its statewide rank out of 122. Higher occupancy signals strong local demand and financial stability.
Avg. Length of Stay
187 days

Who this home usually serves

TYPE OF STAY

Mostly short-term rehab stays

Most residents typically stay for a few weeks or months before returning home or moving on.

Breakdown by payment type

Medicare

45% of new residents, usually for short-term rehab.

Typical stay 1 - 2 months

Private pay

13% of new residents, often for short stays.

Typical stay 4 - 5 months

Medicaid

42% of new residents, often for long-term daily care.

Typical stay 8 - 9 months

Finances and operations

Privately-owned community
Home revenue
$6.5M
Profit
$664.9K
Privately-owned community
Home revenue
$6.5M Rank #109 / 120Revenue — state benchmarkedThis home is ranked 109th out of 120 homes in Illinois.Shows this facility's annual revenue compared to the Illinois SNF average. Higher revenue generally means more resources for staffing and capital — read alongside Payroll %.
Profit
$664.9K
Payroll costs Info The portion of the home's budget spent on staff, including nurses, caregivers, and other employees who support care and operations. Rank #114 / 120Payroll — state benchmarkedThis home is ranked 114th out of 120 homes in Illinois.Shows total annual staff payroll benchmarked to the Illinois average. Higher payroll investment relative to peers often signals better staffing and less reliance on cheaper contract labor.
$2.9M
45.2% of revenue Rank #65 / 120Payroll % — state benchmarkedThis home is ranked 65th out of 120 homes in Illinois.Shows payroll as a percentage of revenue versus the Illinois average. Well-run SNFs often land around 55–65%. Below 25% may signal understaffing or heavy agency use — read with Staffing ratings.
Other operating costs Info All remaining costs needed to run the home, such as food, utilities, building maintenance, supplies and administrative expenses.
$2.9M
Total costs $5.9M
Walk Score
Walk Score: 36 / 100 Rank #68 / 94Walk Score — state benchmarkedThis home is ranked 68th out of 94 homes in Illinois.Shows how walkable this facility's neighborhood is compared to the average Walk Score across Illinois SNFs. Higher scores benefit residents, families, and staff.
Somewhat walkable. A few nearby services may be reachable on foot, but most trips require transportation.

About this community

Therapy & Rehabilitation

1 service
Rehabilitation Services

Amenities & Lifestyle

Specific ProgramsPostoperative Care

What does this home offer?

Housing options icon

Housing Options: Private Rooms / Semi-Private Rooms

Building type icon
Building type icon

Building Type: Single-story

Types of Care at Carmi Manor Rehabilitation and Nursing

Nursing Home Respite Care

Contact Carmi Manor Rehabilitation and Nursing

Health Inspection History

Inspections
Total health inspections 17

Illinois average 10.4


Last Health inspection on Aug 2025

Total health citations
41 Rank #84 / 121Health citations — state benchmarkedThis home is ranked 84th out of 121 homes in Illinois.Shows this facility's total health deficiency citations benchmarked to the Illinois state average, with a ranking across all 121 IL SNFs. Lower citation counts earn a better rank.

Illinois average 36.8

Citations per inspection
2.41 Rank #15 / 121Citations per inspection — state benchmarkedThis home is ranked 15th out of 121 homes in Illinois.Shows average deficiency citations per CMS inspection for this facility versus the Illinois mean across 121 SNFs with citation data. Lower is better.

Illinois average 3.68


Health citations are formal notices following inspections when they fail to comply with safety and care standards.

14 of 41 citations resulted from standard inspections; and 27 of 41 resulted from complaint investigations.

Breakdown of citation severity (last 4 years)
Critical Health citations More info
1
43% worse than Illinois average

Illinois average: 0.7


Serious Health citations More info 2
44% better than Illinois average

Illinois average: 3.6

1 critical citation More info Illinois average: 0.7

2 serious citations More info Illinois average: 3.6

37 moderate citations More info Illinois average: 32

1 minor citation More info Illinois average: 0.5
Citations history (last 4 years)
Environmental minor citation Info Issues related to building safety, cleanliness, maintenance, and overall living conditions. Aug 25, 2025
Corrected

Resident Rights moderate citation Info Issues related to resident's rights, including dignity, privacy, and the ability to make decisions about their care. Aug 25, 2025
Corrected

Infection Control moderate citation Info Issues related to preventing and controlling infections, including hygiene practices and safety protocols. Feb 28, 2025
Corrected

Nursing Services moderate citation Info Issues related to the availability and quality of nursing staff and the care they provide. Feb 28, 2025
Corrected

Financial Assistance for
Nursing Home in Illinois

Carmi Manor Rehabilitation and Nursing is located in Carmi, Illinois.
Here are the financial assistance programs available to residents in Illinois.

Get Financial aid guidance

Community Care Program

Illinois CCP

Age 60+
General Illinois resident, at risk of nursing home placement.
Income Limits (2025) ~$1,215/month individual
Asset Limits $17,500 individual, excludes home, car
IL

High demand in urban areas; waitlists possible.

Benefits
In-home care (3-5 hours/day) Adult day services ($65/day) Emergency home response systems ($30/month)

Illinois Respite Program

IL Respite (via NFCSP)

Age Caregiver of someone 60+ (or with dementia)
General Illinois resident.
Income Limits No strict limit; prioritizes low-income.
Asset Limits Not applicable.
IL

Limited slots; urban/rural balance.

Benefits
In-home respite (4-6 hours/day) Adult day care (~$65/day) Short-term facility care (up to 5 days)

Supportive Living Program (SLP)

Illinois Medicaid Supportive Living Program

Age 65+ or 22-64 with disability
General Illinois resident, Medicaid-eligible, needs moderate assistance (not nursing home-level).
Income Limits (2025) ~$2,829/month (300% FBR, individual); QIT allowed.
Asset Limits $2,000 (individual), $3,000 (couple) (excludes home, car).
IL

~200 SLP sites statewide; room/board not covered.

Benefits
Personal care (5-7 hours/day, e.g., bathing, mobility) Meals Housekeeping Medication management Respite (~240 hours/year)

Persons Who Are Elderly Waiver

Illinois Medicaid Elderly Waiver

Age 65+
General Illinois resident, Medicaid-eligible, nursing home-level care need.
Income Limits (2025) ~$2,829/month 300% FBR, individual
Asset Limits $2,000 (individual), $3,000 (couple).
IL

Part of HealthChoice Illinois; consumer-directed options available.

Benefits
Personal care (5-7 hours/day, e.g., dressing, eating) Homemaker Adult day care (~$60/day) Respite (240 hours/year) Home mods ($1,000 avg.)

Medicare Savings Program (MSP)

Illinois Medicare Savings Program

Age 65+ or disabled
General Illinois resident, Medicare Part A/B.
Income Limits (2025) ~$2,510/month (QMB), ~$3,380/month (SLMB), ~$3,598/month (QI)—individual.
Asset Limits $9,430 (individual), $14,130 (couple).
IL

Three tiers; no waitlist.

Benefits
Covers Part B premiums ($174.70/month) Deductibles ($240/year) Copays (~20%)

Optional State Supplementation (OSS)

Illinois Optional State Supplementation

Age 65+ or disabled
General Illinois resident, in approved facility, SSI recipient or low-income.
Income Limits (2025) ~$1,004/month including SSI
Asset Limits $2,000 (individual), $3,000 (couple).
IL

~$50-$500/month based on facility type.

Benefits
Cash (~$50-$500/month) for room/board in personal care homes or SLFs

VA Aid and Attendance (A&A) and Housebound Benefits

Illinois VA Aid and Attendance/Housebound

Age 65+ or disabled veteran/spouse
General Illinois resident, wartime service, need for ADL help (A&A) or homebound.
Income Limits (2025) Net income < ~$1,984/month (veteran with dependent, A&A); pension offsets income.
Asset Limits ~$155,356 net worth limit
IL

High veteran demand in urban/rural areas.

Benefits
Cash (~$1,433-$2,642/month veteran, ~$951-$1,318 spouse) for care costs (e.g., in-home, assisted living)

Places of interest near Carmi Manor Rehabilitation and Nursing

Address 0.9 mile from city center

Calculate Travel Distance to Carmi Manor Rehabilitation and Nursing

Add your location

Address

Staffing Data (Q2 2025)

This data corresponds to Q2 2025 and is based on CMS Payroll-Based Journal.

Total staff 77
Employees 77
Contractors 0
Staff to resident ratio 1.43:1
25% worse than Illinois average

Illinois average ratio: 1.90:1

Avg staff/day 33
Average shift 7.5 hours
0% compared with Illinois average

Illinois average: 7.6 hours

Total staff hours (quarter) 22,512

Nursing staff breakdown

Registered Nurse

Manages medical care and health needs.

Total count 8
Average shift length Info Average shift length. Calculated as total hours divided by days worked and average staff per day. 7.8 hours

No contractors work on this role.

Licensed Practical Nurse

Assists with medical care and medications.

Total count 6
Average shift length Info Average shift length. Calculated as total hours divided by days worked and average staff per day. 10 hours

No contractors work on this role.

Certified Nursing Assistant

Helps with daily care and mobility.

Total count 38
Average shift length Info Average shift length. Calculated as total hours divided by days worked and average staff per day. 6.9 hours

No contractors work on this role.

Contractor staffing

Total hours from contractors

0%

0 contractor hours this quarter

No contractor roles were reported this quarter.

Staff by category

Certified Nursing Assistant 38 0 38 10,311 91 100% 6.9
Physical Therapist 10 0 10 3,451 91 100% 8.1
Licensed Practical Nurse 6 0 6 2,559 91 100% 10
Registered Nurse 8 0 8 1,964 91 100% 7.8
Other Dietary Services Staff 4 0 4 578 71 78% 7.9
Qualified Social Worker 1 0 1 512 64 70% 8
Administrator 1 0 1 504 63 69% 8
Speech Language Pathologist 1 0 1 497 61 67% 8.1
Dental Services Staff 1 0 1 480 60 66% 8
Physical Therapy Assistant 1 0 1 459 58 64% 7.9
Physical Therapy Aide 1 0 1 455 62 68% 7.3
Nurse Practitioner 1 0 1 448 56 62% 8
Nurse Aide in Training 2 0 2 264 32 35% 7.8
Respiratory Therapy Technician 2 0 2 31 13 14% 2.2
38 Certified Nursing Assistant
% of Days 100%
10 Physical Therapist
% of Days 100%
6 Licensed Practical Nurse
% of Days 100%
8 Registered Nurse
% of Days 100%
4 Other Dietary Services Staff
% of Days 78%
1 Qualified Social Worker
% of Days 70%
1 Administrator
% of Days 69%
1 Speech Language Pathologist
% of Days 67%
1 Dental Services Staff
% of Days 66%
1 Physical Therapy Assistant
% of Days 64%
1 Physical Therapy Aide
% of Days 68%
1 Nurse Practitioner
% of Days 62%
2 Nurse Aide in Training
% of Days 35%
2 Respiratory Therapy Technician
% of Days 14%

Facility Characteristics

Source: CMS Long-Term Care Facility Characteristics (Data as of Jan 2026)

Total residents 54
Medicare
7
13% of residents
Medicaid
44
81.5% of residents
Private pay or other
3
5.6% of residents
Programs & Services
Residents Group

Residents meet regularly to discuss policies, care quality, and activities

Active Resident Council

Organized group of residents that meets regularly to discuss facility policies, quality of life, and activities.

Quality of care over time

These measures show how residents usually do over time at this home, based on health outcomes and preventive care.

High-risk clinical events score Info A composite score based on pressure ulcers, falls with injury, weight loss, walking ability decline, and activities of daily living decline. 3.4
65% better than Illinois average

Illinois average: 9.7

Functional decline score Info A composite score based on activities of daily living decline, walking ability decline, and incontinence. 7.6
59% better than Illinois average

Illinois average: 18.6

Long-stay resident measures
Significantly above average Illinois avg: 3.6 Info CMS star rating based on long-stay quality measure performance. 5 stars = significantly above average, 1 star = significantly below average.
Need for Help with Daily Activities Increased Info Percent of long-stay residents whose need for help with daily activities has increased 2.4%
84% better than Illinois average

Illinois average: 15.5%

Walking Ability Worsened Info Percent of long-stay residents whose ability to move independently worsened 1.1%
94% better than Illinois average

Illinois average: 18.4%

Low Risk Residents with Bowel/Bladder Incontinence Info Percent of low risk long-stay residents who lose control of their bowels or bladder 19.3%
11% better than Illinois average

Illinois average: 21.6%

Falls with Major Injury Info Percent of long-stay residents experiencing one or more falls with major injury 1.6%
51% better than Illinois average

Illinois average: 3.4%

High Risk Residents with Pressure Ulcers Info Percent of long-stay high risk residents with pressure ulcers 3.3%
38% better than Illinois average

Illinois average: 5.3%

Urinary Tract Infection Info Percent of long-stay residents with a urinary tract infection 0.6%
69% better than Illinois average

Illinois average: 1.8%

Lost Too Much Weight Info Percent of long-stay residents who lose too much weight 8.4%
29% worse than Illinois average

Illinois average: 6.5%

Depressive Symptoms Info Percent of long-stay residents who have depressive symptoms 98.8%
105% worse than Illinois average

Illinois average: 48.1%

Antipsychotic Use Info Percent of long-stay residents who received an antipsychotic medication 1.9%
90% better than Illinois average

Illinois average: 20.2%

Pneumococcal Vaccine Info Percent of long-stay residents assessed and appropriately given the pneumococcal vaccine 100.0%
12% better than Illinois average

Illinois average: 89.2%

Influenza Vaccine Info Percent of long-stay residents assessed and appropriately given the seasonal influenza vaccine 98.1%
7% better than Illinois average

Illinois average: 91.6%

Hospitalizations per 1,000 days Info Number of hospitalizations per 1,000 long-stay resident days. 1.86
9% better than Illinois average

Illinois average: 2.05

ED visits per 1,000 days Info Number of outpatient emergency department visits per 1,000 long-stay resident days. 4.17
85% worse than Illinois average

Illinois average: 2.25

Short-stay resident measures
Pneumococcal Vaccine Info Percent of short-stay residents assessed and appropriately given the pneumococcal vaccine 98.8%
45% better than Illinois average

Illinois average: 68.3%

Antipsychotic medication increase Info Percent of short-stay residents who newly received an antipsychotic medication 0.0%
100% better than Illinois average

Illinois average: 2.3%

Penalties and fines

Federal penalties imposed by CMS for regulatory violations, including civil money penalties (fines) and denials of payment for new Medicare/Medicaid admissions.

Source: CMS Penalties Database (Data as of Jan 2026)

Total fines amount $142K
In line with Illinois average

Illinois average: $143K

Number of fines 1
66% fewer fines than Illinois average

Illinois average: 3.0

Payment Denials Info Serious action where Medicare and/or Medicaid temporarily stops payments for new residents until issues are fixed. 0
100% fewer payment denials than Illinois average

Illinois average: 1.1

Fines amount comparison
This facility $142K
Illinois average $143K
Penalty History

Penalties are imposed by CMS for violations of federal nursing home regulations.

1 penalty in the past 3 years

Oct 23, 2024 · $142K

Civil Money Penalty Info Fines imposed for noncompliance, which can be assessed per day or per instance of violation. Oct 23, 2024
$142K

Last updated: Jan 2026

Guides for Better Senior Living

Care Cost Calculator: See Prices in Your Area

Nursing Home Data Explorer

Don’t Wait Too Long: 7 Red Flag Signs Your Parent Needs Assisted Living Now

The True Cost of Assisted Living in 2025 – And How Families Are Paying For It

Understanding Senior Living Costs: Pricing Models, Discounts & Financial Assistance

Frequently Asked Questions about Carmi Manor Rehabilitation and Nursing

What neighborhood is Carmi Manor Rehabilitation and Nursing in?

Carmi Manor Rehabilitation and Nursing is in the West Webb Street neighborhood.

Is Carmi Manor Rehabilitation and Nursing in a walkable area?

Carmi Manor Rehabilitation and Nursing has a walk score of 36. Somewhat walkable. A few nearby services may be reachable on foot, but most trips require transportation.

Are there photos of Carmi Manor Rehabilitation and Nursing?

Yes — there are 6 photos of Carmi Manor Rehabilitation and Nursing in the photo gallery on this page.

What is the phone number of Carmi Manor Rehabilitation and Nursing?

(618) 382-7270 will put you in contact with the team at Carmi Manor Rehabilitation and Nursing.

Is Carmi Manor Rehabilitation and Nursing Medicare or Medicaid certified?

Yes — Carmi Manor Rehabilitation and Nursing is a CMS-certified provider of Medicare and Medicaid.

Explore Open Rooms
1 Contact details
2 What type of senior care service are you looking for?
3 What budget do you have in mind for senior care?
4 How soon do you need to find care?
5 Additional details

Thank you for your interest!

Our team will be in touch shortly to help with next steps.