Heritage Nursing Center

Nursing Home in Kennett

CMS overall rating Info The Overall CMS Rating is scored from 1 to 5 stars and combines results from health inspections, staffing levels, and quality measures. Health inspections carry the most weight. Staffing and quality scores can increase or decrease the final rating based on performance compared to state and national standards.

Overview of Heritage Nursing Center

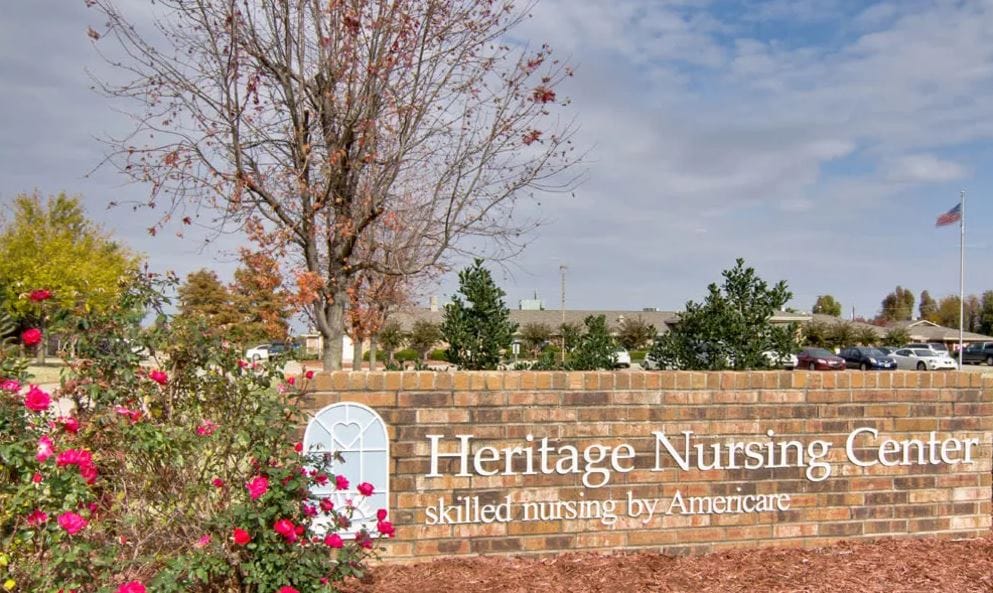
Committed to helping seniors age in place, Heritage Nursing Center is a trustworthy senior care provider in Kennett, MO, that offers skilled nursing, hospice care, rehabilitation, and home health care. The community provides private and semi-private studio apartments designed to cater to the individual needs of each living option. Ensuring residents receive unmatched care and support, the community provides a dedicated team of skilled nurses and therapists.

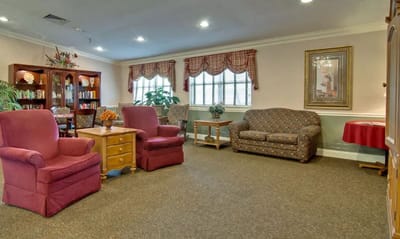
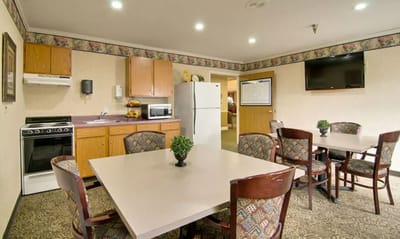
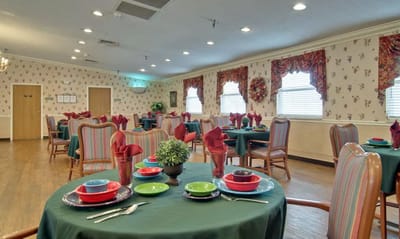
With access to an array of rehabilitative services, including physical, occupational, and speech therapy, residents are guaranteed to regain and maintain their independence. Fostering well being and enrichment in every moment, the community offers a wide array of engaging and enriching activities. From lunch with friends, to relaxing walks around the grounds and live music performances, residents are guaranteed to find something interesting to spend their time with. Meals are prepared to be both delicious, healthy, and catered to residents’ individual dietary needs and tastes, ensuring residents always have the energy to participate and engage in an active lifestyle.

(318) 624-1166

Quality ratings

Measured by Centers for Medicare & Medicaid Services (CMS)

Overall rating Info The Overall CMS Rating combines results from health inspections, staffing levels and quality measures. Health inspections carry the most weight. Staffing and quality scores can increase or decrease the final rating based on performance compared to state and national standards.
4/5 ▲ 1.5 Missouri average: 2.5/5
Health Inspection Info Based on the results of the facility's three most recent standard inspections and any complaint investigations. CMS reviews the number, scope, and severity of deficiencies, with more recent findings weighted more heavily.
5/5 ▲ 2.2 Missouri average: 2.8/5
Staffing Info Measures average nursing staff hours per resident per day, including Registered Nurses (RNs) and total nursing staff. Ratings are adjusted based on the level of care residents require and are compared to state and national benchmarks.
4/5 ▲ 1.8 Missouri average: 2.2/5
Quality Measures Info Based on clinical and physical health indicators reported to CMS, such as hospital readmissions, falls, pressure ulcers, and improvements in mobility. These measures reflect how well residents' health needs are being managed.
1/5 ▼ 1.7 Missouri average: 2.7/5

Staffing hours breakdown

Info Daily nursing hours per resident by staff type, reported to CMS. Higher is generally better — compare this facility to state and national averages to see where staffing stands.

Hours per resident per day — compared to Missouri state averages

Total nursing care / resident Info This home is ranked 102nd out of 251 homes in Missouri.

Total adjusted nursing hours per resident per day, combining RN, LPN, and aide time. CMS adjusts this for case-mix so facilities can be fairly compared.
3h 55m per day
Rank #102 / 251Nurse hours — state benchmarkedThis home is ranked 102nd out of 251 homes in Missouri.Shows adjusted nurse hours per resident per day benchmarked to the Missouri average, with a ranking across 251 Missouri SNFs. More hours mean more direct care. The national average is about 3.5 hrs; below 3.0 is a red flag.
This facility Missouri avg (3h 44m per day)
vs Missouri avg
+5%

1 of 6 metrics below state avg

Standout metric Physical Therapist is +100% above state avg
Staff typeHours / dayvs state avg
Registered Nurse (RN) Info RNs hold the highest nursing license and can assess residents, interpret test results, and direct care plans. More RN hours per day often signals stronger clinical oversight and faster response to health changes. 32m per day ▲ 14% State avg: 28m per day · National avg: 41m per day
LPN / LVN Info Licensed Practical Nurses (LPNs) or Licensed Vocational Nurses (LVNs) deliver routine hands-on care — medication administration, wound dressing, and monitoring vital signs. They work under RN supervision and make up a large share of daily bedside care. 40m per day ■ Avg State avg: 41m per day · National avg: 52m per day
Nurse Aide Info Certified Nurse Aides (CNAs) provide the most direct day-to-day assistance: bathing, dressing, feeding, and mobility. Nurse aide hours are typically the largest staffing category and directly affect residents' quality of life. 2h 24m per day ▲ 3% State avg: 2h 20m per day · National avg: 2h 21m per day
Total Nursing (Weekend) Info Combined nursing hours (RN + LPN + Nurse Aide) per resident per day on weekends. Staffing often drops on weekends — this figure reveals whether the facility maintains adequate coverage outside of weekday hours. 2h 59m per day ■ Avg State avg: 3h 3m per day · National avg: 3h 26m per day
Physical Therapist Info Hours per resident per day provided by licensed Physical Therapists (PTs) or PT Assistants. PT services help residents recover mobility after injury or illness and are especially important for post-acute (short-stay) rehabilitation. 4m per day ▲ 100% State avg: 2m per day · National avg: 4m per day
RN (Weekend) Info Registered nurse hours specifically on weekends. Facilities sometimes reduce RN presence on Saturdays and Sundays — a low weekend RN figure compared to weekday hours can indicate reduced clinical oversight when most administrative staff are absent. 14m per day ▼ 30% State avg: 20m per day · National avg: 29m per day

Capacity and availability

This home usually has availability

Occupancy lower than 85% suggests more openings may be available.

Lower occupancy than the Missouri average: 66.6%
Occupancy rate 58.7% Rank #181 / 257Occupancy rate — state benchmarkedThis home is ranked 181st out of 257 homes in Missouri.Shows this facility's occupancy rate versus the Missouri average, with its statewide rank out of 257. Higher occupancy signals strong local demand and financial stability.
Avg. Length of Stay 112 days
Occupancy rate
58.7% Rank #181 / 257Occupancy rate — state benchmarkedThis home is ranked 181st out of 257 homes in Missouri.Shows this facility's occupancy rate versus the Missouri average, with its statewide rank out of 257. Higher occupancy signals strong local demand and financial stability.
Avg. Length of Stay
112 days

Who this home usually serves

TYPE OF STAY

Mostly short-term rehab stays

Most residents typically stay for a few weeks or months before returning home or moving on.

Might be optimal for
Short stays Recovery Medicare-covered care

Breakdown by payment type

Medicare

58% of new residents, usually for short-term rehab.

Typical stay 30 days

Private pay

24% of new residents, often for short stays.

Typical stay 2 - 3 months

Medicaid

18% of new residents, often for long-term daily care.

Typical stay 1 years

Finances and operations

Privately-owned community
Operated by a business corporation.
Home revenue
$4.2M
Profit
$576.3K
Privately-owned community Operated by a business corporation.
Home revenue
$4.2M Rank #202 / 258Revenue — state benchmarkedThis home is ranked 202nd out of 258 homes in Missouri.Shows this facility's annual revenue compared to the Missouri SNF average. Higher revenue generally means more resources for staffing and capital — read alongside Payroll %.
Profit
$576.3K
Payroll costs Info The portion of the home's budget spent on staff, including nurses, caregivers, and other employees who support care and operations. Rank #206 / 258Payroll — state benchmarkedThis home is ranked 206th out of 258 homes in Missouri.Shows total annual staff payroll benchmarked to the Missouri average. Higher payroll investment relative to peers often signals better staffing and less reliance on cheaper contract labor.
$1.7M
41.4% of revenue Rank #146 / 258Payroll % — state benchmarkedThis home is ranked 146th out of 258 homes in Missouri.Shows payroll as a percentage of revenue versus the Missouri average. Well-run SNFs often land around 55–65%. Below 25% may signal understaffing or heavy agency use — read with Staffing ratings.
Other operating costs Info All remaining costs needed to run the home, such as food, utilities, building maintenance, supplies and administrative expenses.
$1.9M
Total costs $3.6M
Walk Score
Walk Score: 28 / 100 Rank #48 / 70Walk Score — state benchmarkedThis home is ranked 48th out of 70 homes in Missouri.Shows how walkable this facility's neighborhood is compared to the average Walk Score across Missouri SNFs. Higher scores benefit residents, families, and staff.
Somewhat walkable. A few nearby services may be reachable on foot, but most trips require transportation.

What does this home offer?

Pets allowed icon
Pets allowed icon

Pets Allowed: Yes, Pets Allowed

Room sizes icon
Room sizes icon

Room Sizes: 206 / 248 sq. ft.

Housing options icon

Housing Options: Private Room / Semi-Private Room

Building type icon
Building type icon

Building Type: Single-story

Transportation services icon

Transportation Services

Fitness and recreation icon

Fitness and Recreation

Types of Care at Heritage Nursing Center

Skilled Nursing Hospice Care

Contact Heritage Nursing Center

Health Inspection History

Inspections
Total health inspections 3

Missouri average 6.6


Last Health inspection on Nov 2024

Total health citations
10 Rank #19 / 255Health citations — state benchmarkedThis home is ranked 19th out of 255 homes in Missouri.Shows this facility's total health deficiency citations benchmarked to the Missouri state average, with a ranking across all 255 MO SNFs. Lower citation counts earn a better rank.

Missouri average 36.5

Citations per inspection
3.33

Missouri average 5.67


Health citations are formal notices following inspections when they fail to comply with safety and care standards.

All 10 citations resulted from standard inspections.

Breakdown of citation severity (last 3 years)
Critical Health citations More info
0
100% better than Missouri average

Missouri average: 0.7


Serious Health citations More info 0
100% better than Missouri average

Missouri average: 1

0 critical citations More info Missouri average: 0.7

0 serious citations More info Missouri average: 1

10 moderate citations More info Missouri average: 33.6

0 minor citations More info Missouri average: 1.2
Citations history (last 3 years)
Infection Control moderate citation Info Issues related to preventing and controlling infections, including hygiene practices and safety protocols. Nov 21, 2024
Corrected

Pharmacy moderate citation Info Issues related to medication management, including how drugs are stored, administered, and monitored. Nov 21, 2024
Corrected

Care Planning moderate citation Info Issues related to creating and updating personalized care plans for residents based on their needs and conditions. Nov 21, 2024
Corrected

Resident Rights moderate citation Info Issues related to resident's rights, including dignity, privacy, and the ability to make decisions about their care. Nov 21, 2024
Corrected

Compare Nursing Homes around Kennett The information below is reported by the Missouri Department of Health and Senior Services, Division of Regulation and Licensure.

1 facility compared · CMS & MO Dept. of Health data · Updated Apr 2026

Filter by care type
Heritage Nursing Center
HC

Home Care Professional care delivered in the person's own home — from companionship and errands to skilled nursing and therapy. Allows seniors to age in place. Medicare covers skilled home health when medically necessary.

NH

Nursing Home Licensed facility providing 24/7 skilled nursing care for residents with complex, ongoing medical needs. Staffed by RNs, LPNs, and CNAs. Inspected and star-rated annually by CMS. Accepts Medicare (short-term rehab) and Medicaid (long-term care).

Kennett66 58.7% -12%3.92 +29%+5%0103.3051- 28 Tolbert, Stephanie$4.2M$1.7M41.4%265531

Financial Assistance for
Nursing Home in Missouri

Get Financial aid guidance

Aged and Disabled Waiver

Missouri Medicaid A&D Waiver

Age 65+ or disabled
General Missouri resident, Medicaid- eligible, nursing home-level care need.
Income Limits (2025) ~$2,829/month 300% FBR, individual
Asset Limits $2,000 (individual), $3,000 (couple).
MO

Rural access prioritized.

Benefits
Personal care (5-7 hours/day) Respite (240 hours/year) Adult day care (~$65/day) Home health services

Missouri Supplemental Nursing Care (SNC)

MO SNC

Age 65+
General Missouri resident, in approved facility.
Income Limits ~$1,215/month individual
Asset Limits $2,000 individual
MO

Supplements SSI; facility-based only.

Benefits
Monthly cash payment (~$156-$292/month) for care costs

Structured Family Caregiving Waiver (SFCW)

Missouri Structured Family Caregiving Waiver

Age 65+
General Missouri resident, MO HealthNet-eligible, NFLOC, dementia diagnosis, live with caregiver.
Income Limits (2025) ~$2,901/month (300% FBR, individual); QIT required.
Asset Limits $5,909.25 (individual), $11,818.45 (couple).
MO

Caregiver must be family; small program size.

Benefits
Cash stipend ($1,000-$1,500/month) to family caregiver Respite Training Supplies ($500/year)

MO HealthNet Aged, Blind, and Disabled (ABD)

Missouri MO HealthNet ABD

Age 65+ or disabled
General Missouri resident, MO HealthNet-eligible, needs help with 1+ ADL.
Income Limits (2025) ~$1,690/month (individual, projected); spenddown allowed.
Asset Limits $5,909.25 (individual), $11,818.45 (couple).
MO

Less intensive than waivers; statewide access.

Benefits
Personal care (2-4 hours/day) Homemaker services Limited respite Medical equipment

Medicare Savings Program (MSP)

Missouri Medicare Savings Program

Age 65+ or disabled
General Missouri resident, Medicare Part A/B.
Income Limits (2025) ~$2,510/month (QMB), ~$3,380/month (SLMB), ~$3,598/month (QI)—individual.
Asset Limits $9,430 (individual), $14,130 (couple).
MO

Three tiers; no waitlist; includes Extra Help for Part D.

Benefits
Covers Part B premiums ($174.70/month) Deductibles ($240/year) Copays (~20%)

Missouri Caregiver Program (Customized Caregiver Training & Relief)

Missouri Caregiver Program

Age
General Caregivers of 60+ with dementia, Missouri resident, functional needs (2+ ADLs).
Income Limits (2025) No strict cap; prioritizes low-income ~$24,980/year individual
Asset Limits Not assessed; need-based.
MO

Administered via AAAs and Alzheimer’s Association; rural focus.

Benefits
Respite (4-6 hours/week) Training Assistive tech ($500/year) Supplies

Senior Community Service Employment Program (SCSEP)

Missouri SCSEP

Age 55+
General unemployed, low-income, Missouri resident.
Income Limits (2025) ~$1,983/month 125% FPL
Asset Limits Not specified; income-focused.
MO

Priority for veterans, rural residents; AARP partnership.

Benefits
Paid training (~20 hours/week at ~$7.25/hour) Job placement

VA Aid and Attendance (A&A) and Housebound Benefits

Missouri VA Aid and Attendance/Housebound

Age 65+ or disabled veteran/spouse
General Missouri resident, wartime service, need for ADL help (A&A) or homebound.
Income Limits (2025) Net income < ~$1,984/month (veteran with dependent, A&A); pension offsets income.
Asset Limits ~$155,356 net worth limit
MO

High veteran demand in rural/urban areas.

Benefits
Cash (~$1,433-$2,642/month veteran, ~$951-$1,318 spouse) for care costs (e.g., in-home, assisted living)

Places of interest near Heritage Nursing Center

Address 1.4 miles from city center Info Estimated distance in miles from Kennett's city center to Heritage Nursing Center's address, calculated via Google Maps.

Calculate Travel Distance to Heritage Nursing Center

Add your location

Address

Staffing Data (Q2 2025)

This data corresponds to Q2 2025 and is based on CMS Payroll-Based Journal.

Total staff 69
Employees 59
Contractors 10
Staff to resident ratio 1.44:1
16% worse than Missouri average

Missouri average ratio: 1.71:1

Avg staff/day 30
Average shift 7.4 hours
9% worse than Missouri average

Missouri average: 8.1 hours

Total staff hours (quarter) 20,272
Nursing staff breakdown
Registered Nurse

Manages medical care and health needs.

Total count 7
Average shift length Info Average shift length. Calculated as total hours divided by days worked and average staff per day. 8.4 hours

No contractors work on this role.

Licensed Practical Nurse

Assists with medical care and medications.

Total count 8
Average shift length Info Average shift length. Calculated as total hours divided by days worked and average staff per day. 9.7 hours

No contractors work on this role.

Certified Nursing Assistant

Helps with daily care and mobility.

Total count 30
Average shift length Info Average shift length. Calculated as total hours divided by days worked and average staff per day. 7.3 hours

No contractors work on this role.

Contractor staffing

Total hours from contractors

6.9%

1,398 contractor hours this quarter

Respiratory Therapy Technician: 2 Physical Therapy Assistant: 2 Physical Therapy Aide: 2 Speech Language Pathologist: 1 Qualified Social Worker: 1 Therapeutic Recreation Specialist: 1 Occupational Therapy Assistant: 1
Staff by category
Certified Nursing Assistant300309,09091100%7.3
Licensed Practical Nurse8082,74891100%9.7
Registered Nurse7072,2699099%8.4
Medication Aide/Technician7072,1509099%8.5
Other Dietary Services Staff3037016066%7
RN Director of Nursing1015046369%8
Nurse Practitioner1014966268%8
Dental Services Staff1014856268%7.8
Speech Language Pathologist0114336774%6.5
Administrator1014325459%8
Physical Therapy Aide0224236369%6.6
Respiratory Therapy Technician0222626167%4.3
Physical Therapy Assistant0222355459%4.4
Qualified Social Worker011203134%0.6
Occupational Therapy Assistant0112033%6.6
Therapeutic Recreation Specialist011567%0.9
30 Certified Nursing Assistant
% of Days 100%
8 Licensed Practical Nurse
% of Days 100%
7 Registered Nurse
% of Days 99%
7 Medication Aide/Technician
% of Days 99%
3 Other Dietary Services Staff
% of Days 66%
1 RN Director of Nursing
% of Days 69%
1 Nurse Practitioner
% of Days 68%
1 Dental Services Staff
% of Days 68%
1 Speech Language Pathologist
% of Days 74%
1 Administrator
% of Days 59%
2 Physical Therapy Aide
% of Days 69%
2 Respiratory Therapy Technician
% of Days 67%
2 Physical Therapy Assistant
% of Days 59%
1 Qualified Social Worker
% of Days 34%
1 Occupational Therapy Assistant
% of Days 3%
1 Therapeutic Recreation Specialist
% of Days 7%

Facility Characteristics

Source: CMS Long-Term Care Facility Characteristics (Data as of Jan 2026)

Total residents 48
Medicare
10
20.8% of residents
Medicaid
31
64.6% of residents
Private pay or other
7
14.6% of residents
Programs & Services
Residents Group

Residents meet regularly to discuss policies, care quality, and activities

Nurse Aide Training

State-approved Nurse Aide Training and Competency Evaluation Program on-site

Active Resident Council

Organized group of residents that meets regularly to discuss facility policies, quality of life, and activities.

Quality of care over time

These measures show how residents usually do over time at this home, based on health outcomes and preventive care.

High-risk clinical events score Info A composite score based on pressure ulcers, falls with injury, weight loss, walking ability decline, and activities of daily living decline. 10.9
In line with Missouri average

Missouri average: 10.9

Functional decline score Info A composite score based on activities of daily living decline, walking ability decline, and incontinence. 16.1
17% better than Missouri average

Missouri average: 19.5

Long-stay resident measures
Significantly below average Missouri avg: 2.7 Info CMS star rating based on long-stay quality measure performance. 5 stars = significantly above average, 1 star = significantly below average.
Need for Help with Daily Activities Increased Info Percent of long-stay residents whose need for help with daily activities has increased 17.7%
10% better than Missouri average

Missouri average: 19.8%

Walking Ability Worsened Info Percent of long-stay residents whose ability to move independently worsened 13.6%
34% better than Missouri average

Missouri average: 20.6%

Low Risk Residents with Bowel/Bladder Incontinence Info Percent of low risk long-stay residents who lose control of their bowels or bladder 17.1%
6% better than Missouri average

Missouri average: 18.1%

Falls with Major Injury Info Percent of long-stay residents experiencing one or more falls with major injury 8.6%
112% worse than Missouri average

Missouri average: 4.0%

High Risk Residents with Pressure Ulcers Info Percent of long-stay high risk residents with pressure ulcers 6.0%
20% worse than Missouri average

Missouri average: 5.0%

Urinary Tract Infection Info Percent of long-stay residents with a urinary tract infection 2.9%
7% worse than Missouri average

Missouri average: 2.7%

Lost Too Much Weight Info Percent of long-stay residents who lose too much weight 8.7%
56% worse than Missouri average

Missouri average: 5.6%

Depressive Symptoms Info Percent of long-stay residents who have depressive symptoms 0.0%
100% better than Missouri average

Missouri average: 12.8%

Antipsychotic Use Info Percent of long-stay residents who received an antipsychotic medication 29.8%
35% worse than Missouri average

Missouri average: 22.0%

Pneumococcal Vaccine Info Percent of long-stay residents assessed and appropriately given the pneumococcal vaccine 100.0%
17% better than Missouri average

Missouri average: 85.2%

Influenza Vaccine Info Percent of long-stay residents assessed and appropriately given the seasonal influenza vaccine 97.7%
8% better than Missouri average

Missouri average: 90.9%

Hospitalizations per 1,000 days Info Number of hospitalizations per 1,000 long-stay resident days. 3.30
59% worse than Missouri average

Missouri average: 2.08

ED visits per 1,000 days Info Number of outpatient emergency department visits per 1,000 long-stay resident days. 4.68
99% worse than Missouri average

Missouri average: 2.35

Short-stay resident measures
Average Missouri avg: 2.1 Info CMS star rating based on short-stay quality measure performance. 5 stars = much above average, 1 star = much below average.
Pneumococcal Vaccine Info Percent of short-stay residents assessed and appropriately given the pneumococcal vaccine 91.5%
37% better than Missouri average

Missouri average: 66.6%

Antipsychotic medication increase Info Percent of short-stay residents who newly received an antipsychotic medication 2.4%
9% worse than Missouri average

Missouri average: 2.2%

Influenza Vaccine Info Percent of short-stay residents assessed and appropriately given the seasonal influenza vaccine 86.5%
36% better than Missouri average

Missouri average: 63.5%

Re-hospitalized after SNF stay Info Percentage of short-stay residents who were re-hospitalized after their nursing home admission. 19.5%
23% better than Missouri average

Missouri average: 25.3%

Emergency department visits Info Percentage of short-stay residents who had an outpatient emergency department visit. 10.7%
20% better than Missouri average

Missouri average: 13.4%

Falls with major injury Info Percentage of SNF residents who experience falls with major injury during their stay. 1.3%
71% worse than Missouri average

Missouri average: 0.8%

Ability to care for self at discharge Info Percentage of residents at or above expected ability to care for themselves at discharge. 55.6%
In line with Missouri average

Missouri average: 53.7%

Successful return to home or community Info Rate of successful return to home or community from a skilled nursing facility. 45.5%
10% worse than Missouri average

Missouri average: 50.6%

Guides for Better Senior Living

Care Cost Calculator: See Prices in Your Area

Nursing Home Data Explorer

Don’t Wait Too Long: 7 Red Flag Signs Your Parent Needs Assisted Living Now

The True Cost of Assisted Living in 2025 – And How Families Are Paying For It

Understanding Senior Living Costs: Pricing Models, Discounts & Financial Assistance

Tour Icon
Planning a tour? Check our touring checklist.
Chat Icon
Thinking of living here? We can help you speak to a current resident
Explore Open Rooms
1 Contact details
2 What type of senior care service are you looking for?
3 What budget do you have in mind for senior care?
4 How soon do you need to find care?
5 Additional details

Thank you for your interest!

Our team will be in touch shortly to help with next steps.