The Heights Rehabilitation and Healthcare Center

Nursing Home

The Heights Rehabilitation and Healthcare Center

2801 E Royalton Rd, Broadview Heights, OH 44147 View Map
Nursing Home
icon
Care Cost Calculator: See Prices in Your Area Care Cost Calculator: See Prices in Your Area icon
Overview of The Heights Rehabilitation and Healthcare Center

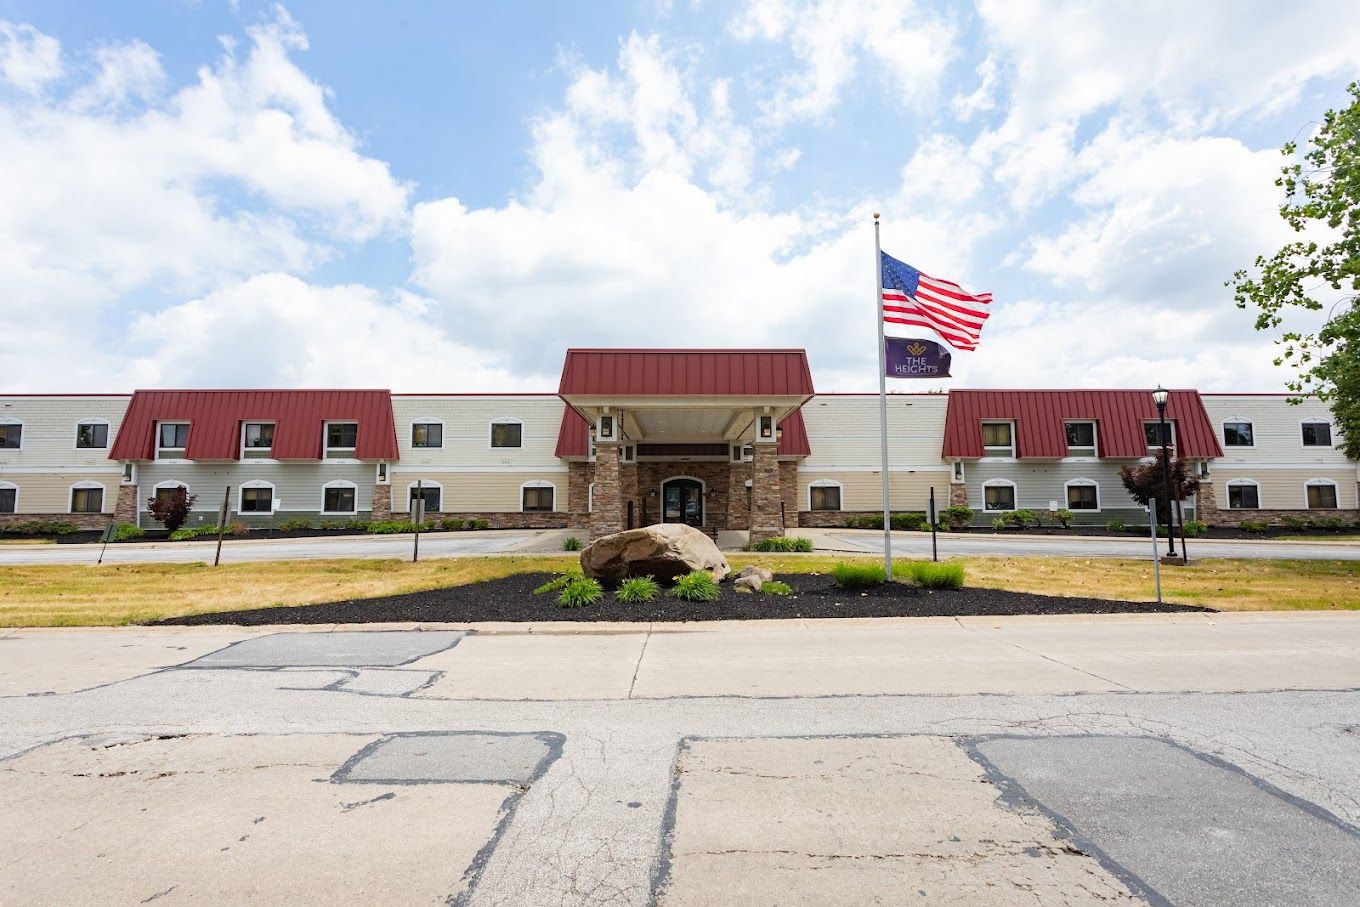
Find the care you need with the distinguished senior living community of The Heights Rehabilitation and Healthcare Center in East Royalton Road, Broadview Heights, OH, providing a variety of care options including memory care, long-term care, subacute rehab, and respite care. The community also provides a dialysis unit for seniors who require it, alongside physical, occupational, and speech therapy. With its commitment to improving seniors’ well-being, the community delivers top-notch care and assistance 24/7.

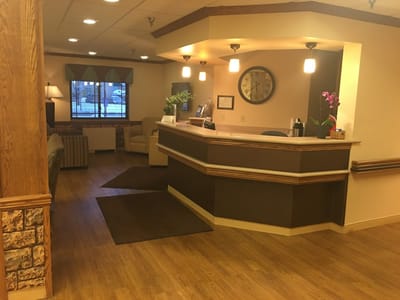
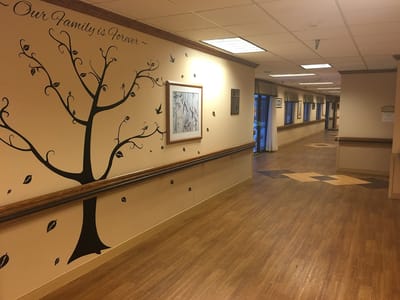
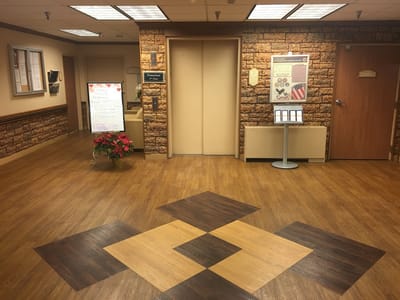
Thrive and celebrate moments through fun events and enriching programs. There are also a variety of specially designed amenities all over the community for residents to enjoy their free time and mingle with friends. The Heights Rehabilitation and Healthcare Center is a safe place for seniors to receive the utmost care and assistance they deserve.

(440) 526-4770

Quality ratings

Measured by Centers for Medicare & Medicaid Services (CMS)

Overall rating Info Official CMS rating based on health inspections, staffing and quality measures.
2/5
Ohio average: 3.2/5
Health Inspection Info Official CMS rating based on deficiencies found during state health inspections.
2/5
Ohio average: 2.8/5
Staffing Info Official CMS rating based on nurse staffing hours per resident per day.
1/5
Ohio average: 2.4/5
Quality Measures Info Official CMS rating based on clinical outcomes for residents.
5/5
Ohio average: 4.4/5

Nursing care per resident

Info Average daily nursing hours per resident (adjusted for acuity). Higher values indicate more nursing time per resident.
2h 43m per day

This home provides 23% less nursing time per resident than the state average.

Ohio average: 3h 32m per day

Staffing hours breakdown

Info Hours of care per resident per day, broken down by staff type. Data from CMS Medicare.
Staff type Facility State avg National avg
Registered Nurse (RN) Info Registered nurse hours per resident per day. 47m per day 38m per day 41m per day
LPN / LVN Info Licensed Practical Nurse / Licensed Vocational Nurse hours per resident per day. 43m per day 58m per day 52m per day
Nurse Aide Info Nurse aide hours per resident per day. 1h 52m per day 2h 8m per day 2h 21m per day
Total Nursing (Weekend) Info Total number of nurse staff hours per resident per day on weekends. 3h 11m per day 3h 17m per day 3h 26m per day
Physical Therapist Info Physical therapist staff hours per resident per day. 2m per day 3m per day 4m per day
RN (Weekend) Info Registered nurse hours per resident per day on weekends. 51m per day 25m per day 29m per day

Capacity and availability

Medium-capacity home

Offers a balance of services and community atmosphere.

Total beds 149

This home usually has availability

Lower occupancy suggests more openings may be available.

Lower demand than the Ohio average
Occupancy rate 72.4%
Residents per day (avg) 110
Occupancy rate
72.4%
Residents per day (avg)
110

Who this home usually serves

TYPE OF STAY

Mostly long-term care residents

Most residents stay for extended periods and receive ongoing daily care.

Might be optimal for
Long-term daily care Ongoing support needs

Breakdown by payment type

Medicare

12% of new residents, usually for short-term rehab.

Typical stay 1 - 2 months

Private pay

34% of new residents, often for short stays.

Typical stay 1 - 2 months

Medicaid

54% of new residents, often for long-term daily care.

Typical stay 6 - 7 months

Finances and operations

Proprietary home
Other
Home revenue
$16.1M
Profit
$307.0K
Proprietary home Other
Home revenue
$16,063,917.00
Profit
$307,012.00
Payroll costs Info The portion of the home's budget spent on staff, including nurses, caregivers, and other employees who support care and operations.
$5.9M
37% of revenue
Other operating costs Info All remaining costs needed to run the home, such as food, utilities, building maintenance, supplies and administrative expenses.
$9.8M
Total costs $15.8M

What does this home offer?

Accepts Medicaid icon

Accept Medicaid: Yes

Total residents icon

Total Residents: 149

Building type icon
Building type icon

Building Type: Two-story

Types of Care at The Heights Rehabilitation and Healthcare Center

Nursing Home
Contact The Heights Rehabilitation and Healthcare Center

Compare Nursing Homes around Broadview Heights

The information below is reported by the Ohio Department of Health, Bureau of Survey and Certification.
The Heights Rehabilitation and Healthcare Center
AL

Assisted Living For seniors needing help with daily tasks but not full-time nursing.

IL

Independent Living For self-sufficient seniors seeking community and minimal assistance.

MC

Memory Care Specialized care for those with Memory Loss, Alzheimer's, or dementia, ensuring safety and support.

SNF

Nursing Homes 24/7 care needed

Broadview Heights
159
No
29
72.4%
$15,424,058.00
$5,940,554.00
38.5%
109.70
2/5
2.7098
2/5
1/5
5/5
3
35
2
+97%
-23%
-8%

Places of interest near The Heights Rehabilitation and Healthcare Center

Address 1.0 miles from city center

Address 2801 E Royalton Rd, Broadview Heights, OH 44147

Calculate Travel Distance to The Heights Rehabilitation and Healthcare Center

Add your location

Address

Staffing Data

Source: CMS Payroll-Based Journal (Q2 2025)

177
Total Staff
163
Employees
14
Contractors
37,991
Total Hours (Quarter)
57
Avg Staff/Day
7.3
Avg Shift (hrs)
Nursing Staff Breakdown
Role Count Avg Shift (hrs) Uses Contractors?
Registered Nurse328.8 No
Licensed Practical Nurse268.3 No
Certified Nursing Assistant906.6 No
Staff by Category
Administration
1 staff
8hs shift avg
Nursing Staff
154 staff
7.4hs shift avg
Physicians & Practitioners
3 staff
8hs shift avg
Therapy Services
12 staff
5.8hs shift avg
Activities & Recreation
0 staff
0hs shift avg
Social Services
2 staff
4.3hs shift avg
Dietary Services
4 staff
7.1hs shift avg
Other Services
1 staff
8hs shift avg
Contractor Analysis
4.8%
of total hours from contractors
1,808 contractor hours this quarter
Respiratory Therapy Technician: 3 Qualified Social Worker: 2 Physical Therapy Aide: 3 Speech Language Pathologist: 2 Physical Therapy Assistant: 4
Role Employees Contractors Total Staff Total Hours Days Worked % of Days Avg Shift (hrs)
Certified Nursing Assistant9009017,39391100%6.6
Licensed Practical Nurse260266,55791100%8.3
Registered Nurse320325,79391100%8.8
RN Director of Nursing4041,7088088%8.6
Other Dietary Services Staff3031,1978998%6.8
Medication Aide/Technician2029267886%8.1
Clinical Nurse Specialist2026166470%8
Physical Therapy Aide0335257077%6.4
Respiratory Therapy Technician0335207279%6.1
Dietitian1015126470%8
Mental Health Service Worker1015126470%8
Administrator1014966268%8
Nurse Practitioner1014725965%8
Physical Therapy Assistant0443386167%5.1
Qualified Social Worker0222736369%4.3
Speech Language Pathologist0221523033%4.5

Health Inspection History

Inspections
Total health inspections 12

Ohio average 6.7


Last Health inspection on Nov 2025

Total health citations 35
Citations per inspection
2.92

Health citations are formal notices following inspections when they fail to comply with safety and care standards.

20 of 35 citations resulted from standard inspections; and 15 of 35 resulted from complaint investigations.

Breakdown of citation severity (last 3 years)
Critical Health citations More info 1
233% worse than Ohio average

Ohio average: 0.3


Serious Health citations More info 1
11% worse than Ohio average

Ohio average: 0.9

1 critical citation More info Ohio average: 0.3

1 serious citation More info Ohio average: 0.9

29 moderate citations More info Ohio average: 29

4 minor citations More info Ohio average: 0.7
Citations history (last 3 years)
Abuse/Neglect moderate citation Nov 17, 2025
Corrected

Quality of Care moderate citation Nov 17, 2025
Corrected

Care Planning moderate citation Aug 12, 2025
Corrected

Environmental moderate citation Jun 26, 2025
Corrected

Facility Characteristics

Source: CMS Long-Term Care Facility Characteristics (Data as of Jan 2026)

Ownership: For-Profit Corporation
Resident Census by Payment Source
116 Total Residents
Medicare 4 (3.4%)
Medicaid 85 (73.3%)
Private Pay/Other 27 (23.3%)
Specialized Care Beds
28 Total Specialty Beds
17.6% of Bed Capacity
28
Alzheimer's / Dementia Beds
17.6%
Programs & Services
Residents' Group
Family Member Group
Family Engagement

Active councils help families stay involved in care decisions and facility operations.

Quality of care over time

These measures show how residents usually do over time at this home, based on health outcomes and preventive care.

High-risk clinical events score Info A composite score based on pressure ulcers, falls with injury, weight loss, walking ability decline, and activities of daily living decline. 2.8
53% better than Ohio average

Ohio average: 5.8

Functional decline score Info A composite score based on activities of daily living decline, walking ability decline, and incontinence. 12.4
In line with Ohio average

Ohio average: 12.7

Long-stay resident measures
Need for Help with Daily Activities Increased Info Percent of long-stay residents whose need for help with daily activities has increased 0.9%
87% better than Ohio average

Ohio average: 6.8%

Walking Ability Worsened Info Percent of long-stay residents whose ability to move independently worsened 1.7%
81% better than Ohio average

Ohio average: 8.9%

Low Risk Residents with Bowel/Bladder Incontinence Info Percent of low risk long-stay residents who lose control of their bowels or bladder 34.7%
58% worse than Ohio average

Ohio average: 22.0%

Falls with Major Injury Info Percent of long-stay residents experiencing one or more falls with major injury 2.9%
16% better than Ohio average

Ohio average: 3.4%

High Risk Residents with Pressure Ulcers Info Percent of long-stay high risk residents with pressure ulcers 4.4%
12% worse than Ohio average

Ohio average: 3.9%

Urinary Tract Infection Info Percent of long-stay residents with a urinary tract infection 0.0%
100% better than Ohio average

Ohio average: 0.5%

Lost Too Much Weight Info Percent of long-stay residents who lose too much weight 4.0%
36% better than Ohio average

Ohio average: 6.2%

Depressive Symptoms Info Percent of long-stay residents who have depressive symptoms 92.5%
285% worse than Ohio average

Ohio average: 24.0%

Antipsychotic Use Info Percent of long-stay residents who received an antipsychotic medication 1.3%
85% better than Ohio average

Ohio average: 8.4%

Pneumococcal Vaccine Info Percent of long-stay residents assessed and appropriately given the pneumococcal vaccine 99.8%
8% better than Ohio average

Ohio average: 92.4%

Influenza Vaccine Info Percent of long-stay residents assessed and appropriately given the seasonal influenza vaccine 99.2%
5% better than Ohio average

Ohio average: 94.5%

Short-stay resident measures
Pneumococcal Vaccine Info Percent of short-stay residents assessed and appropriately given the pneumococcal vaccine 97.3%
25% better than Ohio average

Ohio average: 78.0%

Antipsychotic medication increase Info Percent of short-stay residents who newly received an antipsychotic medication 2.5%
98% worse than Ohio average

Ohio average: 1.3%

Influenza Vaccine Info Percent of short-stay residents assessed and appropriately given the seasonal influenza vaccine 95.5%
26% better than Ohio average

Ohio average: 75.6%

Re-hospitalized after SNF stay Info Percentage of short-stay residents who were re-hospitalized after their nursing home admission. 20.1%
20% better than Ohio average

Ohio average: 25.1%

Emergency department visits Info Percentage of short-stay residents who had an outpatient emergency department visit. 16.4%
31% worse than Ohio average

Ohio average: 12.5%

Falls with major injury Info Percentage of SNF residents who experience falls with major injury during their stay. 2.2%
182% worse than Ohio average

Ohio average: 0.8%

Ability to care for self at discharge Info Percentage of residents at or above expected ability to care for themselves at discharge. 60.0%
12% better than Ohio average

Ohio average: 53.7%

Successful return to home or community Info Rate of successful return to home or community from a skilled nursing facility. 49.6%
In line with Ohio average

Ohio average: 50.6%

Penalties and fines

Federal penalties imposed by CMS for regulatory violations, including civil money penalties (fines) and denials of payment for new Medicare/Medicaid admissions.

Source: CMS Penalties Database (Data as of Jan 2026)

Total fines amount $218K
216% higher than Ohio average

Ohio average: $69K

Number of fines 2
8% more fines than Ohio average

Ohio average: 1.9

Payment Denials Info Serious action where Medicare and/or Medicaid temporarily stops payments for new residents until issues are fixed. 0
100% fewer payment denials than Ohio average

Ohio average: 0.5

Fines amount comparison
This facility $218K
Ohio average $69K
Penalty History

Penalties are imposed by CMS for violations of federal nursing home regulations.

Civil Money Penalty Info Fines imposed for noncompliance, which can be assessed per day or per instance of violation. Sep 14, 2023
$183K
Civil Money Penalty Info Fines imposed for noncompliance, which can be assessed per day or per instance of violation. Mar 7, 2023
$34K

Last updated: Jan 2026

Guides for Better Senior Living

Care Cost Calculator: See Prices in Your Area

Nursing Home Data Explorer

Don’t Wait Too Long: 7 Red Flag Signs Your Parent Needs Assisted Living Now

The True Cost of Assisted Living in 2025 – And How Families Are Paying For It

Understanding Senior Living Costs: Pricing Models, Discounts & Financial Assistance

Financial Aid for Ohio Seniors

Get financial aid guidance

PASSPORT Waiver

Ohio Medicaid PASSPORT

Age 60+, Ohio resident, Medicaid-eligible, nursing home-level care need.

~$2,829/month (300% FBR, individual).

$2,000 (individual), $3,000 (couple).

Administered through regional agencies; waitlists possible.

Ohio Home Care Program (non-Medicaid)

OH HCP

Age 60+, Ohio resident, at risk of decline.

~$2,000/month (individual, varies).

$5,000 (individual).

Limited funding; regional variation.

Assisted Living Waiver (ALW)

Ohio Assisted Living Waiver

Age 21+ (65+ prioritized), OH resident, Medicaid-eligible, NFLOC.

~$2,829/month (individual); QIT required.

$2,000 (individual), $3,000 (couple).

Covers ~300 facilities; room/board not included (separate cost).

Program of All-Inclusive Care for the Elderly (PACE)

Ohio PACE (e.g., McGregor PACE)

Age 55+, OH resident (specific counties), NFLOC, safe with PACE support.

~$2,829/month (Medicaid-eligible); private pay option available.

$2,000 (individual), $3,000 (couple) for Medicaid enrollees.

Available in 9 counties (e.g., Cuyahoga, Franklin); expanding via Healthy Aging Grants.

Medicare Savings Program (MSP)

Ohio Medicare Savings Program

Age 65+ or disabled, OH resident, Medicare Part A/B.

~$2,510/month (QMB), ~$3,380/month (SLMB), ~$3,598/month (QI)—individual.

$9,430 (individual), $14,130 (couple).

Three tiers; includes Extra Help for Part D; no waitlist.

Home Energy Assistance Program (HEAP)

Ohio HEAP

Age 60+ prioritized, OH resident, low-income household.

~$3,970/month (individual, 185% FPL).

Not assessed; income-focused.

Covers gas, electric, oil; emergency aid via Winter/Summer Crisis Programs.

Family Caregiver Support Program (FCSP)

Ohio Family Caregiver Support Program

Caregivers of 60+ needing care or 55+ caregivers of others; OH resident; functional needs (2+ ADLs).

Prioritizes ~$24,980/year (individual); no strict cap.

Not assessed; need-based.

12 AAAs; rural/low-income priority; volunteer respite option.

Senior Community Service Employment Program (SCSEP)

Ohio SCSEP

Age 55+, unemployed, low-income, OH resident.

~$1,983/month (125% FPL).

Not specified; income-focused.

Priority for veterans, rural residents; AARP partnership.

VA Aid and Attendance (A&A) and Housebound Benefits

Ohio VA Aid and Attendance/Housebound

Age 65+ or disabled veteran/spouse, OH resident, wartime service, need for ADL help (A&A) or homebound.

Net income < ~$1,984/month (veteran with dependent, A&A); pension offsets income.

~$155,356 (net worth limit).

High veteran demand; supports care in multiple settings.

Homestead Exemption

Ohio Homestead Exemption

Age 65+ (or disabled), OH resident, homeowner, low-income.

~$38,500/year (individual, adjusted annually).

Not assessed; home ownership required.

Reduces taxable value by $25,000; applies to primary residence.

Save the Dream Ohio (Homeowner Assistance Fund)

Ohio Save the Dream

Age 60+ prioritized, OH resident, homeowner, hardship post-Jan 21, 2020.

~$147,600/year (family of 4, 150% AMI; varies by county).

Not assessed; hardship-focused.

Covers delinquent mortgages, utilities, taxes; max $25,000 mortgage aid.

Who we are

Your Senior Care Partner, Every Step of the Way

We help families find affordable senior communities and unlock same day discounts, Medicaid, and Medicare options tailored to your needs.

Contact us Today