Tallmadge Health and Rehab
Nursing Home & Assisted Living · Tallmadge, OH
CMS overall rating Info The Overall CMS Rating is scored from 1 to 5 stars and combines results from health inspections, staffing levels, and quality measures. Health inspections carry the most weight. Staffing and quality scores can increase or decrease the final rating based on performance compared to state and national standards.

Tallmadge Health and Rehab

Nursing Home & Assisted Living · Tallmadge, OH
CMS overall rating Info The Overall CMS Rating is scored from 1 to 5 stars and combines results from health inspections, staffing levels, and quality measures. Health inspections carry the most weight. Staffing and quality scores can increase or decrease the final rating based on performance compared to state and national standards.
Calculator: See prices in your area
Tallmadge Health and Rehab accepts Medicare, Medicaid, and private pay.

Overview of Tallmadge Health and Rehab

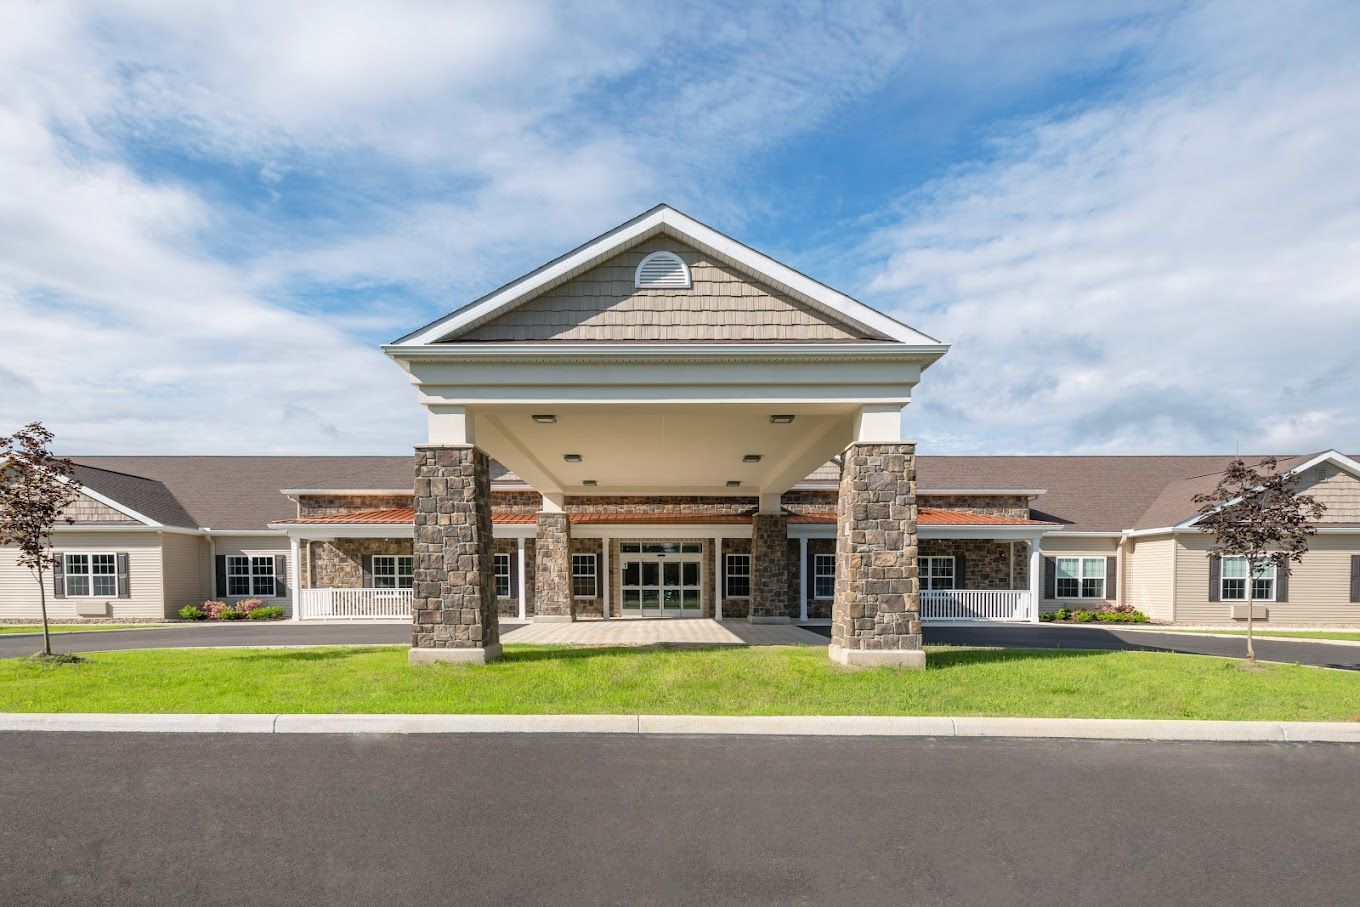
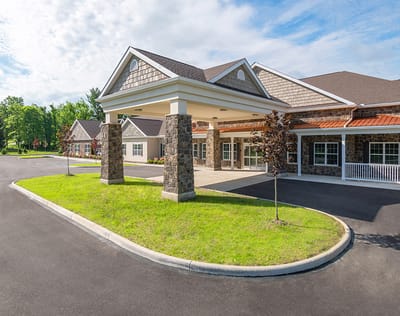
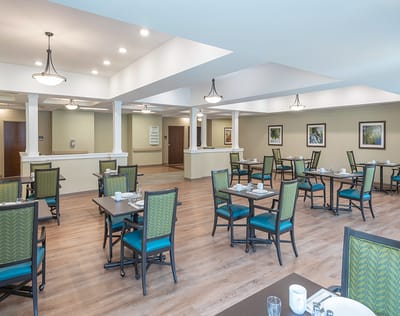
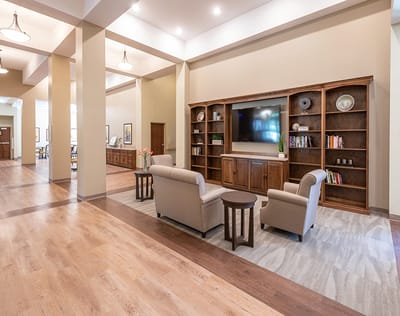
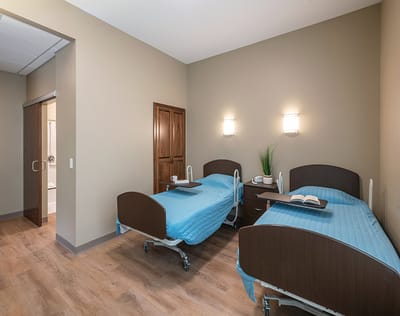
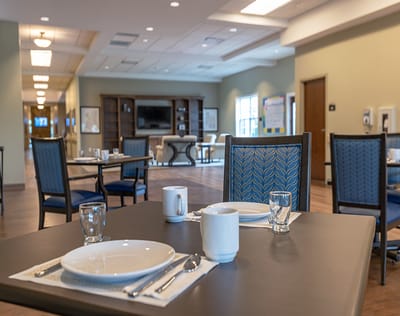
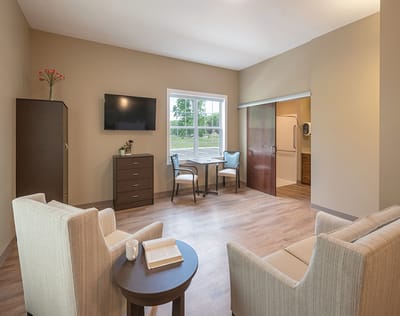
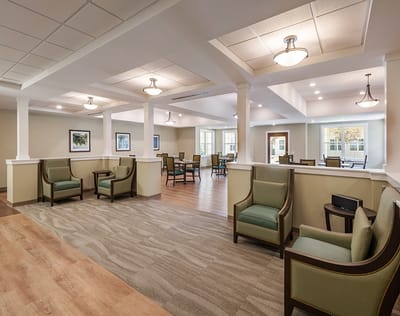
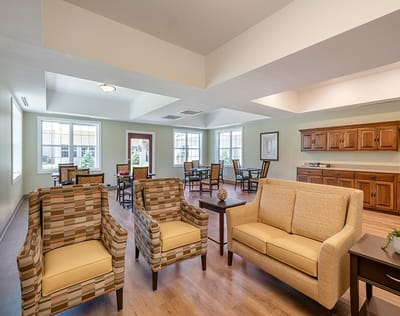
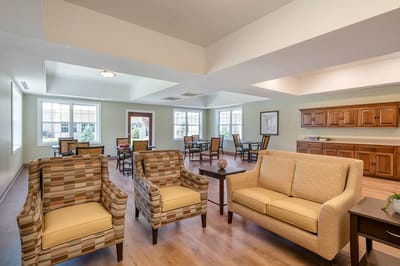
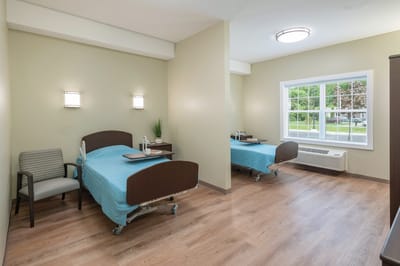
Tallmadge Health and Rehab is a senior rehabilitation center located in the charming city of Tallmadge, OH, close to Tallmadge Circle and Six Corners’ restaurants, parks, and shopping. Established in 2021, this 90-bed facility offers compassionate care with a focus on specialized senior rehabilitation, skilled nursing, assisted living, personal care, and long-term care services. Here, residents can enjoy private and semi-private room choices, each thoughtfully designed to support safety and comfort.

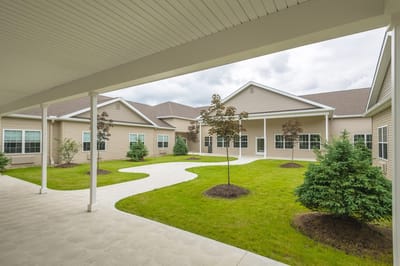
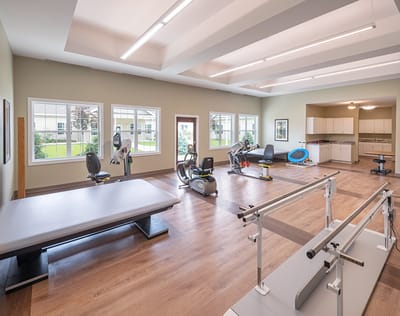
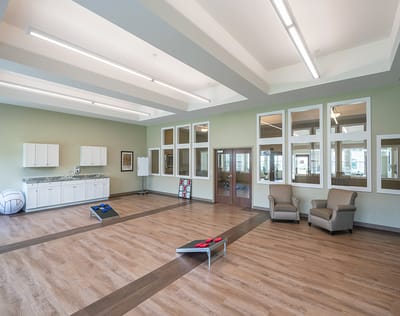
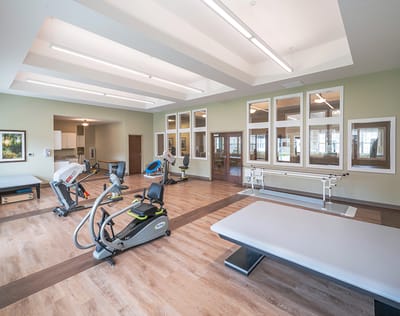
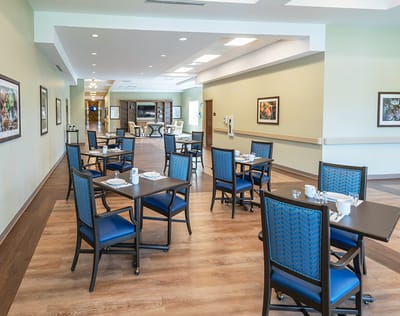
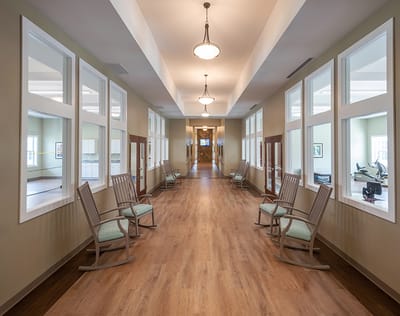
The Tallmadge team is dedicated to holistic resident well-being, providing 24-hour skilled nursing and specialty rehabilitation services, including physical, occupational, and speech therapy. Residents can savor the beautiful outdoor patios or unwind in community activity spaces, engaging in diverse recreational and therapeutic options. With a mission centered on achieving positive outcomes, Tallmadge Health and Rehab creates a supportive environment where residents feel truly at home.

(234) 274-1888

Quality ratings

Measured by Centers for Medicare & Medicaid Services (CMS)

Overall rating Info The Overall CMS Rating combines results from health inspections, staffing levels and quality measures. Health inspections carry the most weight. Staffing and quality scores can increase or decrease the final rating based on performance compared to state and national standards.
▼ 5.7% Below OH avg. ▼ 5.7% Below OH avg.Click the badge to see the full State ranking.Click here to see the full State ranking.
Health Inspection Info Based on the results of the facility's three most recent standard inspections and any complaint investigations. CMS reviews the number, scope, and severity of deficiencies, with more recent findings weighted more heavily.
▼ 28.6% Below OH avg. ▼ 28.6% Below OH avg.Click the badge to see the full State ranking.Click here to see the full State ranking.
Staffing Info Measures average nursing staff hours per resident per day, including Registered Nurses (RNs) and total nursing staff. Ratings are adjusted based on the level of care residents require and are compared to state and national benchmarks.
▼ 18.1% Below OH avg. ▼ 18.1% Below OH avg.Click the badge to see the full State ranking.Click here to see the full State ranking.
Quality Measures Info Based on clinical and physical health indicators reported to CMS, such as hospital readmissions, falls, pressure ulcers, and improvements in mobility. These measures reflect how well residents' health needs are being managed.
▲ 14.7% Above OH avg. ▲ 14.7% Above OH avg.Click the badge to see the full State ranking.Click here to see the full State ranking.

Staffing hours breakdown

Info Daily nursing hours per resident by staff type, reported to CMS. Higher is generally better — compare this facility to state and national averages to see where staffing stands.

Hours per resident per day — compared to Ohio state averages

Total nursing care / resident Info This home is ranked 128th out of 203 homes in Ohio. Total adjusted nursing hours per resident per day, combining RN, LPN, and aide time. CMS adjusts this for case-mix so facilities can be fairly compared.
3h 21m per day
Rank #128 / 203Nurse hours — State benchmarkedThis home is ranked 128th out of 203 homes in Ohio. Shows adjusted nurse hours per resident per day benchmarked to the Ohio average, with a ranking across 203 Ohio SNFs. More hours mean more direct care. The national average is about 3.5 hrs; below 3.0 is a red flag.Click the rank badge to see the full State ranking.Click here to see the full State ranking.
This facility Ohio avg (3h 32m per day)
vs Ohio avg
-6%

1 of 6 metrics below state avg

Standout metric Physical Therapist is +100% above state avg
Staff typeHours / Day / Residentvs state avg
Registered Nurse (RN) Info RNs hold the highest nursing license and can assess residents, interpret test results, and direct care plans. More RN hours per day often signals stronger clinical oversight and faster response to health changes. 44m per day ▲ 16% State avg: 38m per day · National avg: 41m per day
LPN / LVN Info Licensed Practical Nurses (LPNs) or Licensed Vocational Nurses (LVNs) deliver routine hands-on care — medication administration, wound dressing, and monitoring vital signs. They work under RN supervision and make up a large share of daily bedside care. 58m per day ■ Avg State avg: 58m per day · National avg: 52m per day
Nurse Aide Info Certified Nurse Aides (CNAs) provide the most direct day-to-day assistance: bathing, dressing, feeding, and mobility. Nurse aide hours are typically the largest staffing category and directly affect residents' quality of life. 2h 12m per day ▲ 3% State avg: 2h 8m per day · National avg: 2h 21m per day
Weekend Total Nursing Info Combined nursing hours (RN + LPN + Nurse Aide) per resident per day on weekends. Staffing often drops on weekends — this figure reveals whether the facility maintains adequate coverage outside of weekday hours. 3h 23m per day ▲ 3% State avg: 3h 17m per day · National avg: 3h 26m per day
Physical Therapist Info Hours per resident per day provided by licensed Physical Therapists (PTs) or PT Assistants. PT services help residents recover mobility after injury or illness and are especially important for post-acute (short-stay) rehabilitation. 6m per day ▲ 100% State avg: 3m per day · National avg: 4m per day
Weekend RN Info Registered nurse hours specifically on weekends. Facilities sometimes reduce RN presence on Saturdays and Sundays — a low weekend RN figure compared to weekday hours can indicate reduced clinical oversight when most administrative staff are absent. 23m per day ▼ 8% State avg: 25m per day · National avg: 29m per day

Types of Care at Tallmadge Health and Rehab

Nursing Home Assisted Living

Capacity and availability

This home usually has limited availability

Occupancy between 85% and 95% suggests balanced demand.

Higher occupancy than the Ohio average: 78.7%
Occupancy rate 88.5% Rank #59 / 204Occupancy rate — State benchmarkedThis home is ranked 59th out of 204 homes in Ohio. Shows this facility's occupancy rate versus the Ohio average, with its Statewide rank out of 204. Higher occupancy signals strong local demand and financial stability.Click the rank badge to see the full State ranking.Click here to see the full State ranking.
Avg. Length of Stay 60 days
Occupancy rate
88.5% Rank #59 / 204Occupancy rate — State benchmarkedThis home is ranked 59th out of 204 homes in Ohio. Shows this facility's occupancy rate versus the Ohio average, with its Statewide rank out of 204. Higher occupancy signals strong local demand and financial stability.Click the rank badge to see the full State ranking.Click here to see the full State ranking.
Avg. Length of Stay
60 days
Walk Score
Walk Score: 22 / 100 Rank #527 / 706Walk Score — State benchmarkedThis home is ranked 527th out of 706 homes in Ohio. Shows how walkable this facility's neighborhood is compared to the average Walk Score across Ohio SNFs. Higher scores benefit residents, families, and staff.Click the rank badge to see the full State ranking.Click here to see the full State ranking.
Car-dependent. Most errands require a car, with limited nearby walkable options.

About this community

Therapy & Rehabilitation

3 services
Rehabilitation Services
Respite Care
Short-Term Rehab

Staffing & Medical

1 service
24-Hour Staffing

Additional Services

3 services
Personal Care
Dialysis Care
Vent Management

Amenities & Lifestyle

Physical Therapy
Occupational Therapy
Speech Therapy
24-Hour Skilled Nursing Care

Contact Tallmadge Health and Rehab

Staffing Data

Reporting period: October 1 – December 31, 2025 (Q4 2025). Source: CMS Payroll-Based Journal report.

Total staff 162
Employees 112
Contractors 50
Staff to resident ratio 1.84:1
10% worse than Ohio average
Ohio average ratio: 2.04:1 Ohio average ratio: 2.04:1See full Ohio ranking
Avg staff/day 48
Average shift 8.4 hours
0% compared with Ohio average
Ohio average: 8.1 hours Ohio average shift: 8.1 hoursSee full Ohio ranking
Total staff hours (quarter) 36,878

Nursing staff breakdown

Q4 2025 · Oct 1 – Dec 31 More info This data comes from the CMS Payroll-Based Journal report covering October 1 – December 31, 2025.
Registered Nurse

Manages medical care and health needs.

RN Staff 19
Average shift length Info Average shift length. Calculated as total hours divided by days worked and average staff per day. 9.5 hours

This role is partially covered by contractors.

Licensed Practical Nurse

Assists with medical care and medications.

LPN Staff 34
Average shift length Info Average shift length. Calculated as total hours divided by days worked and average staff per day. 8.9 hours

This role is partially covered by contractors.

Certified Nursing Assistant

Helps with daily care and mobility.

CNA Staff 50
Average shift length Info Average shift length. Calculated as total hours divided by days worked and average staff per day. 8.5 hours

This role is partially covered by contractors.

Contractor staffing

Q4 2025 · Oct 1 – Dec 31 More info This data comes from the CMS Payroll-Based Journal report covering October 1 – December 31, 2025.

Total hours from contractors

10.2%

3,768 contractor hours this quarter

Registered Nurse: 12 Licensed Practical Nurse: 8 Occupational Therapy Assistant: 7 Clinical Nurse Specialist: 6 Respiratory Therapy Technician: 4 Physical Therapy Assistant: 3 Certified Nursing Assistant: 2 Speech Language Pathologist: 2 Qualified Social Worker: 1 RN Director of Nursing: 1 Nurse Practitioner: 1 Physical Therapy Aide: 1 Occupational Therapy Aide: 1 Medical Director: 1

Staff by category

Q4 2025 · Oct 1 – Dec 31 More info This data comes from the CMS Payroll-Based Journal report covering October 1 – December 31, 2025.
Certified Nursing Assistant4825015,61592100%8.5
Licensed Practical Nurse268347,87892100%8.9
Registered Nurse712193,08692100%9.5
Qualified Activities Professional120122,30792100%8.5
Clinical Nurse Specialist46101,8217480%8
Dental Services Staff2029466773%7.9
Other Dietary Services Staff5056338592%6.6
RN Director of Nursing2135965863%8.8
Nurse Practitioner1125286571%8
Dietitian1015006166%8.2
Administrator2024785863%8
Qualified Social Worker0114436672%6.7
Respiratory Therapy Technician0444366470%5.5
Speech Language Pathologist0224037076%5.8
Physical Therapy Assistant0333676368%5.8
Physical Therapy Aide0113205560%5.8
Occupational Therapy Aide1123043740%8
Nurse Aide in Training1011661516%11.1
Occupational Therapy Assistant077395155%0.7
Medical Director0111489%1.8
50 Certified Nursing Assistant
% of Days 100%
34 Licensed Practical Nurse
% of Days 100%
19 Registered Nurse
% of Days 100%
12 Qualified Activities Professional
% of Days 100%
10 Clinical Nurse Specialist
% of Days 80%
2 Dental Services Staff
% of Days 73%
5 Other Dietary Services Staff
% of Days 92%
3 RN Director of Nursing
% of Days 63%
2 Nurse Practitioner
% of Days 71%
1 Dietitian
% of Days 66%
2 Administrator
% of Days 63%
1 Qualified Social Worker
% of Days 72%
4 Respiratory Therapy Technician
% of Days 70%
2 Speech Language Pathologist
% of Days 76%
3 Physical Therapy Assistant
% of Days 68%
1 Physical Therapy Aide
% of Days 60%
2 Occupational Therapy Aide
% of Days 40%
1 Nurse Aide in Training
% of Days 16%
7 Occupational Therapy Assistant
% of Days 55%
1 Medical Director
% of Days 9%

Penalties and fines

Includes penalties issued in 2024

Federal penalties imposed by CMS for regulatory violations, including civil money penalties (fines) and denials of payment for new Medicare/Medicaid admissions.

Source: CMS Penalties Database (Data as of Jan 2026)

Total fines amount $11K Rank #141 / 203Federal fines — State benchmarkedThis home is ranked 141st out of 203 homes in Ohio. Shows this facility's cumulative CMS federal fine dollars versus the Ohio average among facilities with fines, and where it ranks among 203 skilled nursing facilities in the pool. Lower total dollars mean a better rank.Click the rank badge to see the full State ranking.Click here to see the full State ranking.
84% lower than Ohio average

Ohio average: $69K

Number of fines 1
46% fewer fines than Ohio average

Ohio average: 1.9

Payment Denials Info Serious action where Medicare and/or Medicaid temporarily stops payments for new residents until issues are fixed. 0
100% fewer payment denials than Ohio average

Ohio average: 0.5

Fines amount comparison
This facility $11K
Ohio average $69K
Penalty History

Penalties are imposed by CMS for violations of federal nursing home regulations.

1 penalty in the past 3 years

Dec 19, 2024 · $11K

Civil Money Penalty Info Fines imposed for noncompliance, which can be assessed per day or per instance of violation. Dec 19, 2024
$11K

Last updated: Jan 2026

Quality of care over time

These measures show how residents usually do over time at this home, based on health outcomes and preventive care.

High-risk clinical events score Info A composite score based on pressure ulcers, falls with injury, weight loss, walking ability decline, and activities of daily living decline. 6.1
In line with Ohio average

Ohio average: 5.8

Functional decline score Info A composite score based on activities of daily living decline, walking ability decline, and incontinence. 15.4
22% worse than Ohio average

Ohio average: 12.7

Long-stay resident measures
Significantly above average Ohio avg: 4.7 Info CMS star rating based on long-stay quality measure performance. 5 stars = significantly above average, 1 star = significantly below average.
Need for Help with Daily Activities Increased Info Percent of long-stay residents whose need for help with daily activities has increased 6.0%
12% better than Ohio average

Ohio average: 6.8%

Walking Ability Worsened Info Percent of long-stay residents whose ability to move independently worsened 10.9%
23% worse than Ohio average

Ohio average: 8.9%

Low Risk Residents with Bowel/Bladder Incontinence Info Percent of low risk long-stay residents who lose control of their bowels or bladder 29.4%
34% worse than Ohio average

Ohio average: 22.0%

Falls with Major Injury Info Percent of long-stay residents experiencing one or more falls with major injury 2.8%
18% better than Ohio average

Ohio average: 3.4%

High Risk Residents with Pressure Ulcers Info Percent of long-stay high risk residents with pressure ulcers 4.7%
22% worse than Ohio average

Ohio average: 3.9%

Urinary Tract Infection Info Percent of long-stay residents with a urinary tract infection 0.4%
27% better than Ohio average

Ohio average: 0.5%

Lost Too Much Weight Info Percent of long-stay residents who lose too much weight 6.0%
In line with Ohio average

Ohio average: 6.2%

Depressive Symptoms Info Percent of long-stay residents who have depressive symptoms 8.4%
65% better than Ohio average

Ohio average: 24.0%

Antipsychotic Use Info Percent of long-stay residents who received an antipsychotic medication 3.8%
56% better than Ohio average

Ohio average: 8.4%

Pneumococcal Vaccine Info Percent of long-stay residents assessed and appropriately given the pneumococcal vaccine 56.4%
39% worse than Ohio average

Ohio average: 92.4%

Influenza Vaccine Info Percent of long-stay residents assessed and appropriately given the seasonal influenza vaccine 87.8%
7% worse than Ohio average

Ohio average: 94.5%

Short-stay resident measures
Average Ohio avg: 2.4 Info CMS star rating based on short-stay quality measure performance. 5 stars = much above average, 1 star = much below average.
Pneumococcal Vaccine Info Percent of short-stay residents assessed and appropriately given the pneumococcal vaccine 44.9%
43% worse than Ohio average

Ohio average: 78.0%

Antipsychotic medication increase Info Percent of short-stay residents who newly received an antipsychotic medication 2.5%
93% worse than Ohio average

Ohio average: 1.3%

Influenza Vaccine Info Percent of short-stay residents assessed and appropriately given the seasonal influenza vaccine 47.1%
38% worse than Ohio average

Ohio average: 75.6%

Re-hospitalized after SNF stay Info Percentage of short-stay residents who were re-hospitalized after their nursing home admission. 22.7%
10% better than Ohio average

Ohio average: 25.1%

Emergency department visits Info Percentage of short-stay residents who had an outpatient emergency department visit. 11.9%
5% better than Ohio average

Ohio average: 12.5%

Falls with major injury Info Percentage of SNF residents who experience falls with major injury during their stay. 4.1%
430% worse than Ohio average

Ohio average: 0.8%

Ability to care for self at discharge Info Percentage of residents at or above expected ability to care for themselves at discharge. 57.6%
7% better than Ohio average

Ohio average: 53.7%

Successful return to home or community Info Rate of successful return to home or community from a skilled nursing facility. 52.5%
In line with Ohio average

Ohio average: 50.6%

Breakdown by payment type

Medicare

25% of new residents, usually for short-term rehab.

Typical stay 22 days

Private pay

71% of new residents, often for short stays.

Typical stay 1 - 2 months

Medicaid

4% of new residents, often for long-term daily care.

Typical stay 11 - 12 months

Facility Characteristics

Source: CMS Long-Term Care Facility Characteristics (Data as of Jan 2026)

Total residents 88
Medicare
11
12.5% of residents
Medicaid
56
63.6% of residents
Private pay or other
21
23.9% of residents
Programs & Services
Residents Group

Residents meet regularly to discuss policies, care quality, and activities

Nurse Aide Training

State-approved Nurse Aide Training and Competency Evaluation Program on-site

Active Resident Council

Organized group of residents that meets regularly to discuss facility policies, quality of life, and activities.

Finances and operations

Privately-owned community
Operated by a business corporation.
Home revenue
$13.6M
Operating loss
-$649.0K
Privately-owned community Operated by a business corporation.
Home revenue
$13.6M Rank #64 / 203Revenue — State benchmarkedThis home is ranked 64th out of 203 homes in Ohio. Shows this facility's annual revenue compared to the Ohio SNF average. Higher revenue generally means more resources for staffing and capital — read alongside Payroll %.Click the rank badge to see the full State ranking.Click here to see the full State ranking.
Operating loss
-$649.0K
Payroll costs Info The portion of the home's budget spent on staff, including nurses, caregivers, and other employees who support care and operations. Rank #58 / 203Payroll — State benchmarkedThis home is ranked 58th out of 203 homes in Ohio. Shows total annual staff payroll benchmarked to the Ohio average. Higher payroll investment relative to peers often signals better staffing and less reliance on cheaper contract labor.Click the rank badge to see the full State ranking.Click here to see the full State ranking.
$6.8M
49.7% of revenue Rank #105 / 203Payroll % — State benchmarkedThis home is ranked 105th out of 203 homes in Ohio. Shows payroll as a percentage of revenue versus the Ohio average. Well-run Ohio SNFs typically land around 54–64% — the top third Statewide. Below 25% may signal understaffing or heavy agency use — read with Staffing ratings.Click the rank badge to see the full State ranking.Click here to see the full State ranking.
Other operating costs Info All remaining costs needed to run the home, such as food, utilities, building maintenance, supplies and administrative expenses.
$7.5M
Total costs $14.3M

What does this home offer?

Total residents icon

Total Residents: 90 Residents

Housing options icon

Housing Options: Private / Semi-Private Rooms

Building type icon
Building type icon

Building Type: Single-story

Who this home usually serves

TYPE OF STAY

Primarily short stays

Residents typically stay for brief periods, with frequent admissions and discharges throughout the year.

Places of interest near Tallmadge Health and Rehab

Address 1.4 miles from city center Info Estimated distance in miles from Tallmadge's city center to Tallmadge Health and Rehab's address, calculated via Google Maps.

Calculate Travel Distance to Tallmadge Health and Rehab

Add your location

Address

Financial Assistance for
Nursing Home in Ohio

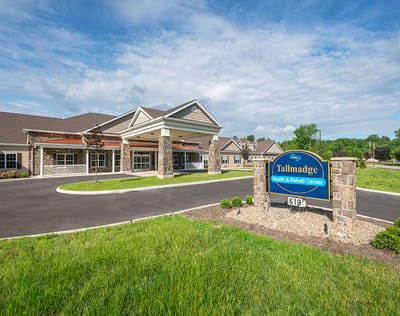
Tallmadge Health and Rehab is located in Tallmadge, Ohio.
Here are the financial assistance programs available to residents in Ohio.

Get Financial aid guidance

PASSPORT Waiver

Ohio Medicaid PASSPORT

Age 60+
General Ohio resident, Medicaid-eligible, nursing home-level care need.
Income Limits (2025) ~$2,829/month 300% FBR, individual
Asset Limits $2,000 (individual), $3,000 (couple).
OH

Administered through regional agencies; waitlists possible.

Benefits
Personal care (5-7 hours/day) Respite (240 hours/year) Adult day care ($65/day) Home modifications ($1,500 avg.)

Ohio Home Care Program (non-Medicaid)

OH HCP

Age 60+
General Ohio resident, at risk of decline.
Income Limits ~$2,000/month individual, varies
Asset Limits $5,000 individual
OH

Limited funding; regional variation.

Benefits
In-home care (3-5 hours/week) Respite (up to 10 days/year) Transportation (~5 trips/month)

Assisted Living Waiver (ALW)

Ohio Assisted Living Waiver

Age 21+ (65+ prioritized)
General OH resident, Medicaid-eligible, NFLOC.
Income Limits (2025) ~$2,829/month (individual); QIT required.
Asset Limits $2,000 (individual), $3,000 (couple).
OH

Covers ~300 facilities; room/board not included (separate cost).

Benefits
Personal care Meals Medication management Transportation (~$3,000-$4,000/month value)

Program of All-Inclusive Care for the Elderly (PACE)

Ohio PACE (e.g., McGregor PACE)

Age 55+
General OH resident (specific counties), NFLOC, safe with PACE support.
Income Limits (2025) ~$2,829/month (Medicaid-eligible); private pay option available.
Asset Limits $2,000 (individual), $3,000 (couple) for Medicaid enrollees.
OH

Available in 9 counties (e.g., Cuyahoga, Franklin); expanding via Healthy Aging Grants.

Benefits
Personal care (5-7 hours/day) Medical care Meals Transportation Respite Therapies

Medicare Savings Program (MSP)

Ohio Medicare Savings Program

Age 65+ or disabled
General OH resident, Medicare Part A/B.
Income Limits (2025) ~$2,510/month (QMB), ~$3,380/month (SLMB), ~$3,598/month (QI)—individual.
Asset Limits $9,430 (individual), $14,130 (couple).
OH

Three tiers; includes Extra Help for Part D; no waitlist.

Benefits
Covers Part B premiums ($174.70/month) Deductibles ($240/year) Copays (~20%)

Home Energy Assistance Program (HEAP)

Ohio HEAP

Age 60+ prioritized
General OH resident, low-income household.
Income Limits (2025) ~$3,970/month individual, 185% FPL
Asset Limits Not assessed; income-focused.
OH

Covers gas, electric, oil; emergency aid via Winter/Summer Crisis Programs.

Benefits
Heating/cooling aid ($300-$1,000/season) Emergency aid ($500 max)

Family Caregiver Support Program (FCSP)

Ohio Family Caregiver Support Program

Age
General Caregivers of 60+ needing care or 55+ caregivers of others; OH resident; functional needs (2+ ADLs).
Income Limits (2025) Prioritizes ~$24,980/year (individual); no strict cap.
Asset Limits Not assessed; need-based.
OH

12 AAAs; rural/low-income priority; volunteer respite option.

Benefits
Respite (4-6 hours/week or 5 days/year) Adult day care ($60/day) Training Supplies (~$500/year)

VA Aid and Attendance (A&A) and Housebound Benefits

Ohio VA Aid and Attendance/Housebound

Age 65+ or disabled veteran/spouse
General OH resident, wartime service, need for ADL help (A&A) or homebound.
Income Limits (2025) Net income < ~$1,984/month (veteran with dependent, A&A); pension offsets income.
Asset Limits ~$155,356 net worth limit
OH

High veteran demand; supports care in multiple settings.

Benefits
Cash (~$1,433-$2,642/month veteran, ~$951-$1,318 spouse) for care costs (e.g., in-home, assisted living)

Homestead Exemption

Ohio Homestead Exemption

Age 65+ (or disabled)
General OH resident, homeowner, low-income.
Income Limits (2025) ~$38,500/year individual, adjusted annually
Asset Limits Not assessed; home ownership required.
OH

Reduces taxable value by $25,000; applies to primary residence.

Benefits
Tax reduction (~$400-$800/year avg., varies by county)

Save the Dream Ohio (Homeowner Assistance Fund)

Ohio Save the Dream

Age 60+ prioritized
General OH resident, homeowner, hardship post-Jan 21, 2020.
Income Limits (2025) ~$147,600/year family of 4, 150% AMI; varies by county
Asset Limits Not assessed; hardship-focused.
OH

Covers delinquent mortgages, utilities, taxes; max $25,000 mortgage aid.

Benefits
Mortgage aid ($25,000 max) Utility/property tax aid ($5,000 avg.)

Compare Nursing Home around Tallmadge

The information below is reported by the Ohio Department of Health, Bureau of Survey and Certification.

2 facilities compared · CMS & OH Dept. of Health data

Filter by care type
Summit Villa Care Center
NH

Nursing Home Licensed facility providing 24/7 skilled nursing care for residents with complex, ongoing medical needs. Staffed by RNs, LPNs, and CNAs. Inspected and star-rated annually by CMS. Accepts Medicare (short-term rehab) and Medicaid (long-term care).

Tallmadge75 92.5% +18%3.17 -32%-10%$071.2-66 24 Gerri Mcgonagle$10.3M$4.5M43.3%366010
Tallmadge Health and Rehab
NH

Nursing Home Licensed facility providing 24/7 skilled nursing care for residents with complex, ongoing medical needs. Staffed by RNs, LPNs, and CNAs. Inspected and star-rated annually by CMS. Accepts Medicare (short-term rehab) and Medicaid (long-term care).

AL

Assisted Living A licensed, long-term care setting for seniors or individuals with disabilities who need help with daily activities — like bathing, dressing, and medication management — but not 24-hour skilled nursing. Offers housing, meals, and around-the-clock support while aiming to maximize resident independence.

IL

Independent Living Lifestyle-focused communities for older adults offering dining, activities, and transportation with minimal personal care. Best for active, independent seniors who want community without medical support.

MC

Memory Care Secured, specialized care for people living with Alzheimer's or dementia. Staff trained in cognitive impairment, with higher staff-to-resident ratios and an environment designed to reduce confusion and wandering risk.

Tallmadge (Northwest Avenue)90 88.5% +12%3.34 +27%-6%$10.8k423.2381 22 Sara Burton$13.6M$6.8M49.7%366487

Frequently Asked Questions about Tallmadge Health and Rehab

What neighborhood is Tallmadge Health and Rehab in?

Tallmadge Health and Rehab is in the Northwest Avenue neighborhood.

Is Tallmadge Health and Rehab in a walkable area?

Tallmadge Health and Rehab has a walk score of 22. Car-dependent. Most errands require a car, with limited nearby walkable options.

Are there photos of Tallmadge Health and Rehab?

Yes — there are 15 photos of Tallmadge Health and Rehab in the photo gallery on this page.

What is the address of Tallmadge Health and Rehab?

Tallmadge Health and Rehab is located at 619 Northwest Ave, Tallmadge, OH 44278, United States.

What is the phone number of Tallmadge Health and Rehab?

(234) 274-1888 will put you in contact with the team at Tallmadge Health and Rehab.

Is Tallmadge Health and Rehab Medicare or Medicaid certified?

Yes — Tallmadge Health and Rehab is a CMS-certified provider of Medicare and Medicaid.

Guides for Better Senior Living

Care Cost Calculator: See Prices in Your Area

Nursing Home Data Explorer

Don’t Wait Too Long: 7 Red Flag Signs Your Parent Needs Assisted Living Now

The True Cost of Assisted Living in 2025 – And How Families Are Paying For It

Understanding Senior Living Costs: Pricing Models, Discounts & Financial Assistance

Explore Open Rooms
1 Contact details
2 What type of senior care service are you looking for?
3 What budget do you have in mind for senior care?
4 How soon do you need to find care?
5 Additional details

Thank you for your interest!

Our team will be in touch shortly to help with next steps.