Explore Open Rooms

1 Contact details
2 What type of senior care service are you looking for?
3 What budget do you have in mind for senior care?
4 How soon do you need to find care?
5 Additional details

Thank you for your interest!

Our team will be in touch shortly to help with next steps.

Nursing Home in Birmingham

CMS overall rating Info The Overall CMS Rating combines results from health inspections, staffing levels and quality measures. Health inspections carry the most weight. Staffing and quality scores can increase or decrease the final rating based on performance compared to state and national standards.

Evergreen Health & Rehabilitation Center

19933 W 13 Mile Rd, Southfield, MI 48076 View map
Overview of Evergreen Health & Rehabilitation Center

Have a worry-free retirement with the idyllic senior living community of Evergreen Health & Rehabilitation Center in Southfield, MI, offering an array of care services including memory care, respite care, skilled nursing, and hospice care. The community provides physical, occupational, and speech therapy to enhance seniors’ quality of life. Moreover, a team of specially trained and reliable professionals utilizes exclusive programs to ensure seniors receive the highest quality of care and assistance.

With cozy and elegant amenities designed to maximize independence and comfort, residents enjoy a relaxing and well-cared-for lifestyle. Meals are important in keeping residents in shape and healthy, hence, the community provides healthy and delicious meals catering to their nutritional needs and tastes. Evergreen Health & Rehabilitation Center is ideal for seniors in need of support to live their golden years blissfully.

(540) 667-7010

Quality ratings

Measured by Centers for Medicare & Medicaid Services (CMS)

Overall rating Info The Overall CMS Rating combines results from health inspections, staffing levels and quality measures. Health inspections carry the most weight. Staffing and quality scores can increase or decrease the final rating based on performance compared to state and national standards.
2/5
Michigan average: 3.6/5
Health Inspection Info Based on the results of the facility's three most recent standard inspections and any complaint investigations. CMS reviews the number, scope, and severity of deficiencies, with more recent findings weighted more heavily.
1/5
Michigan average: 3.3/5
Staffing Info Measures average nursing staff hours per resident per day, including Registered Nurses (RNs) and total nursing staff. Ratings are adjusted based on the level of care residents require and are compared to state and national benchmarks.
2/5
Michigan average: 3.4/5
Quality Measures Info Based on clinical and physical health indicators reported to CMS, such as hospital readmissions, falls, pressure ulcers, and improvements in mobility. These measures reflect how well residents' health needs are being managed.
5/5
Michigan average: 3.8/5

Nursing care per resident

Info This shows how many total hours of nursing staff time are available per resident each day. Higher numbers usually mean more staff support.
3h 36m per day

This home provides 15% less nursing time per resident than the Michigan average.

Michigan average: 4h 15m per day

Staffing hours breakdown

Info Hours of care per resident per day, broken down by staff type. Data from CMS Medicare.
Staff type Facility State avg National avg
Registered Nurse (RN) Info Registered nurse hours per resident per day. 31m per day 46m per day 41m per day
Nurse Aide Info Nurse aide hours per resident per day. 1h 59m per day 2h 23m per day 2h 21m per day
Total Nursing (Weekend) Info Total number of nurse staff hours per resident per day on weekends. 3h 27m per day 3h 31m per day 3h 26m per day
Physical Therapist Info Physical therapist staff hours per resident per day. 12m per day 4m per day 4m per day
RN (Weekend) Info Registered nurse hours per resident per day on weekends. 13m per day 29m per day 29m per day

Capacity and availability

This home usually has limited availability

Occupancy is moderate, suggesting balanced demand.

Similar demand to the Michigan average
Occupancy rate 87.8%
Residents per day (avg) 159
Occupancy rate
87.8%
Residents per day (avg)
159

Who this home usually serves

TYPE OF STAY

Primarily short stays

Residents typically stay for brief periods, with frequent admissions and discharges throughout the year.

Might be optimal for
Post-acute recovery Temporary care Transitional stays

Breakdown by payment type

Medicare

34% of new residents, usually for short-term rehab.

Typical stay 24 days

Private pay

66% of new residents, often for short stays.

Typical stay 30 days

Finances and operations

Privately-owned community
Operated by a partnership between two or more business owners.
Home revenue
$26.2M
Operating loss
-$102.8K
Privately-owned community Operated by a partnership between two or more business owners.
Home revenue
$26,163,781.00
Operating loss
$-102,798.00
Payroll costs Info The portion of the home's budget spent on staff, including nurses, caregivers, and other employees who support care and operations.
$9.5M
36.3% of revenue
Other operating costs Info All remaining costs needed to run the home, such as food, utilities, building maintenance, supplies and administrative expenses.
$16.8M
Total costs $26.3M
Walk Score
Walk Score: 24 / 100
Car-dependent. Most errands require a car, with limited nearby walkable options.

About this community

Additional Licensing Details

CMS Certification Number235582

Therapy & Rehabilitation

2 services
Rehabilitation Services
Short-Term Rehab

Staffing & Medical

2 services
Skilled Nursing
24-Hour Staffing

Additional Services

1 service
Dementia Care

Amenities & Lifestyle

0 amenities
Specific ProgramsShort-Term Rehab, Long-Term Care, Dementia Care

What does this home offer?

Accepts Medicaid icon

Accept Medicaid: Yes, Accept

Total residents icon

Total Residents: 172 Residents

Housing options icon

Housing Options: Private / Semi-Private Rooms

Building type icon
Building type icon

Building Type: Single-story

Types of Care at Evergreen Health & Rehabilitation Center

Memory Care Respite Care Skilled Nursing Hospice Care
Contact Evergreen Health & Rehabilitation Center

Inspection History

In Michigan, the Department of Licensing and Regulatory Affairs (LARA) conducts unannounced inspections and investigations to ensure long-term care facilities comply with state health codes.

14 visits/inspections

9 visits/inspections triggered by complaints

4 routine inspections

Results

13 with issues

1 without issues

Michigan average: 5 visits/inspections

Latest inspection

Date September 11, 2025
Routine

72 deficiencies

Deficiencies indicate regulatory issues. A higher number implies the facility had several areas requiring improvement.

Michigan average: 8 deficiencies

Health Inspection History

Inspections
Total health inspections 13

Michigan average 6.5


Last Health inspection on Sep 2025
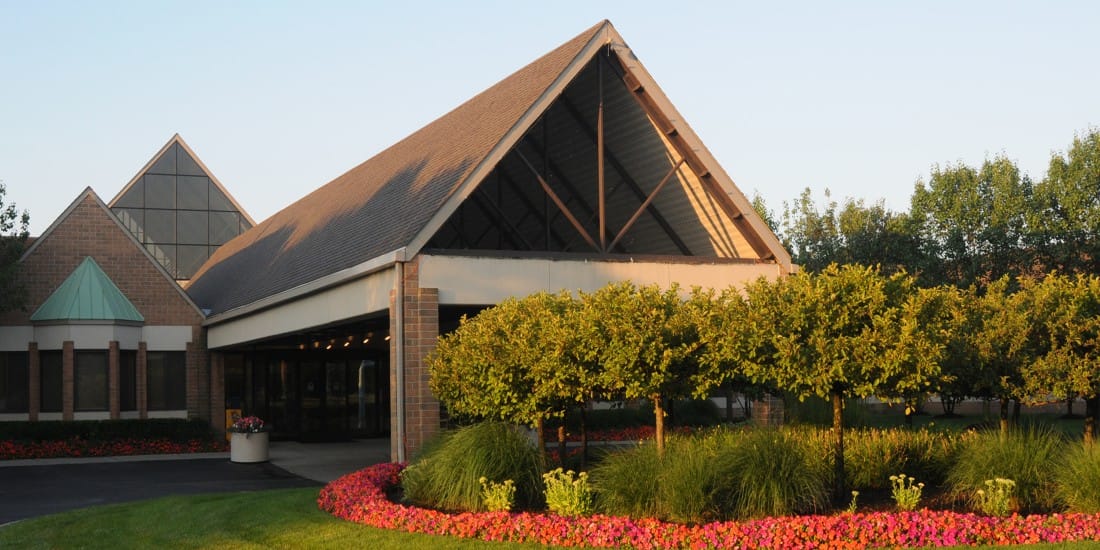
Total health citations 65

Michigan average 33.5

Citations per inspection
5

Michigan average 5.18


Health citations are formal notices following inspections when they fail to comply with safety and care standards.

19 of 65 citations resulted from standard inspections; 28 of 65 resulted from complaint investigations; and 18 of 65 came from combined inspections (standard and complaint).

Breakdown of citation severity (last 3 years)
Critical Health citations More info 0
100% better than Michigan average

Michigan average: 0.3


Serious Health citations More info 7
268% worse than Michigan average

Michigan average: 1.9

0 critical citations More info Michigan average: 0.3

7 serious citations More info Michigan average: 1.9

58 moderate citations More info Michigan average: 30.8

0 minor citations More info Michigan average: 0.5
Citations history (last 3 years)
Administration moderate citation Info Issues related to how the facility is managed, including policies, procedures, and compliance with regulations. Sep 11, 2025
Corrected

Nutrition moderate citation Info Issues related to food quality, meal service, and resident's nutritional needs. Sep 11, 2025
Corrected

Nutrition moderate citation Info Issues related to food quality, meal service, and resident's nutritional needs. Sep 11, 2025
Corrected

Quality of Care moderate citation Info Issues related to how well residents receive appropriate treatment and support for their medical and daily care needs. Sep 11, 2025
Corrected

Compare Nursing Homes around Birmingham The information below is reported by the Michigan Department of Licensing and Regulatory Affairs (LARA).

3 facilities compared · CMS & MI Dept. of Health data · Updated Apr 2026

Filter by care type
Woodward Hills
HC

Home Care Professional care delivered in the person's own home — from companionship and errands to skilled nursing and therapy. Allows seniors to age in place. Medicare covers skilled home health when medically necessary.

NH

Nursing Home Licensed facility providing 24/7 skilled nursing care for residents with complex, ongoing medical needs. Staffed by RNs, LPNs, and CNAs. Inspected and star-rated annually by CMS. Accepts Medicare (short-term rehab) and Medicaid (long-term care).

RC

Respite Care Short-term temporary care — days to weeks — to give family caregivers a break. Full care provided during the stay. Often used after hospitalization or to trial a facility before a permanent placement decision.

Bloomfield Hills
-
66.6%
-12%
4.01
-
-7%
1
0
0.0
0
141
-
Ally Bank
$23.8M
$9.6M
40.5%
235556
Private/Semi-Private Rooms
Evergreen Health & Rehabilitation Center
AL

Assisted Living A licensed, long-term care setting for seniors or individuals with disabilities who need help with daily activities — like bathing, dressing, and medication management — but not 24-hour skilled nursing. Offers housing, meals, and around-the-clock support while aiming to maximize resident independence.

IL

Independent Living Lifestyle-focused communities for older adults offering dining, activities, and transportation with minimal personal care. Best for active, independent seniors who want community without medical support.

MC

Memory Care Secured, specialized care for people living with Alzheimer's or dementia. Staff trained in cognitive impairment, with higher staff-to-resident ratios and an environment designed to reduce confusion and wandering risk.

NH

Nursing Home Licensed facility providing 24/7 skilled nursing care for residents with complex, ongoing medical needs. Staffed by RNs, LPNs, and CNAs. Inspected and star-rated annually by CMS. Accepts Medicare (short-term rehab) and Medicaid (long-term care).

Southfield
172
87.8%
+16%
3.61
-40%
-16%
2
65
5.0
7
159
24
Prince Equities Llc
$25.7M
$9.5M
37%
235582
Private / Semi-Private Rooms
Harmony Village of Beverly Hills
-
NH

Nursing Home Licensed facility providing 24/7 skilled nursing care for residents with complex, ongoing medical needs. Staffed by RNs, LPNs, and CNAs. Inspected and star-rated annually by CMS. Accepts Medicare (short-term rehab) and Medicaid (long-term care).

Beverly Hills
96
-
-
-
-
-
-
-
-
0
0
0.0
0
-
-
-
-
-
-
-
Private / Semi-Private Rooms

Places of interest near Evergreen Health & Rehabilitation Center

Address 4.0 miles from city center

Address 19933 W 13 Mile Rd, Southfield, MI 48076

Calculate Travel Distance to Evergreen Health & Rehabilitation Center

Add your location

Address

Staffing Data (Q2 2025)

This data corresponds to Q2 2025 and is based on CMS Payroll-Based Journal.

Total staff 267
Employees 208
Contractors 59
Staff to resident ratio 1.89:1
8% better than Michigan average

Michigan average ratio: 1.75:1

Avg staff/day 102
Average shift 7.7 hours
0% compared with Michigan average

Michigan average: 7.9 hours

Total staff hours (quarter) 71,753
Nursing staff breakdown
Registered Nurse

Manages medical care and health needs.

Total count 16
Average shift length Info Average shift length. Calculated as total hours divided by days worked and average staff per day. 8.3 hours

No contractors work on this role.

Licensed Practical Nurse

Assists with medical care and medications.

Total count 61
Average shift length Info Average shift length. Calculated as total hours divided by days worked and average staff per day. 8.2 hours

No contractors work on this role.

Certified Nursing Assistant

Helps with daily care and mobility.

Total count 97
Average shift length Info Average shift length. Calculated as total hours divided by days worked and average staff per day. 7.5 hours

No contractors work on this role.

Contractor staffing

Total hours from contractors

14%

10,081 contractor hours this quarter

Physical Therapy Aide: 13 Physical Therapy Assistant: 13 Qualified Social Worker: 12 Speech Language Pathologist: 11 Respiratory Therapy Technician: 10
Staff by category
Certified Nursing Assistant9709727,74091100%7.5
Licensed Practical Nurse6106118,30691100%8.2
Registered Nurse160164,37591100%8.3
Clinical Nurse Specialist8083,0067684%8.6
Respiratory Therapy Technician010102,78291100%9
Other Dietary Services Staff9092,68191100%7.6
Physical Therapy Aide013132,67991100%6.9
Physical Therapy Assistant013132,22391100%7.1
Speech Language Pathologist011111,7668897%6.4
Mental Health Service Worker5051,7668796%8
RN Director of Nursing5051,5796875%8.2
Occupational Therapy Aide2021,0386774%8.2
Qualified Social Worker012126317582%5.9
Nurse Practitioner1014966268%8
Qualified Activities Professional1014405560%8
Administrator2022403033%8
Nurse Aide in Training101711%7.1
97 Certified Nursing Assistant
% of Days 100%
61 Licensed Practical Nurse
% of Days 100%
16 Registered Nurse
% of Days 100%
8 Clinical Nurse Specialist
% of Days 84%
10 Respiratory Therapy Technician
% of Days 100%
9 Other Dietary Services Staff
% of Days 100%
13 Physical Therapy Aide
% of Days 100%
13 Physical Therapy Assistant
% of Days 100%
11 Speech Language Pathologist
% of Days 97%
5 Mental Health Service Worker
% of Days 96%
5 RN Director of Nursing
% of Days 75%
2 Occupational Therapy Aide
% of Days 74%
12 Qualified Social Worker
% of Days 82%
1 Nurse Practitioner
% of Days 68%
1 Qualified Activities Professional
% of Days 60%
2 Administrator
% of Days 33%
1 Nurse Aide in Training
% of Days 1%

Facility Characteristics

Source: CMS Long-Term Care Facility Characteristics (Data as of Jan 2026)

Total census
141 residents
Residents by payment source
Medicare
43 residents (30.5%)
Medicaid
37 residents (26.2%)
Private pay or other
61 residents (43.3%)
Programs & Services
Residents' Group

Residents meet regularly to discuss policies, care quality, and activities

Family Member Group

Family members meet regularly to discuss policies, care quality, and activities

Active Family Council

Organized group of family members that meets regularly to discuss facility policies, resident care, and activities.

Active Resident Council

Organized group of residents that meets regularly to discuss facility policies, quality of life, and activities.

Quality of care over time

These measures show how residents usually do over time at this home, based on health outcomes and preventive care.

High-risk clinical events score Info A composite score based on pressure ulcers, falls with injury, weight loss, walking ability decline, and activities of daily living decline. 4.2
50% better than Michigan average

Michigan average: 8.4

Functional decline score Info A composite score based on activities of daily living decline, walking ability decline, and incontinence. 9.4
43% better than Michigan average

Michigan average: 16.3

Long-stay resident measures
Significantly above average Michigan avg: 4.2 Info CMS star rating based on long-stay quality measure performance. 5 stars = significantly above average, 1 star = significantly below average.
Need for Help with Daily Activities Increased Info Percent of long-stay residents whose need for help with daily activities has increased 5.8%
54% better than Michigan average

Michigan average: 12.5%

Walking Ability Worsened Info Percent of long-stay residents whose ability to move independently worsened 9.3%
39% better than Michigan average

Michigan average: 15.3%

Low Risk Residents with Bowel/Bladder Incontinence Info Percent of low risk long-stay residents who lose control of their bowels or bladder 13.0%
38% better than Michigan average

Michigan average: 21.0%

Falls with Major Injury Info Percent of long-stay residents experiencing one or more falls with major injury 0.7%
78% better than Michigan average

Michigan average: 3.2%

High Risk Residents with Pressure Ulcers Info Percent of long-stay high risk residents with pressure ulcers 3.4%
41% better than Michigan average

Michigan average: 5.7%

Urinary Tract Infection Info Percent of long-stay residents with a urinary tract infection 1.8%
In line with Michigan average

Michigan average: 1.7%

Lost Too Much Weight Info Percent of long-stay residents who lose too much weight 1.6%
71% better than Michigan average

Michigan average: 5.7%

Depressive Symptoms Info Percent of long-stay residents who have depressive symptoms 4.3%
11% worse than Michigan average

Michigan average: 3.9%

Antipsychotic Use Info Percent of long-stay residents who received an antipsychotic medication 10.2%
32% better than Michigan average

Michigan average: 15.0%

Pneumococcal Vaccine Info Percent of long-stay residents assessed and appropriately given the pneumococcal vaccine 99.7%
5% better than Michigan average

Michigan average: 94.9%

Influenza Vaccine Info Percent of long-stay residents assessed and appropriately given the seasonal influenza vaccine 100.0%
5% better than Michigan average

Michigan average: 95.0%

Hospitalizations per 1,000 days Info Number of hospitalizations per 1,000 long-stay resident days. 1.00
43% better than Michigan average

Michigan average: 1.74

ED visits per 1,000 days Info Number of outpatient emergency department visits per 1,000 long-stay resident days. 0.58
62% better than Michigan average

Michigan average: 1.54

Short-stay resident measures
Significantly above average Michigan avg: 3.1 Info CMS star rating based on short-stay quality measure performance. 5 stars = much above average, 1 star = much below average.
Pneumococcal Vaccine Info Percent of short-stay residents assessed and appropriately given the pneumococcal vaccine 99.8%
21% better than Michigan average

Michigan average: 82.5%

Antipsychotic medication increase Info Percent of short-stay residents who newly received an antipsychotic medication 1.3%
8% better than Michigan average

Michigan average: 1.4%

Influenza Vaccine Info Percent of short-stay residents assessed and appropriately given the seasonal influenza vaccine 96.4%
21% better than Michigan average

Michigan average: 79.5%

Re-hospitalized after SNF stay Info Percentage of short-stay residents who were re-hospitalized after their nursing home admission. 28.7%
19% worse than Michigan average

Michigan average: 24.2%

Emergency department visits Info Percentage of short-stay residents who had an outpatient emergency department visit. 5.6%
51% better than Michigan average

Michigan average: 11.5%

Falls with major injury Info Percentage of SNF residents who experience falls with major injury during their stay. 0.3%
64% better than Michigan average

Michigan average: 0.8%

Ability to care for self at discharge Info Percentage of residents at or above expected ability to care for themselves at discharge. 56.0%
In line with Michigan average

Michigan average: 53.7%

Successful return to home or community Info Rate of successful return to home or community from a skilled nursing facility. 62.7%
24% better than Michigan average

Michigan average: 50.6%

Penalties and fines

Federal penalties imposed by CMS for regulatory violations, including civil money penalties (fines) and denials of payment for new Medicare/Medicaid admissions.

Source: CMS Penalties Database (Data as of Jan 2026)

Total fines amount $71K
7% lower than Michigan average

Michigan average: $76K

Number of fines 2
In line with Michigan average

Michigan average: 2.0

Payment Denials Info Serious action where Medicare and/or Medicaid temporarily stops payments for new residents until issues are fixed. 0
100% fewer payment denials than Michigan average

Michigan average: 0.8

Fines amount comparison
This facility $71K
Michigan average $76K
Penalty History

Penalties are imposed by CMS for violations of federal nursing home regulations.

Civil Money Penalty Info Fines imposed for noncompliance, which can be assessed per day or per instance of violation. Mar 14, 2024
$29K
Civil Money Penalty Info Fines imposed for noncompliance, which can be assessed per day or per instance of violation. Jun 29, 2023
$42K

Last updated: Jan 2026

Guides for Better Senior Living

Care Cost Calculator: See Prices in Your Area

Nursing Home Data Explorer

Don’t Wait Too Long: 7 Red Flag Signs Your Parent Needs Assisted Living Now

The True Cost of Assisted Living in 2025 – And How Families Are Paying For It

Understanding Senior Living Costs: Pricing Models, Discounts & Financial Assistance

Financial Aid for Michigan Seniors

Get financial aid guidance

MI Choice Waiver

Michigan Medicaid MI Choice Waiver

Age 65+ or disabled, Michigan resident, Medicaid- eligible, nursing home-level care need.

~$2,829/month (300% FBR, individual).

$2,000 (individual), $3,000 (couple).

Delivered through regional waiver agents; waitlists possible.

Home Help Program

Michigan Home Help

Age 65+ or disabled, Michigan resident, Medicaid- eligible or low-income.

~$1,732/month (individual, Medicaid threshold).

$2,000 (individual).

Can hire family caregivers; less intensive than waiver.

Program of All-Inclusive Care for the Elderly (PACE)

Michigan PACE

Age 55+, Michigan resident, nursing home-level care need, safe with PACE support.

~$2,829/month (Medicaid-eligible); private pay option available.

$2,000 (individual), $3,000 (couple).

16 PACE centers (e.g., Ingham, Wayne counties); expanding slowly.

Medicare Savings Program (MSP)

Michigan Medicare Savings Program

Age 65+ or disabled, Michigan resident, Medicare Part A/B.

~$2,510/month (QMB), ~$3,380/month (SLMB), ~$3,598/month (QI)—individual.

$9,430 (individual), $14,130 (couple).

Three tiers; no waitlist; includes Extra Help for Part D.

National Family Caregiver Support Program (NFCSP) Respite

Michigan NFCSP Respite Care

Caregivers of 60+ needing care or 55+ caregivers of others; Michigan resident; functional needs (2+ ADLs).

Prioritizes ~$24,980/year (individual); no strict cap.

Not assessed; need-based.

16 AAAs; prioritizes low-income, rural caregivers.

Senior Community Service Employment Program (SCSEP)

Michigan SCSEP

Age 55+, unemployed, low-income, Michigan resident.

~$1,983/month (125% FPL).

Not specified; income-focused.

Priority for veterans, rural residents; Operation ABLE partnership.

VA Aid and Attendance (A&A) and Housebound Benefits

Michigan VA Aid and Attendance/Housebound

Age 65+ or disabled veteran/spouse, Michigan resident, wartime service, need for ADL help (A&A) or homebound.

Net income < ~$1,984/month (veteran with dependent, A&A); pension offsets income.

~$155,356 (net worth limit).

High veteran demand in urban/rural areas.