


C & L Quality Home Care Services II


C & L Quality Home Care Services II
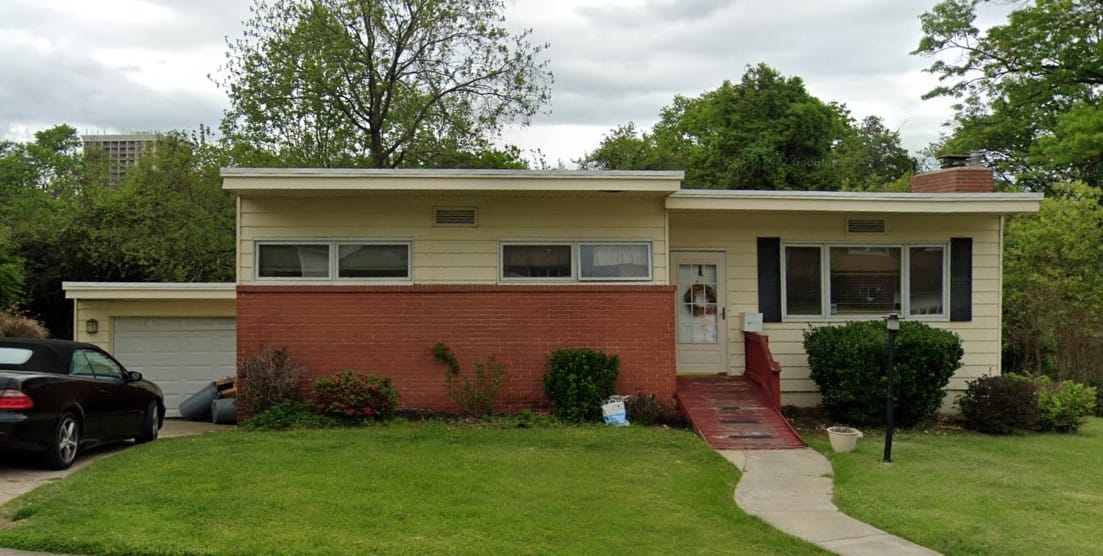
Peacefully nestled in Baltimore, MD, C & L Quality Home Care Services II is a compassionate community that goes above and beyond in delivering top-notch assisted living services. They feature a kind and trusted care team to assist residents with daily living activities like personal hygiene and medication management 24/7. Residents here feel safe and secure with round-the-clock security and emergency call systems installed throughout the community.
Thanks to the community’s convenient location, residents have easy access to local recreational amenities, medical providers, and hospitals for a good quality of life. Residents are also liberated from chores so that they can enjoy the community’s enriching activities without worries. With its calming environment and quality care services, C & L Quality Home Care Services fosters a warm and nurturing retirement experience.
4-bed community Rank #601 / 697Bed count — State benchmarkedThis home is ranked 601st out of 697 homes in Maryland. Shows this facility's certified or reported bed count compared to other Maryland facilities. Larger communities may offer more amenities, programs, and on-site services for residents and families.Click the rank badge to see the full State ranking.Click here to see the full State ranking.
A smaller, more intimate setting that may offer a quieter environment and closer staff-resident interactions.
Walk Score: 43 / 100 Rank #495 / 985Walk Score — State benchmarkedThis home is ranked 495th out of 985 homes in Maryland. Shows how walkable this facility's neighborhood is compared to the average Walk Score across Maryland facilities. Higher scores benefit residents, families, and staff.Click the rank badge to see the full State ranking.Click here to see the full State ranking.
Somewhat walkable. A few nearby services may be reachable on foot, but most trips require transportation.
About this community
Facility TypeAl
CountyBaltimore City
Secured Perimeter
Emergency SystemsYes
Safety Features24-hour emergency call system, 24-hour security monitoring, background checks on caregivers, lighted parking lots, fire alarms
Staffing
Key information about the people who lead and staff this community.
No CNA training program
24-Hour Staffing
No mild Alzheimer's level
No moderate Alzheimer's level
No severe Alzheimer's level
Admission CriteriaAssisted living is for those who require assistance with daily living activities.
HousekeepingYes
Linen ServiceYes
Recreational Park With A Trail
Entertainment Centers
ActivitiesResidents can participate in a well-rounded social activity calendar that includes educational, cultural, social, recreational, and spiritual programs tailored to their interests.
Wellness ProgramResidents are provided with a balance of independence along with the appropriate level of care and services they require within a very supportive environment.
Specific ProgramsADMISSION PROCESS, TOUR OUR HOME
Religious ServicesChurch for Spiritual Enrichment
What does this home offer?
Housing Options: Private / Shared Rooms
Building Type: Single-story
Housekeeping Services

Parking Available
Recreational Activities
Exercise Programs
Places of interest near C & L Quality Home Care Services II
![]() 7.2 miles from city center
7.2 miles from city center
![]() Estimated distance in miles from Baltimore's city center to C & L Quality Home Care Services II's address, calculated via Google Maps.
Estimated distance in miles from Baltimore's city center to C & L Quality Home Care Services II's address, calculated via Google Maps.
Calculate Travel Distance to C & L Quality Home Care Services II
Add your location
Financial Assistance for
Assisted Living in Maryland
C & L Quality Home Care Services II is located in Baltimore, Maryland.
Here are the financial assistance programs available to residents in Maryland.
Compare Assisted Living around Baltimore
The information below is reported by the Maryland Department of Health, Office of Health Care Quality.
|
|
|
|
|
|
|
|
|
|
|
|
|
|
|
|
|
|
|---|---|---|---|---|---|---|---|---|---|---|---|---|---|---|---|---|
| Sunrise of Annapolis |
AL
Assisted Living A licensed, long-term care setting for seniors or individuals with disabilities who need help with daily activities — like bathing, dressing, and medication management — but not 24-hour skilled nursing. Offers housing, meals, and around-the-clock support while aiming to maximize resident independence.
MC
Memory Care Secured, specialized care for people living with Alzheimer's or dementia. Staff trained in cognitive impairment, with higher staff-to-resident ratios and an environment designed to reduce confusion and wandering risk. |
Annapolis |
106
Facility
106
MD AVG
43
Rank
#105 / 697
| Yes |
38
Facility
38
MD AVG
43
Rank
#542 / 985
| Private / Shared Rooms |
30
Facility
30
MD AVG
21
Rank
#44 / 208
|
31%
Male Residents — State Benchmarked 31% of residents are male, compared to the Maryland average of 31%. This facility caters to a majority female resident pool (69% female), consistent with the broader assisted living trend where women significantly outnumber men. |
69%
Female Residents — State Benchmarked 69% of residents are female, compared to the Maryland average of 69%. Women comprise the large majority, consistent with national assisted living demographics where women live longer and enter care facilities at higher rates. |
90%
White Residents — State Benchmarked 90% of residents are reported as White, compared to the Maryland average of 81%. A higher White share than is typical for assisted living in Maryland in this dataset — compare with peer facilities for local context. |
6%
African American Residents — State Benchmarked 6% of residents are reported as African American or Black, compared to the Maryland average of 13%. In line with the Maryland average for African American residents among facilities reporting this breakdown. |
4%
Other Ethnicity Residents — State Benchmarked 4% of residents fall into categories other than White or African American (combined), compared to the Maryland average of 6%. This column aggregates Hispanic, Asian, multiracial, and any other labeled groups that are not classified as White or African American. Reported subgroups in this total: American Indian (1%), Hawaiian/Pacific Islander (1%), Hispanic (1%). |
12%
Residents Age 65–74 — State Benchmarked 12% of residents are 65–74, compared to the Maryland average of 13%. In line with the statewide profile for this youngest senior bracket in assisted living. |
22%
Residents Age 75–84 — State Benchmarked 22% of residents are 75–84, compared to the Maryland average of 31%. Below the state norm — the resident mix may skew either younger or older than this typical middle bracket. |
65%
Residents Age 85–94 — State Benchmarked 65% of residents are 85–94, compared to the Maryland average of 44%. A high concentration of very elderly residents signals a higher-acuity facility with experience caring for advanced age-related needs. |
- |
| Sunrise of Severna Park |
AL
Assisted Living A licensed, long-term care setting for seniors or individuals with disabilities who need help with daily activities — like bathing, dressing, and medication management — but not 24-hour skilled nursing. Offers housing, meals, and around-the-clock support while aiming to maximize resident independence. |
Severna Park (Mckinsey Road) |
100
Facility
100
MD AVG
43
Rank
#117 / 697
| Yes |
70
Facility
70
MD AVG
43
Rank
#184 / 985
| Private / Shared Rooms |
29
Facility
29
MD AVG
21
Rank
#48 / 208
|
29%
Male Residents — State Benchmarked 29% of residents are male, compared to the Maryland average of 31%. This facility caters to a majority female resident pool (71% female), consistent with the broader assisted living trend where women significantly outnumber men. |
71%
Female Residents — State Benchmarked 71% of residents are female, compared to the Maryland average of 69%. Women comprise the large majority, consistent with national assisted living demographics where women live longer and enter care facilities at higher rates. |
99%
White Residents — State Benchmarked 99% of residents are reported as White, compared to the Maryland average of 81%. A higher White share than is typical for assisted living in Maryland in this dataset — compare with peer facilities for local context. |
1%
African American Residents — State Benchmarked 1% of residents are reported as African American or Black, compared to the Maryland average of 13%. A lower African American share than is typical in Maryland; local markets still vary widely. |
0%
Other Ethnicity Residents — State Benchmarked 0% of residents fall into categories other than White or African American (combined), compared to the Maryland average of 6%. This column aggregates Hispanic, Asian, multiracial, and any other labeled groups that are not classified as White or African American. |
6%
Residents Age 65–74 — State Benchmarked 6% of residents are 65–74, compared to the Maryland average of 13%. Fewer younger seniors suggests the resident population skews older, likely requiring higher acuity care and more hands-on support. |
29%
Residents Age 75–84 — State Benchmarked 29% of residents are 75–84, compared to the Maryland average of 31%. This is the second most common age bracket in assisted living, representing residents with moderate care needs. |
56%
Residents Age 85–94 — State Benchmarked 56% of residents are 85–94, compared to the Maryland average of 44%. A high concentration of very elderly residents signals a higher-acuity facility with experience caring for advanced age-related needs. |
8%
Residents Age 95+ — State Benchmarked 8% of residents are 95 or older, compared to the Maryland average of 16%. Most residents here have not yet reached the oldest-old bracket, suggesting a younger overall community. |
| Brightview White Marsh |
AL
Assisted Living A licensed, long-term care setting for seniors or individuals with disabilities who need help with daily activities — like bathing, dressing, and medication management — but not 24-hour skilled nursing. Offers housing, meals, and around-the-clock support while aiming to maximize resident independence.
MC
Memory Care Secured, specialized care for people living with Alzheimer's or dementia. Staff trained in cognitive impairment, with higher staff-to-resident ratios and an environment designed to reduce confusion and wandering risk. |
Nottingham |
99
Facility
99
MD AVG
43
Rank
#131 / 697
| No |
49
Facility
49
MD AVG
43
Rank
#431 / 985
| Private / Shared Rooms |
25
Facility
25
MD AVG
21
Rank
#83 / 208
|
17%
Male Residents — State Benchmarked 17% of residents are male, compared to the Maryland average of 31%. This facility caters to a majority female resident pool (83% female), consistent with the broader assisted living trend where women significantly outnumber men. |
83%
Female Residents — State Benchmarked 83% of residents are female, compared to the Maryland average of 69%. Women comprise the large majority, consistent with national assisted living demographics where women live longer and enter care facilities at higher rates. |
98%
White Residents — State Benchmarked 98% of residents are reported as White, compared to the Maryland average of 81%. A higher White share than is typical for assisted living in Maryland in this dataset — compare with peer facilities for local context. |
2%
African American Residents — State Benchmarked 2% of residents are reported as African American or Black, compared to the Maryland average of 13%. A lower African American share than is typical in Maryland; local markets still vary widely. |
0%
Other Ethnicity Residents — State Benchmarked 0% of residents fall into categories other than White or African American (combined), compared to the Maryland average of 6%. This column aggregates Hispanic, Asian, multiracial, and any other labeled groups that are not classified as White or African American. |
3%
Residents Age 65–74 — State Benchmarked 3% of residents are 65–74, compared to the Maryland average of 13%. Fewer younger seniors suggests the resident population skews older, likely requiring higher acuity care and more hands-on support. |
17%
Residents Age 75–84 — State Benchmarked 17% of residents are 75–84, compared to the Maryland average of 31%. Below the state norm — the resident mix may skew either younger or older than this typical middle bracket. |
51%
Residents Age 85–94 — State Benchmarked 51% of residents are 85–94, compared to the Maryland average of 44%. A high concentration of very elderly residents signals a higher-acuity facility with experience caring for advanced age-related needs. |
29%
Residents Age 95+ — State Benchmarked 29% of residents are 95 or older, compared to the Maryland average of 16%. A high proportion of the oldest-old suggests strong end-of-life care experience and very-high-acuity capabilities. |
| Symphony Manor |
AL
Assisted Living A licensed, long-term care setting for seniors or individuals with disabilities who need help with daily activities — like bathing, dressing, and medication management — but not 24-hour skilled nursing. Offers housing, meals, and around-the-clock support while aiming to maximize resident independence.
MC
Memory Care Secured, specialized care for people living with Alzheimer's or dementia. Staff trained in cognitive impairment, with higher staff-to-resident ratios and an environment designed to reduce confusion and wandering risk.
RC
Respite Care Short-term temporary care — days to weeks — to give family caregivers a break. Full care provided during the stay. Often used after hospitalization or to trial a facility before a permanent placement decision. |
Baltimore (Roland Park) |
69
Facility
69
MD AVG
43
Rank
#195 / 697
| Yes |
71
Facility
71
MD AVG
43
Rank
#175 / 985
| Private / Shared Rooms |
15
Facility
15
MD AVG
21
Rank
#132 / 208
|
21%
Male Residents — State Benchmarked 21% of residents are male, compared to the Maryland average of 31%. This facility caters to a majority female resident pool (79% female), consistent with the broader assisted living trend where women significantly outnumber men. |
79%
Female Residents — State Benchmarked 79% of residents are female, compared to the Maryland average of 69%. Women comprise the large majority, consistent with national assisted living demographics where women live longer and enter care facilities at higher rates. |
79%
White Residents — State Benchmarked 79% of residents are reported as White, compared to the Maryland average of 81%. Close to the average for this category among assisted living facilities in Maryland with reported race/ethnicity data. |
19%
African American Residents — State Benchmarked 19% of residents are reported as African American or Black, compared to the Maryland average of 13%. In line with the Maryland average for African American residents among facilities reporting this breakdown. |
1%
Other Ethnicity Residents — State Benchmarked 1% of residents fall into categories other than White or African American (combined), compared to the Maryland average of 6%. This column aggregates Hispanic, Asian, multiracial, and any other labeled groups that are not classified as White or African American. Reported subgroups in this total: Asian (1%). |
15%
Residents Age 65–74 — State Benchmarked 15% of residents are 65–74, compared to the Maryland average of 13%. In line with the statewide profile for this youngest senior bracket in assisted living. |
44%
Residents Age 75–84 — State Benchmarked 44% of residents are 75–84, compared to the Maryland average of 31%. A high concentration in this mid-range bracket, where residents typically need moderate support with daily activities. |
18%
Residents Age 85–94 — State Benchmarked 18% of residents are 85–94, compared to the Maryland average of 44%. The population here skews younger than the statewide norm, which may indicate a more active, lower-acuity community. |
24%
Residents Age 95+ — State Benchmarked 24% of residents are 95 or older, compared to the Maryland average of 16%. A high proportion of the oldest-old suggests strong end-of-life care experience and very-high-acuity capabilities. |
| C & L Quality Home Care Services II |
AL
Assisted Living A licensed, long-term care setting for seniors or individuals with disabilities who need help with daily activities — like bathing, dressing, and medication management — but not 24-hour skilled nursing. Offers housing, meals, and around-the-clock support while aiming to maximize resident independence. |
Baltimore |
4
Facility
4
MD AVG
43
Rank
#601 / 697
| No |
43
Facility
43
MD AVG
43
Rank
#495 / 985
| Private / Shared Rooms | - | - | - | - | - | - | - | - | - | - |
Frequently Asked Questions about C & L Quality Home Care Services II
Is C & L Quality Home Care Services II in a walkable area?
C & L Quality Home Care Services II has a walk score of 43. Somewhat walkable. A few nearby services may be reachable on foot, but most trips require transportation.
How many beds does C & L Quality Home Care Services II have?
C & L Quality Home Care Services II has 4 beds.
Are there photos of C & L Quality Home Care Services II?
Yes — there are 6 photos of C & L Quality Home Care Services II in the photo gallery on this page.
What is the address of C & L Quality Home Care Services II?
C & L Quality Home Care Services II is located at 1312 Highland Drive, Baltimore, MD 21239.
What is the phone number of C & L Quality Home Care Services II?
(443) 253-6712 will put you in contact with the team at C & L Quality Home Care Services II.
What county is C & L Quality Home Care Services II located in?
C & L Quality Home Care Services II is in Baltimore City County.
Is C & L Quality Home Care Services II Medicare or Medicaid certified?
C & L Quality Home Care Services II is not currently listed as a CMS-certified provider of Medicare or Medicaid.
Guides for Better Senior Living
Care Cost Calculator: See Prices in Your Area
Nursing Home Data Explorer
Don’t Wait Too Long: 7 Red Flag Signs Your Parent Needs Assisted Living Now
The True Cost of Assisted Living in 2025 – And How Families Are Paying For It
Understanding Senior Living Costs: Pricing Models, Discounts & Financial Assistance
Contact Us

Updated on
Feedback
Write a review for C & L Quality Home Care Services II
Rate your overall experience with this community
Explore Open Rooms
1
Contact details
2
What type of senior care service are you looking for?
3
What budget do you have in mind for senior care?
4
How soon do you need to find care?
5
Additional details
Thank you for your interest!
Our team will be in touch shortly to help with next steps.
Need Help?
Let us help you or a loved one find the perfect senior home.
