San Pedro Manor
Nursing Home & Memory Care · San Antonio, TX
CMS overall rating Info CMS (the Centers for Medicare & Medicaid Services) is the federal agency that rates nursing home quality. Its Overall Rating runs from 1 to 5 stars, combining health inspections, staffing, and quality measures, with inspections weighted most heavily.

San Pedro Manor

Nursing Home & Memory Care · San Antonio, TX
CMS overall rating Info CMS (the Centers for Medicare & Medicaid Services) is the federal agency that rates nursing home quality. Its Overall Rating runs from 1 to 5 stars, combining health inspections, staffing, and quality measures, with inspections weighted most heavily.
Calculator: See prices in your area
San Pedro Manor accepts Medicaid, Medicare, and private pay.

Overview of San Pedro Manor

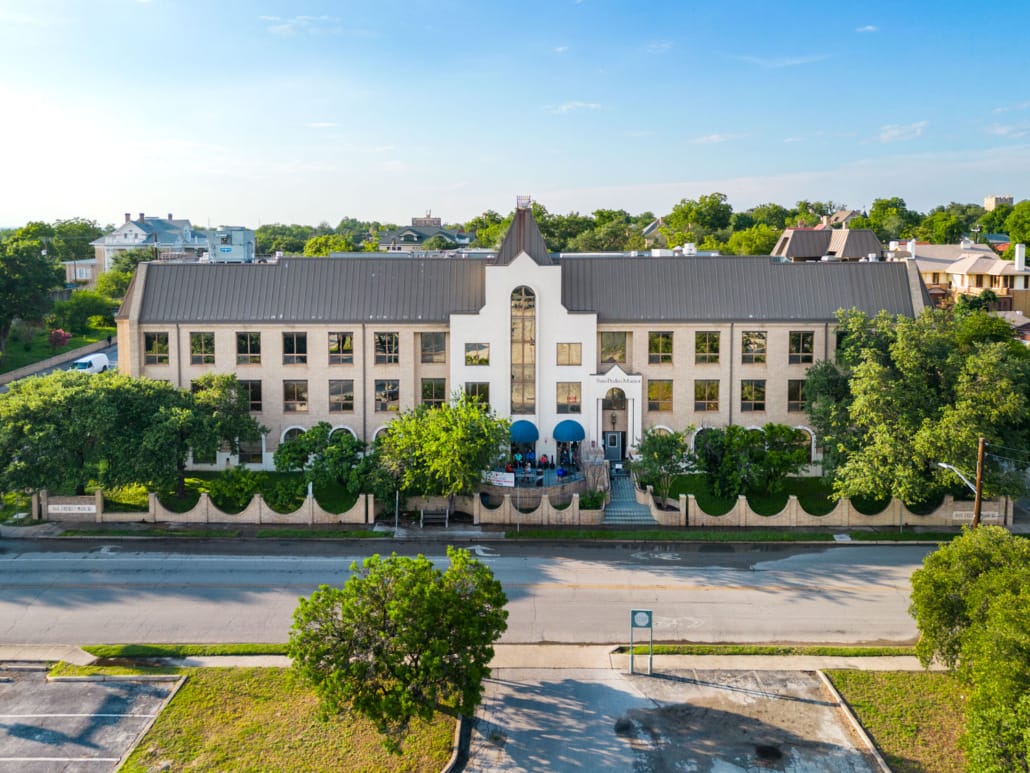
San Pedro Manor is a distinguished community situated in the charming neighborhood of West Ashley Pl, San Antonio, TX, providing in-house therapy and skilled nursing. With its dedication to improving residents’ welfare, the community utilizes a holistic approach to care tailored to their unique needs. Keep peace of mind with a compassionate and specially trained team helping with your day-to-day activities 24/7.

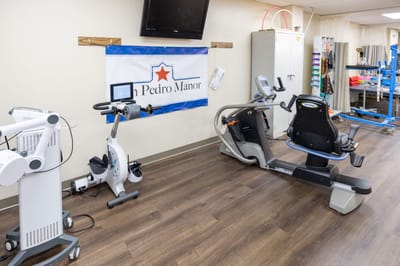
Enjoy fun activities and engaging programs, aiming to keep residents active and socially connected. Physical, occupational, and speech therapy, alongside wound care, memory care, and pulmonary programs are provided to meet residents’ healthcare needs. Receive the utmost care and support you deserve with the community’s top-notch care and specially designed amenities.

(800) 252-2412

Quality ratings

Measured by Centers for Medicare & Medicaid Services (CMS)

Overall rating Info The Overall CMS Rating combines results from health inspections, staffing levels and quality measures. Health inspections carry the most weight. Staffing and quality scores can increase or decrease the final rating based on performance compared to state and national standards.
▲ 32.9% Above TX avg. ▲ 32.9% Above TX avg.TX average: 3.0Click the badge to see the full State ranking.Click here to see the full State ranking.
Health Inspection Info Based on the results of the facility's three most recent standard inspections and any complaint investigations. CMS reviews the number, scope, and severity of deficiencies, with more recent findings weighted more heavily.
▲ 3.8% Above TX avg. ▲ 3.8% Above TX avg.TX average: 2.9Click the badge to see the full State ranking.Click here to see the full State ranking.
Staffing Info Measures average nursing staff hours per resident per day, including Registered Nurses (RNs) and total nursing staff. Ratings are adjusted based on the level of care residents require and are compared to state and national benchmarks.
▼ 16.7% Below TX avg. ▼ 16.7% Below TX avg.TX average: 2.4Click the badge to see the full State ranking.Click here to see the full State ranking.
Quality Measures Info Based on clinical and physical health indicators reported to CMS, such as hospital readmissions, falls, pressure ulcers, and improvements in mobility. These measures reflect how well residents' health needs are being managed.
▲ 26.6% Above TX avg. ▲ 26.6% Above TX avg.TX average: 4.0Click the badge to see the full State ranking.Click here to see the full State ranking.

Staffing hours breakdown

Info Daily nursing hours per resident by staff type, reported to CMS. Higher is generally better — compare this facility to state and national averages to see where staffing stands.

Hours per resident per day — compared to Texas state averages

Total nursing care / resident Info This home is ranked 122nd out of 289 homes in Texas for nurse hours. Total adjusted nursing hours per resident per day, combining RN, LPN, and aide time. CMS adjusts this for case-mix so facilities can be fairly compared.
3h 38m per day
Rank #122 / 289Nurse hours — State benchmarkedThis home is ranked 122nd out of 289 homes in Texas. Shows adjusted nurse hours per resident per day benchmarked to the Texas average, with a ranking across 289 Texas facilities. More hours mean more direct care. The national average is about 3.5 hrs; below 3.0 is a red flag.Click the rank badge to see the full State ranking.Click here to see the full State ranking.
This facility Texas avg (3h 47m per day)
vs Texas avg
-4%

2 of 6 metrics below state avg

Standout metric Physical Therapist is +59% above state avg
Staff type Hours / Day / Resident vs state avg
Registered Nurse (RN) Info RNs hold the highest nursing license and can assess residents, interpret test results, and direct care plans. More RN hours per day often signals stronger clinical oversight and faster response to health changes. 18m per day ▼ 32% State avg: 26m per day · National avg: 41m per day
LPN / LVN Info Licensed Practical Nurses (LPNs) or Licensed Vocational Nurses (LVNs) deliver routine hands-on care — medication administration, wound dressing, and monitoring vital signs. They work under RN supervision and make up a large share of daily bedside care. 1h 6m per day ▲ 16% State avg: 57m per day · National avg: 52m per day
Nurse Aide Info Certified Nurse Aides (CNAs) provide the most direct day-to-day assistance: bathing, dressing, feeding, and mobility. Nurse aide hours are typically the largest staffing category and directly affect residents' quality of life. 2h 11m per day ▲ 9% State avg: 2h 1m per day · National avg: 2h 21m per day
Weekend Total Nursing Info Combined nursing hours (RN + LPN + Nurse Aide) per resident per day on weekends. Staffing often drops on weekends — this figure reveals whether the facility maintains adequate coverage outside of weekday hours. 3h 16m per day ▲ 10% State avg: 2h 59m per day · National avg: 3h 26m per day
Physical Therapist Info Hours per resident per day provided by licensed Physical Therapists (PTs) or PT Assistants. PT services help residents recover mobility after injury or illness and are especially important for post-acute (short-stay) rehabilitation. 6m per day ▲ 59% State avg: 4m per day · National avg: 4m per day
Weekend RN Info Registered nurse hours specifically on weekends. Facilities sometimes reduce RN presence on Saturdays and Sundays — a low weekend RN figure compared to weekday hours can indicate reduced clinical oversight when most administrative staff are absent. 16m per day ▼ 24% State avg: 21m per day · National avg: 29m per day

Capacity and availability

Avg. Length of Stay
158 days
Bed community size
150-bed community Rank #63 / 988Bed count — State benchmarkedThis home is ranked 63rd out of 988 homes in Texas. Shows this facility's certified or reported bed count compared to other Texas facilities. Larger communities may offer more amenities, programs, and on-site services for residents and families.Click the rank badge to see the full State ranking.Click here to see the full State ranking.
A larger shared setting that may offer more common spaces and organized community services.
Years in operation
35 years in operation Rank #132 / 583Years in operation — State benchmarkedThis home is ranked 132nd out of 583 homes in Texas. Shows how long this facility has been in operation compared to other Texas facilities. Longer operating histories may benefit residents, families, and staff.Click the rank badge to see the full State ranking.Click here to see the full State ranking.
A longer operating history, which may indicate experience navigating regulations and delivering ongoing care.
Walk Score
Walk Score: 79 / 100 Rank #38 / 1391Walk Score — State benchmarkedThis home is ranked 38th out of 1391 homes in Texas. Shows how walkable this facility's neighborhood is compared to the average Walk Score across Texas facilities. Higher scores benefit residents, families, and staff.Click the rank badge to see the full State ranking.Click here to see the full State ranking.
Very walkable. Most errands can be accomplished on foot, and many essentials are within a short walk.
BBB Rating
BBB Rating: A+ (Not Accredited)
An independent rating from the Better Business Bureau based on factors such as complaint history, transparency, and business practices.
How BBB ratings work

About this community

License Details

Facility TypeNursing
StatusLicensed
IssuanceJanuary 4, 2023
ExpirationJanuary 4, 2026
CountyBexar
License Number147967
Year Opened2/18/1991
QualificationNursing

Ownership & Operating Entity

San Pedro Manor is administrated by Princess Hernandez.

Management CompanyWEST ASHBY HEALTHCARE, INC
OwnerUvalde County Hospital Authority
Ownership TypeHOSPITAL DISTRICT/AUTHORITY

Type Of Units

Medicare
44 units
Medicaid and Medicare
106 units
Total beds
150 units

Staffing

Key information about the people who lead and staff this community.

Leadership

ContactMr. Raul Espinoza, Director
Administrator Email[email protected]

Memory & Specialized Care

1 service
No Alzheimer's certification

Contact San Pedro Manor

Inspection History

In Texas, the Health and Human Services Commission (HHSC) is the primary regulatory body that conducts unannounced inspections and publishes quality reports for all long-term care homes.

Since 2023 · 3 years of data 19 citations

Inspection Scorecard Info This scorecard compares key inspection, citation, and complaint metrics at this facility against the Texas state average. Metrics rated ≥15% worse than average are highlighted in red; those ≥15% better are highlighted in green.

Since 2023 vs. Texas state average
Overall vs. TX average 4 Worse Metrics worse than Texas average:
• Total citations (217% above)
• Health citations (850% above)
• Life safety citations (217% above)
• Citations per year (215% above)
0 Better No metrics in this bucket.
Latest Inspection August 8, 2025 Routine

Citations Info Citations are formal regulatory issues recorded during state inspections.

This Facility TX Average vs. TX Avg
Total citations Info Formal regulatory issues recorded by inspectors across all inspection types. 19 6 This facility has 217% more total citations than a typical Texas nursing home (19 vs. TX avg 6).↑ 217% worse
Health citations Info Violations related to resident care, clinical practices, and day-to-day operations. 19 2 This facility has 850% more health citations than a typical Texas nursing home (19 vs. TX avg 2).↑ 850% worse
Life safety citations Info Violations related to building safety — fire prevention, emergency egress, and similar. 19 6 This facility has 217% more life safety citations than a typical Texas nursing home (19 vs. TX avg 6).↑ 217% worse
Citations per year Info Average citations per year since 2023. 6.3 2 This facility has 215% more citations per year than a typical Texas nursing home (6.3 vs. TX avg 2).↑ 215% worse

Inspection Reports Summary Info An editor-reviewed summary of the themes and findings across this facility's recent inspection reports.

  • The most recent inspection on August 8, 2025, found six deficiencies including privacy, incontinent care, food temperature, kitchen cleanliness, and infection control lapses.
  • The facility had a substantiated complaint investigation on May 17, 2024, with immediate jeopardy for a resident elopement and infection control failures.
  • Multiple inspections in 2024 and 2025 showed recurring infection prevention and control deficiencies, including improper PPE use and sanitation issues, indicating ongoing compliance problems.

Health Inspection History

Inspections since 2022
Total health inspections 11

Texas average 7.4


Last Health inspection on Aug 2025

Total health citations
43 Rank #253 / 292Health citations — State benchmarkedThis home is ranked 253rd out of 292 homes in Texas. Shows this facility's total health deficiency citations benchmarked to the Texas State average, with a ranking across all 292 TX facilities. Lower citation counts earn a better rank.Click the rank badge to see the full State ranking.Click here to see the full State ranking.

Texas average 25.9

Citations per inspection
3.91 Rank #204 / 292Citations per inspection — State benchmarkedThis home is ranked 204th out of 292 homes in Texas. Shows average deficiency citations per CMS inspection for this facility versus the Texas mean across 292 facilities with citation data. Lower is better.Click the rank badge to see the full State ranking.Click here to see the full State ranking.

Texas average 3.67


Health citations are formal notices following inspections when they fail to comply with safety and care standards.

17 of 43 citations resulted from standard inspections; 21 of 43 resulted from complaint investigations; and 5 of 43 came from combined inspections (standard and complaint).

Breakdown of citation severity (last 4 years)
Critical health citations
1
50% better than Texas average

Texas average: 2


Serious health citations
4
900% worse than Texas average

Texas average: 0.4

1 critical citation Texas average: 2

4 serious citations Texas average: 0.4

37 moderate citations Texas average: 23

1 minor citation Texas average: 0.4
Citations history (last 4 years)
Infection Control moderate citation Aug 08, 2025
Corrected

Nutrition moderate citation Aug 08, 2025
Corrected

Nutrition moderate citation Aug 08, 2025
Corrected

Quality of Care moderate citation Aug 08, 2025
Corrected

Staffing Data

Reporting period: October 1 – December 31, 2025 (Q4 2025). Source: CMS Payroll-Based Journal report.

Total staff 129
Employees 129
Contractors 0
Staff to resident ratio 1.32 : 1
11% fewer staff per resident than Texas average
Texas average ratio: 1.48 : 1 Texas average ratio: 1.48 : 1See full Texas ranking
Avg staff/day 54
Average shift 8.3 hours
0% compared with Texas average
Texas average: 8.1 hours Texas average shift: 8.1 hoursSee full Texas ranking
Total staff hours (quarter) 41,131

Nursing staff breakdown

Q4 2025 · Oct 1 – Dec 31 More info This data comes from the CMS Payroll-Based Journal report covering October 1 – December 31, 2025.
Registered Nurse

Manages medical care and health needs.

RN Staff Info All 10 RN Staff are full-time employees. No contractors work on this role. 10
Average shift length Info Average shift length. Calculated as total hours divided by days worked and average staff per day. 7.3 hours
Licensed Practical Nurse

Assists with medical care and medications.

LPN Staff Info All 22 LPN Staff are full-time employees. No contractors work on this role. 22
Average shift length Info Average shift length. Calculated as total hours divided by days worked and average staff per day. 9.4 hours
Certified Nursing Assistant

Helps with daily care and mobility.

CNA Staff Info All 44 CNA Staff are full-time employees. No contractors work on this role. 44
Average shift length Info Average shift length. Calculated as total hours divided by days worked and average staff per day. 8.3 hours

Contractor staffing

Q4 2025 · Oct 1 – Dec 31 More info This data comes from the CMS Payroll-Based Journal report covering October 1 – December 31, 2025.
Total hours from contractors 0% — all staff are direct employees this quarter

Staff by category

Q4 2025 · Oct 1 – Dec 31 More info This data comes from the CMS Payroll-Based Journal report covering October 1 – December 31, 2025.
Certified Nursing Assistant 44 0 44 15,322 92 100% 8.3
Licensed Practical Nurse 22 0 22 7,538 92 100% 9.4
Medication Aide/Technician 8 0 8 3,409 92 100% 9
RN Director of Nursing 8 0 8 2,121 78 85% 8.9
Physical Therapy Aide 9 0 9 2,074 73 79% 7
Registered Nurse 10 0 10 1,965 91 99% 7.3
Qualified Social Worker 5 0 5 1,725 72 78% 6.9
Speech Language Pathologist 7 0 7 1,673 78 85% 7.2
Dental Services Staff 3 0 3 1,112 66 72% 8
Respiratory Therapy Technician 2 0 2 930 70 76% 7.6
Physical Therapy Assistant 3 0 3 715 63 68% 6.9
Nurse Practitioner 1 0 1 583 65 71% 9
Administrator 1 0 1 528 66 72% 8
Nurse Aide in Training 2 0 2 514 45 49% 8
Dietitian 1 0 1 499 60 65% 8.3
Other Dietary Services Staff 1 0 1 381 62 67% 6.1
Clinical Nurse Specialist 2 0 2 43 6 7% 7.1
44 Certified Nursing Assistant
% of Days 100%
22 Licensed Practical Nurse
% of Days 100%
8 Medication Aide/Technician
% of Days 100%
8 RN Director of Nursing
% of Days 85%
9 Physical Therapy Aide
% of Days 79%
10 Registered Nurse
% of Days 99%
5 Qualified Social Worker
% of Days 78%
7 Speech Language Pathologist
% of Days 85%
3 Dental Services Staff
% of Days 72%
2 Respiratory Therapy Technician
% of Days 76%
3 Physical Therapy Assistant
% of Days 68%
1 Nurse Practitioner
% of Days 71%
1 Administrator
% of Days 72%
2 Nurse Aide in Training
% of Days 49%
1 Dietitian
% of Days 65%
1 Other Dietary Services Staff
% of Days 67%
2 Clinical Nurse Specialist
% of Days 7%

Penalties and fines

Includes penalties issued in 2024

Federal penalties imposed by CMS for regulatory violations, including civil money penalties (fines) and denials of payment for new Medicare/Medicaid admissions.

Source: CMS Penalties Database (Data as of Jan 2026)

Total fines amount $36K Rank #199 / 294Federal fines — State benchmarkedThis home is ranked 199th out of 294 homes in Texas. Shows this facility's cumulative CMS federal fine dollars versus the Texas average among facilities with fines, and where it ranks among 294 facilities in the pool. Lower total dollars mean a better rank.Click the rank badge to see the full State ranking.Click here to see the full State ranking.
55% lower than Texas average

Texas average: $80K

Number of fines 3
21% more fines than Texas average

Texas average: 2.5

Payment Denials Info Serious action where Medicare and/or Medicaid temporarily stops payments for new residents until issues are fixed. 1
354% more payment denials than Texas average

Texas average: 0.2

Fines amount comparison
This facility $36K
Texas average $80K
Penalty History

Penalties are imposed by CMS for violations of federal nursing home regulations.

3 penalties in the past 3 years

Multiple penalties were reported in the last 3 years.

Civil Money Penalty Info Fines imposed for noncompliance, which can be assessed per day or per instance of violation. Jun 27, 2024
$14K
Payment Denial Info Serious action where Medicare and/or Medicaid temporarily stops payments for new residents until issues are fixed. Jun 27, 2024
72 days
Civil Money Penalty Info Fines imposed for noncompliance, which can be assessed per day or per instance of violation. May 17, 2024
$10K

Last updated: Jan 2026

Quality of care over time

These measures show how residents usually do over time at this home, based on health outcomes and preventive care.

High-risk clinical events score Info A composite score based on pressure ulcers, falls with injury, weight loss, walking ability decline, and activities of daily living decline. 10.9
26% worse than Texas average

Texas average: 8.6

Functional decline score Info A composite score based on activities of daily living decline, walking ability decline, and incontinence. 23.0
43% worse than Texas average

Texas average: 16.0

Long-stay resident measures
Significantly above average Texas avg: 4.1 Info CMS star rating based on long-stay quality measure performance. 5 stars = significantly above average, 1 star = significantly below average.
Need for Help with Daily Activities Increased Info Percent of long-stay residents whose need for help with daily activities has increased 15.3%
5% better than Texas average

Texas average: 16.2%

Walking Ability Worsened Info Percent of long-stay residents whose ability to move independently worsened 29.7%
83% worse than Texas average

Texas average: 16.2%

Low Risk Residents with Bowel/Bladder Incontinence Info Percent of low risk long-stay residents who lose control of their bowels or bladder 23.9%
53% worse than Texas average

Texas average: 15.7%

Falls with Major Injury Info Percent of long-stay residents experiencing one or more falls with major injury 0.3%
89% better than Texas average

Texas average: 3.2%

High Risk Residents with Pressure Ulcers Info Percent of long-stay high risk residents with pressure ulcers 5.6%
27% worse than Texas average

Texas average: 4.4%

Urinary Tract Infection Info Percent of long-stay residents with a urinary tract infection 0.3%
58% better than Texas average

Texas average: 0.8%

Lost Too Much Weight Info Percent of long-stay residents who lose too much weight 3.5%
In line with Texas average

Texas average: 3.5%

Depressive Symptoms Info Percent of long-stay residents who have depressive symptoms 0.7%
76% better than Texas average

Texas average: 2.9%

Antipsychotic Use Info Percent of long-stay residents who received an antipsychotic medication 3.3%
58% better than Texas average

Texas average: 7.9%

Pneumococcal Vaccine Info Percent of long-stay residents assessed and appropriately given the pneumococcal vaccine 100.0%
In line with Texas average

Texas average: 97.3%

Influenza Vaccine Info Percent of long-stay residents assessed and appropriately given the seasonal influenza vaccine 100.0%
In line with Texas average

Texas average: 97.9%

Hospitalizations per 1,000 days Info Number of hospitalizations per 1,000 long-stay resident days. 1.78
16% better than Texas average

Texas average: 2.13

ED visits per 1,000 days Info Number of outpatient emergency department visits per 1,000 long-stay resident days. 1.04
50% better than Texas average

Texas average: 2.07

Short-stay resident measures
Significantly above average Texas avg: 3.1 Info CMS star rating based on short-stay quality measure performance. 5 stars = much above average, 1 star = much below average.
Pneumococcal Vaccine Info Percent of short-stay residents assessed and appropriately given the pneumococcal vaccine 99.3%
10% better than Texas average

Texas average: 90.4%

Antipsychotic medication increase Info Percent of short-stay residents who newly received an antipsychotic medication 0.0%
100% better than Texas average

Texas average: 1.4%

Influenza Vaccine Info Percent of short-stay residents assessed and appropriately given the seasonal influenza vaccine 98.6%
12% better than Texas average

Texas average: 88.0%

Re-hospitalized after SNF stay Info Percentage of short-stay residents who were re-hospitalized after their nursing home admission. 16.5%
36% better than Texas average

Texas average: 25.9%

Emergency department visits Info Percentage of short-stay residents who had an outpatient emergency department visit. 8.7%
28% better than Texas average

Texas average: 12.0%

Falls with major injury Info Percentage of SNF residents who experience falls with major injury during their stay. 0.0%
100% better than Texas average

Texas average: 0.8%

Ability to care for self at discharge Info Percentage of residents at or above expected ability to care for themselves at discharge. 25.8%
52% worse than Texas average

Texas average: 53.7%

Breakdown by payment type

Medicare

35% of new residents, usually for short-term rehab.

Typical stay 24 days

Private pay

37% of new residents, often for short stays.

Typical stay 1 - 2 months

Medicaid

28% of new residents, often for long-term daily care.

Typical stay 1 - 2 years

Facility Characteristics

Source: CMS Long-Term Care Facility Characteristics (Data as of Jan 2026)

Total residents 98
Medicare
5
5.1% of residents
Medicaid
76
77.6% of residents
Private pay or other
17
17.3% of residents
Programs & Services
Residents Group

Residents meet regularly to discuss policies, care quality, and activities

Active Resident Council

Organized group of residents that meets regularly to discuss facility policies, quality of life, and activities.

Finances and operations

Based on the 2024 CMS SNF Cost Report.

Governmental community
Operated by county authorities.
Home revenue
$12.1M
Surplus of revenue
$201.1K
Governmental community Operated by county authorities.
Home revenue
$12.1M Rank #117 / 297Revenue — State benchmarkedThis home is ranked 117th out of 297 homes in Texas. Shows this facility's annual revenue compared to the Texas average. Higher revenue generally means more resources for staffing and capital — read alongside Payroll %.Click the rank badge to see the full State ranking.Click here to see the full State ranking.
Surplus of revenue
$201.1K
Payroll costs Info The portion of the home's budget spent on staff, including nurses, caregivers, and other employees who support care and operations. Rank #88 / 297Payroll — State benchmarkedThis home is ranked 88th out of 297 homes in Texas. Shows total annual staff payroll benchmarked to the Texas average. Higher payroll investment relative to peers often signals better staffing and less reliance on cheaper contract labor.Click the rank badge to see the full State ranking.Click here to see the full State ranking.
$6.1M
50.8% of revenue Rank #96 / 297Payroll % — State benchmarkedThis home is ranked 96th out of 297 homes in Texas. Shows payroll as a percentage of revenue versus the Texas average. Well-run Texas facilities typically land around 51–63% — the top third Statewide. Below 25% may signal understaffing or heavy agency use — read with Staffing ratings.Click the rank badge to see the full State ranking.Click here to see the full State ranking.
Other operating costs Info All remaining costs needed to run the home, such as food, utilities, building maintenance, supplies and administrative expenses.
$5.8M
Total costs $11.9M

What does this home offer?

Housing options icon

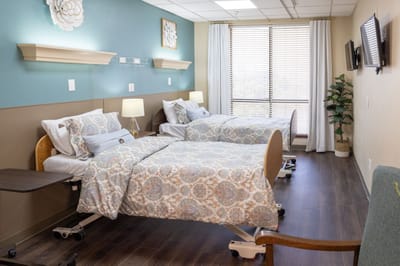
Housing Options: Private / Semi-Private Rooms

Building type icon
Building type icon

Building Type: 3-story

Housekeeping icon
Housekeeping icon

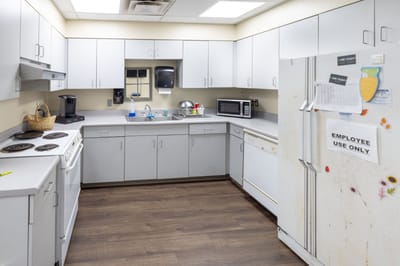
Housekeeping Services

Transportation services icon

Transportation Services

Recreational activities icon

Recreational Activities

Exercise program icon

Exercise Programs

Who this home usually serves

TYPE OF STAY

Mostly long-term care residents

Most residents stay for extended periods and receive ongoing daily care.

New residents most often arrive under private pay (37% of admissions), and a typical private pay stay runs around 1 - 2 months.

Admissions
188 total

Coverage residents most often arrive under.

Medicare 35%
Private pay 37%
Medicaid 28%
Discharges
191 total

Coverage residents most often leave under.

Medicare 16%
Private pay 51%
Medicaid 33%

Places of interest near San Pedro Manor

Address 1.9 miles from city center Info Estimated distance in miles from San Antonio's city center to San Pedro Manor's address, calculated via Google Maps.

Calculate Travel Distance to San Pedro Manor

Add your location

Address

Financial Assistance for
Nursing Home in Texas

San Pedro Manor is located in San Antonio, Texas.
Here are the financial assistance programs available to residents in Texas.

Get Financial aid guidance

Community Care for the Aged and Disabled (CCAD)

TX Medicaid CCAD

Age 65+ or disabled
General Texas resident, Medicaid-eligible, care need (not always nursing home level).
Income Limits (2025) ~$2,829/month 300% FBR, individual
Asset Limits $2,000 (individual), $3,000 (couple).
TX

Large state; rural access challenges.

Benefits
Personal care (5-7 hours/day) Respite (240 hours/year) Adult day care (~$60/day) Home aides

Texas Community Care Services

TX CCS

Age 60+
General Texas resident, at risk of decline.
Income Limits ~$2,000/month individual, varies
Asset Limits $5,000 individual
TX

Limited funding; high demand in urban areas.

Benefits
In-home care (3-5 hours/week) Respite (up to 10 days/year) Transportation (~5 trips/month)

Area Agency on Aging (AAA) Services

Texas AAA Services

Age 60+
General TX resident; no income/asset limits.
Income Limits (2025) None; donations encouraged.
Asset Limits Not assessed.
TX

28 AAAs; includes Meals on Wheels in some areas.

Benefits
Meals (~$5-$7/meal) Transportation Homemaker services (~4 hours/week) Respite (~5 days/year) Legal aid

Medicare Savings Program (MSP)

Texas Medicare Savings Program

Age 65+ or disabled
General TX resident, Medicare Part A/B.
Income Limits (2025) ~$2,510/month (QMB), ~$3,380/month (SLMB), ~$3,598/month (QI)—individual.
Asset Limits $9,430 (individual), $14,130 (couple).
TX

Includes Extra Help for Part D; no waitlist.

Benefits
Covers Part B premiums ($174.70/month) Deductibles ($240/year) Copays (~20%)

Family Caregiver Support Program (FCSP)

Texas Family Caregiver Support Program

Age
General Caregivers of 60+ needing care or 55+ caregivers of others; TX resident; 2+ ADLs.
Income Limits (2025) No strict cap; prioritizes low-income ~$24,980/year
Asset Limits Not assessed.
TX

High rural demand; includes grandparent caregivers.

Benefits
Respite (4-6 hours/week or 5 days/year) Adult day care ($60/day) Training Supplies (~$500/year)

VA Aid and Attendance (A&A) and Housebound Benefits

Texas VA Aid and Attendance/Housebound

Age 65+ or disabled veteran/spouse
General TX resident, wartime service, ADL help (A&A) or homebound.
Income Limits (2025) Net income < ~$1,984/month (veteran with dependent, A&A); pension offsets income.
Asset Limits ~$155,356 net worth
TX

High veteran population; supports rural/urban needs.

Benefits
Cash (~$1,433-$2,642/month veteran, ~$951-$1,318 spouse) for care costs

Property Tax Exemption for Seniors

Texas Senior Property Tax Exemption

Age 65+
General TX resident, homeowner (homestead).
Income Limits (2025) None; tax-based eligibility.
Asset Limits Not assessed.
TX

$25,000+ exemption; optional freeze in some counties; saves ~$500-$1,000/year.

Benefits
Tax exemption or freeze (~$500-$1,000/year savings)

Senior Farmers’ Market Nutrition Program (SFMNP)

Texas SFMNP

Age 60+
General TX resident, low-income.
Income Limits (2025) ~$2,322/month 185% FPL
Asset Limits Not assessed.
TX

Vouchers (~$50/season); serves ~20,000 via 28 AAAs.

Benefits
Vouchers (~$50/season) for produce at farmers’ markets

Compare Nursing Home around San Antonio

The information below is reported by the Texas Health and Human Services Commission.

5 facilities compared · CMS & TX Dept. of Health data

The Army Residence Community Health Care Center
NH

Nursing Home Licensed facility providing 24/7 skilled nursing care for residents with complex, ongoing medical needs. Staffed by RNs, LPNs, and CNAs. Inspected and star-rated annually by CMS. Accepts Medicare (short-term rehab) and Medicaid (long-term care).

AL

Assisted Living A licensed, long-term care setting for seniors or individuals with disabilities who need help with daily activities — like bathing, dressing, and medication management — but not 24-hour skilled nursing. Offers housing, meals, and around-the-clock support while aiming to maximize resident independence.

IL

Independent Living Lifestyle-focused communities for older adults offering dining, activities, and transportation with minimal personal care. Best for active, independent seniors who want community without medical support.

MC

Memory Care Secured, specialized care for people living with Alzheimer's or dementia. Staff trained in cognitive impairment, with higher staff-to-resident ratios and an environment designed to reduce confusion and wandering risk.

San Antonio (Northeast Side)
30
Facility 30
TX AVG 80
Rank #782 / 988
70.1%
Facility 70.1%
TX AVG 63.5%
Rank #128 / 297
+10%
4.74
Facility 4.74
TX AVG 3.63
Rank #34 / 289
-10% +31%
$0
Facility $0
TX AVG $81.8k
Rank #1 / 294
18
Facility 18
TX AVG 25.9
Rank #101 / 292
4.5
Facility 4.5
TX AVG 3.7
Rank #241 / 292
- 59 -
6
Facility 6
TX AVG 41
Rank #1286 / 1391
Army Retirement Residence Foundation San Antonio
$48.9M
Facility $48.9M
TX AVG $8.4M
Rank #6 / 297
$17.6M
Facility $17.6M
TX AVG $3.5M
Rank #6 / 297
36%
Facility 36%
TX AVG 47%
Rank #262 / 297
675697
Mystic Park Nursing and Rehabilitation Center
NH

Nursing Home Licensed facility providing 24/7 skilled nursing care for residents with complex, ongoing medical needs. Staffed by RNs, LPNs, and CNAs. Inspected and star-rated annually by CMS. Accepts Medicare (short-term rehab) and Medicaid (long-term care).

MC

Memory Care Secured, specialized care for people living with Alzheimer's or dementia. Staff trained in cognitive impairment, with higher staff-to-resident ratios and an environment designed to reduce confusion and wandering risk.

San Antonio (Far West Side)
119
Facility 119
TX AVG 80
Rank #258 / 988
81.8%
Facility 81.8%
TX AVG 63.5%
Rank #51 / 297
+29%
3.50
Facility 3.50
TX AVG 3.63
Rank #140 / 289
-5% -4%
$111.1k
Facility $111.1k
TX AVG $81.8k
Rank #251 / 294
21
Facility 21
TX AVG 25.9
Rank #147 / 292
4.2
Facility 4.2
TX AVG 3.7
Rank #222 / 292
2 108 -
59
Facility 59
TX AVG 41
Rank #311 / 1391
Fox Sparrow Healthcare, Inc.
$14.5M
Facility $14.5M
TX AVG $8.4M
Rank #78 / 297
$6.7M
Facility $6.7M
TX AVG $3.5M
Rank #66 / 297
46.5%
Facility 46.5%
TX AVG 47%
Rank #149 / 297
676012
San Pedro Manor
NH

Nursing Home Licensed facility providing 24/7 skilled nursing care for residents with complex, ongoing medical needs. Staffed by RNs, LPNs, and CNAs. Inspected and star-rated annually by CMS. Accepts Medicare (short-term rehab) and Medicaid (long-term care).

MC

Memory Care Secured, specialized care for people living with Alzheimer's or dementia. Staff trained in cognitive impairment, with higher staff-to-resident ratios and an environment designed to reduce confusion and wandering risk.

San Antonio (Monte Vista)
150
Facility 150
TX AVG 80
Rank #63 / 988
- -
3.63
Facility 3.63
TX AVG 3.63
Rank #122 / 289
+2% 0%
$24.3k
Facility $24.3k
TX AVG $81.8k
Rank #199 / 294
43
Facility 43
TX AVG 25.9
Rank #253 / 292
3.9
Facility 3.9
TX AVG 3.7
Rank #204 / 292
5 19 A+
79
Facility 79
TX AVG 41
Rank #38 / 1391
West Ashby Healthcare, Inc.
$12.1M
Facility $12.1M
TX AVG $8.4M
Rank #117 / 297
$6.1M
Facility $6.1M
TX AVG $3.5M
Rank #88 / 297
50.8%
Facility 50.8%
TX AVG 47%
Rank #96 / 297
455689
River City Care Center
NH

Nursing Home Licensed facility providing 24/7 skilled nursing care for residents with complex, ongoing medical needs. Staffed by RNs, LPNs, and CNAs. Inspected and star-rated annually by CMS. Accepts Medicare (short-term rehab) and Medicaid (long-term care).

San Antonio (Eastside Promise Neighborhood)
92
Facility 92
TX AVG 80
Rank #410 / 988
45.7%
Facility 45.7%
TX AVG 63.5%
Rank #251 / 297
-28%
3.63
Facility 3.63
TX AVG 3.63
Rank #122 / 289
+37% 0%
$23.4k
Facility $23.4k
TX AVG $81.8k
Rank #145 / 294
32
Facility 32
TX AVG 25.9
Rank #223 / 292
5.3
Facility 5.3
TX AVG 3.7
Rank #268 / 292
2 47 -
68
Facility 68
TX AVG 41
Rank #158 / 1391
-
$4.4M
Facility $4.4M
TX AVG $8.4M
Rank #285 / 297
$2.1M
Facility $2.1M
TX AVG $3.5M
Rank #287 / 297
48%
Facility 48%
TX AVG 47%
Rank #124 / 297
675896
Buena Vida Nursing and Rehab Center San Antonio
NH

Nursing Home Licensed facility providing 24/7 skilled nursing care for residents with complex, ongoing medical needs. Staffed by RNs, LPNs, and CNAs. Inspected and star-rated annually by CMS. Accepts Medicare (short-term rehab) and Medicaid (long-term care).

MC

Memory Care Secured, specialized care for people living with Alzheimer's or dementia. Staff trained in cognitive impairment, with higher staff-to-resident ratios and an environment designed to reduce confusion and wandering risk.

San Antonio (East Side)
222
Facility 222
TX AVG 80
Rank #10 / 988
27.6%
Facility 27.6%
TX AVG 63.5%
Rank #279 / 297
-57%
3.48
Facility 3.48
TX AVG 3.63
Rank #140 / 289
+31% -4%
$269.1k
Facility $269.1k
TX AVG $81.8k
Rank #278 / 294
44
Facility 44
TX AVG 25.9
Rank #256 / 292
4.4
Facility 4.4
TX AVG 3.7
Rank #235 / 292
3 61 -
26
Facility 26
TX AVG 41
Rank #1005 / 1391
West Wharton County Hospital District
$6.7M
Facility $6.7M
TX AVG $8.4M
Rank #254 / 297
$3.2M
Facility $3.2M
TX AVG $3.5M
Rank #254 / 297
47.3%
Facility 47.3%
TX AVG 47%
Rank #137 / 297
455390

Frequently Asked Questions about San Pedro Manor

What neighborhood is San Pedro Manor in?

San Pedro Manor is in the Monte Vista neighborhood of San Antonio.

Who is the owner of San Pedro Manor?

The legal owner and operator of San Pedro Manor is Uvalde County Hospital Authority.

Is San Pedro Manor in a walkable area?

San Pedro Manor has a walk score of 79. Very walkable. Most errands can be accomplished on foot, and many essentials are within a short walk.

What is the license number of San Pedro Manor?

According to TX state health department records, San Pedro Manor's license number is 147967.

When does San Pedro Manor's license expire?

According to TX state health department records, San Pedro Manor's license expires on January 4, 2026.

What is the occupancy rate at San Pedro Manor?

San Pedro Manor's occupancy is 54.9%.

Who is the administrator of San Pedro Manor?

Princess Hernandez is the administrator of San Pedro Manor.

Guides for Better Senior Living

Care Cost Calculator: See Prices in Your Area

Nursing Home Data Explorer

Don’t Wait Too Long: 7 Red Flag Signs Your Parent Needs Assisted Living Now

The True Cost of Assisted Living in 2025 – And How Families Are Paying For It

Understanding Senior Living Costs: Pricing Models, Discounts & Financial Assistance

Explore Open Rooms
1 Contact details
2 What type of senior care service are you looking for?
3 What budget do you have in mind for senior care?
4 How soon do you need to find care?
5 Additional details

Thank you for your interest!

Our team will be in touch shortly to help with next steps.