Explore Open Rooms

1 Contact details
2 What type of senior care service are you looking for?
3 What budget do you have in mind for senior care?
4 How soon do you need to find care?
5 Additional details

Thank you for your interest!

Our team will be in touch shortly to help with next steps.

Nursing Home

Boulevard Temple Care Center

Nursing Home

Boulevard Temple Care Center

2567 W Grand Blvd, Detroit, MI 48208 View map
Overview of Boulevard Temple Care Center

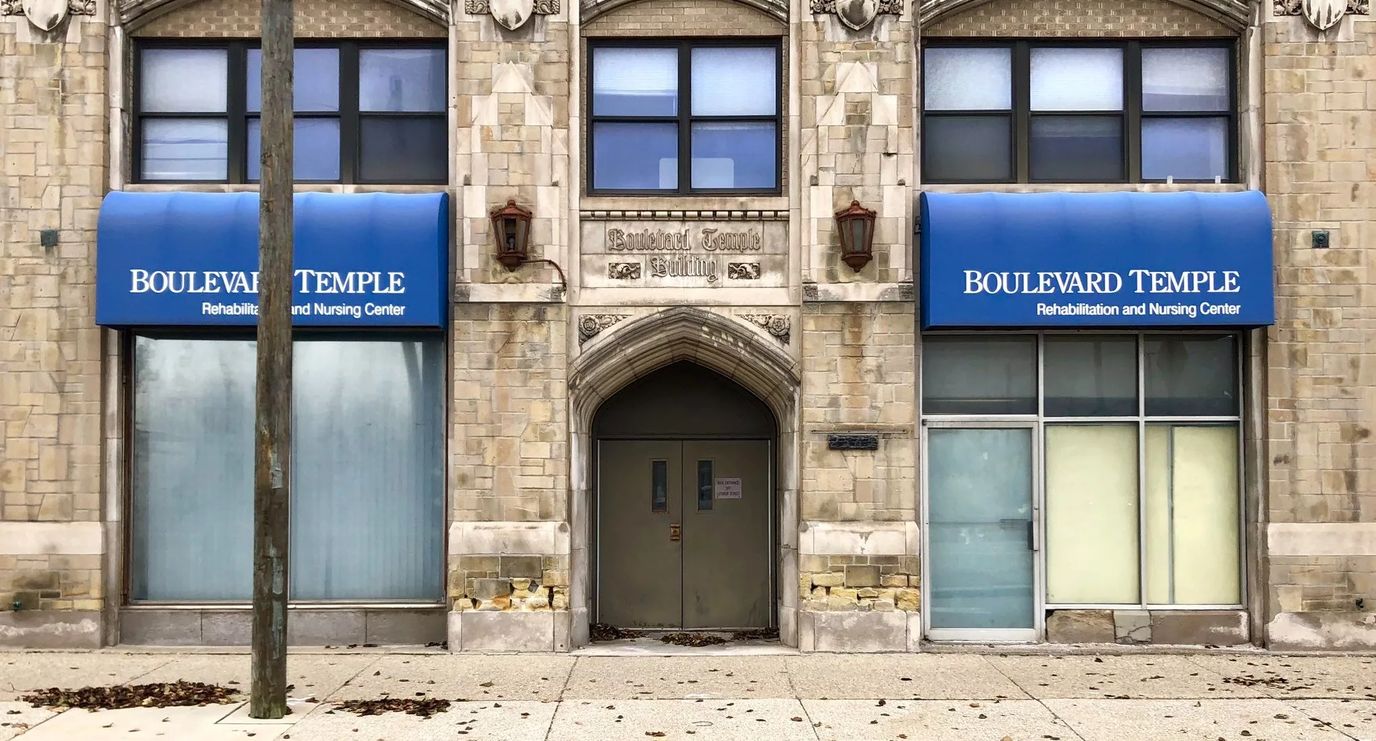
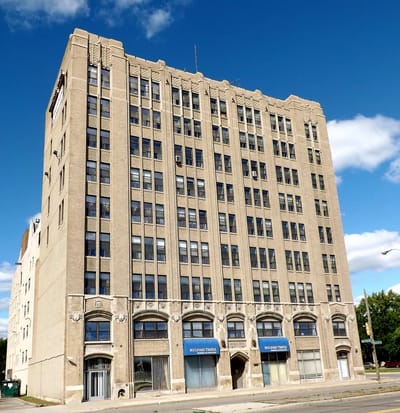
Boulevard Temple Care Center boasts an upscale and professional community that ensures a kind of service delivered with compassion and respect, earning the respect of being a reliable skilled nursing community in Detroit. Boulevard Temple Care Center is the ideal community for those seniors who are looking for long-term care and short-term sub-acute rehabilitation services.The community has ensured that every needs of residents are met and exceeded; its approach to senior living is expected to be exceptional as it has proven to provide a professional yet elegant approach to nursing home living. Boulevard Temple Care Center ensures that residents are able to experience an unparalleled lifestyle that is vital to reach its mark as a prime senior living community. 

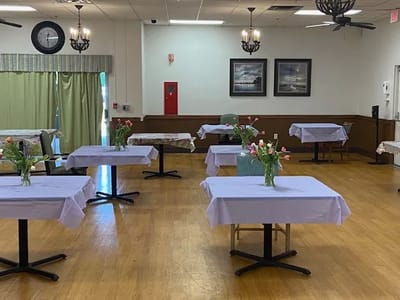
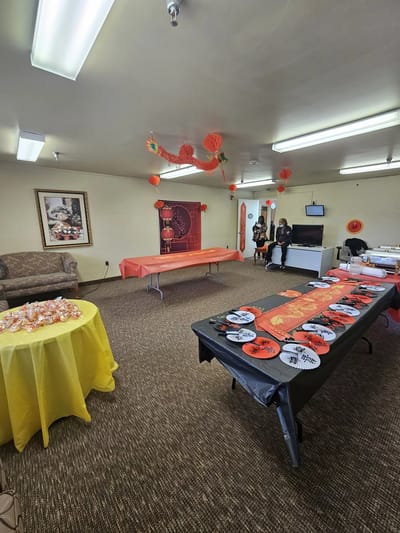
Life at the Boulevard Temple strives as a nursing home that has unmatched service that gives off sophisticated hospitality. They also offer respite care and hospice care; all residents from different housing options get to have access to their amenities such as their residential lounge on each floor; an emergency alert system; a full bath in every room; a beauty salon and barbershop; and a computer room to name a few of their amenities. As for their essential services, they provide weekly laundry; daily housekeeping; an on-site medical staff; specialized unique therapy program mainly for memory care residents. The community ensures a comfortable and safe environment so families of residents can rest easy with the comfort that their loved ones are being well taken care of– resort-style like service.

(313) 895-5340

Quality ratings

Measured by Centers for Medicare & Medicaid Services (CMS)

Overall rating Info The Overall CMS Rating combines results from health inspections, staffing levels and quality measures. Health inspections carry the most weight. Staffing and quality scores can increase or decrease the final rating based on performance compared to state and national standards.
4/5
Michigan average: 3.1/5
Health Inspection Info Based on the results of the facility's three most recent standard inspections and any complaint investigations. CMS reviews the number, scope, and severity of deficiencies, with more recent findings weighted more heavily.
3/5
Michigan average: 2.8/5
Staffing Info Measures average nursing staff hours per resident per day, including Registered Nurses (RNs) and total nursing staff. Ratings are adjusted based on the level of care residents require and are compared to state and national benchmarks.
4/5
Michigan average: 3.5/5
Quality Measures Info Based on clinical and physical health indicators reported to CMS, such as hospital readmissions, falls, pressure ulcers, and improvements in mobility. These measures reflect how well residents' health needs are being managed.
5/5
Michigan average: 3.8/5

Nursing care per resident

Info This shows how many total hours of nursing staff time are available per resident each day. Higher numbers usually mean more staff support.
4h 29m per day

This home provides 5% more nursing time per resident than the Michigan average.

Michigan average: 4h 18m per day

Staffing hours breakdown

Info Hours of care per resident per day, broken down by staff type. Data from CMS Medicare.
Staff type Facility State avg National avg
Registered Nurse (RN) Info Registered nurse hours per resident per day. 32m per day 46m per day 41m per day
Nurse Aide Info Nurse aide hours per resident per day. 2h 23m per day 2h 23m per day 2h 21m per day
Total Nursing (Weekend) Info Total number of nurse staff hours per resident per day on weekends. 3h 22m per day 3h 31m per day 3h 26m per day
Physical Therapist Info Physical therapist staff hours per resident per day. 3m per day 4m per day 4m per day
RN (Weekend) Info Registered nurse hours per resident per day on weekends. 16m per day 29m per day 29m per day

Capacity and availability

Medium-capacity home

Offers a balance of services and community atmosphere.

Total beds 124

This home usually has availability

Lower occupancy suggests more openings may be available.

Lower demand than the Michigan average
Occupancy rate 79.7%
Residents per day (avg) 114
Occupancy rate
79.7%
Residents per day (avg)
114

Who this home usually serves

TYPE OF STAY

Primarily short stays

Residents typically stay for brief periods, with frequent admissions and discharges throughout the year.

Might be optimal for
Post-acute recovery Temporary care Transitional stays

Breakdown by payment type

Medicare

5% of new residents, usually for short-term rehab.

Typical stay 1 - 2 months

Private pay

95% of new residents, often for short stays.

Typical stay 4 - 5 months

Finances and operations

Privately-owned community
Operated by a business corporation.
Home revenue
$22.3M
Profit
$585.3K
Privately-owned community Operated by a business corporation.
Home revenue
$22,311,649.00
Profit
$585,319.00
Payroll costs Info The portion of the home's budget spent on staff, including nurses, caregivers, and other employees who support care and operations.
$6.1M
27.2% of revenue
Other operating costs Info All remaining costs needed to run the home, such as food, utilities, building maintenance, supplies and administrative expenses.
$15.7M
Total costs $21.7M
Walk Score
Walk Score: 76 / 100
Very walkable. Most errands can be accomplished on foot, and many essentials are within a short walk.

About this community

Safety & Compliance

Safety Features: Peace of mind with nearly 70 security cameras.

Care Services

Accepts Medicaid
Accepts Medicare
Doctor on Staff
Nursing Services
Rehabilitation Services
Respite Care
Skilled Nursing
24-Hour Staffing

Additional Policies & Features

Pets Allowed

Amenities & Lifestyle

A nonsmoking campus
beauty and barber shop
dining rooms on each floor
a walk to dine program
a charming
well stocked library
a chapel with the original pews and onsite chaplain
religious and non-denominational services
unlimited visiting hours
private lounge for family gatherings
free Wi-Fi
visiting pets are welcome
bird aviary
outdoor courtyard
roof garden and green room
activity programs
peace of mind with nearly 70 security cameras.

Programs & Activities

Activities
Different activities every day of the week.
Specific Programs
24-Hour Nursing Care, Bariatric Care, Case Management, Discharge Planning, and Social Work, Comprehensive Dental Care, Dietary and Nutritional Services, Hospice Care, IV Therapy, Long-Term Care, Occupational Therapy, Ophthalmology, Vision Care, & Audiology Services, Outpatient Therapy, Pain Management, Physical Therapy Services, Podiatry Services, Recreational Therapy, Respite Care Services, Restorative Nursing and Assistance With ADL, Sepsis Program, Short-Term Nursing and Rehabilitation, Speech Therapy, Substance Abuse Management Services, Telemedicine Access, Total Parenteral Nutrition, Tracheostomy Care, Tube Feeding Care, Wound Management.
Religious Services
Religious and non-denominational services.

Pricing & Financial Information

Dining & Nutrition

Food Description
Healthy meals that actually taste great.

What does this home offer?

Minimum age icon
Minimum age icon

Minimum Age: 55

Types of Care at Boulevard Temple Care Center

Nursing Home
Contact Boulevard Temple Care Center

Health Inspection History

Inspections
Total health inspections 5

Michigan average 6.5


Last Health inspection on Jun 2025

Total health citations 19

Michigan average 33.5

Citations per inspection
3.8

Michigan average 5.18


Health citations are formal notices following inspections when they fail to comply with safety and care standards.

13 of 19 citations resulted from standard inspections; 5 of 19 resulted from complaint investigations; and 1 of 19 came from combined inspections (standard and complaint).

Breakdown of citation severity (last 3 years)
Critical Health citations More info 1
233% worse than Michigan average

Michigan average: 0.3


Serious Health citations More info 0
100% better than Michigan average

Michigan average: 1.9

1 critical citation More info Michigan average: 0.3

0 serious citations More info Michigan average: 1.9

18 moderate citations More info Michigan average: 30.8

0 minor citations More info Michigan average: 0.5
Citations history (last 3 years)
Resident Rights moderate citation Info Issues related to resident's rights, including dignity, privacy, and the ability to make decisions about their care. Jun 17, 2025
Corrected

Administration moderate citation Info Issues related to how the facility is managed, including policies, procedures, and compliance with regulations. May 14, 2025
Corrected

Nutrition moderate citation Info Issues related to food quality, meal service, and resident's nutritional needs. May 14, 2025
Corrected

Pharmacy moderate citation Info Issues related to medication management, including how drugs are stored, administered, and monitored. May 14, 2025
Corrected

Compare Nursing Homes around Detroit The information below is reported by the Michigan Department of Licensing and Regulatory Affairs (LARA).

2 facilities compared · CMS & MI Dept. of Health data · Updated Mar 2026

Boulevard Temple Care Center
NH

Nursing Home Licensed facility providing 24/7 skilled nursing care for residents with complex, ongoing medical needs. Staffed by RNs, LPNs, and CNAs. Inspected and star-rated annually by CMS. Accepts Medicare (short-term rehab) and Medicaid (long-term care).

Detroit (Henry Ford)
124
79.7%
+5%
4.49
-52%
+5%
1
19
1
114
76
Dimitrie, Lisa
$21,0M
$6,1M
28.9%
235498
Heritage Manor
AL

Assisted Living A licensed, long-term care setting for seniors or individuals with disabilities who need help with daily activities — like bathing, dressing, and medication management — but not 24-hour skilled nursing. Offers housing, meals, and around-the-clock support while aiming to maximize resident independence.

IL

Independent Living Lifestyle-focused communities for older adults offering dining, activities, and transportation with minimal personal care. Best for active, independent seniors who want community without medical support.

MC

Memory Care Secured, specialized care for people living with Alzheimer's or dementia. Staff trained in cognitive impairment, with higher staff-to-resident ratios and an environment designed to reduce confusion and wandering risk.

NH

Nursing Home Licensed facility providing 24/7 skilled nursing care for residents with complex, ongoing medical needs. Staffed by RNs, LPNs, and CNAs. Inspected and star-rated annually by CMS. Accepts Medicare (short-term rehab) and Medicaid (long-term care).

Detroit (Nardin Park)
122
90.3%
+19%
4.20
-55%
-2%
1
36
1
108
61
Uddin, Fahim
$13,4M
$6,6M
48.9%
235234

Places of interest near Boulevard Temple Care Center

Address 4.7 miles from city center — 0.34 miles to nearest hospital (Fresenius Medical Care at Henry Ford Hospital)

Address 2567 W Grand Blvd, Detroit, MI 48208

Calculate Travel Distance to Boulevard Temple Care Center

Add your location

Address

Staffing Data (Q2 2025)

This data corresponds to Q2 2025 and is based on CMS Payroll-Based Journal.

Total staff 167
Employees 149
Contractors 18
Staff to resident ratio 1.43:1
19% worse than Michigan average

Michigan average ratio: 1.75:1

Avg staff/day 61
Average shift 8 hours
0% compared with Michigan average

Michigan average: 7.9 hours

Total staff hours (quarter) 44,357
Nursing staff breakdown
Registered Nurse

Manages medical care and health needs.

Total count 8
Average shift length Info Average shift length. Calculated as total hours divided by days worked and average staff per day. 9.5 hours

No contractors work on this role.

Licensed Practical Nurse

Assists with medical care and medications.

Total count 27
Average shift length Info Average shift length. Calculated as total hours divided by days worked and average staff per day. 9.3 hours

No contractors work on this role.

Certified Nursing Assistant

Helps with daily care and mobility.

Total count 89
Average shift length Info Average shift length. Calculated as total hours divided by days worked and average staff per day. 7.7 hours

No contractors work on this role.

Contractor staffing

Total hours from contractors

5.6%

2,462 contractor hours this quarter

Speech Language Pathologist: 4 Respiratory Therapy Technician: 3 Physical Therapy Aide: 3 Occupational Therapy Assistant: 3 Physical Therapy Assistant: 2 Medical Director: 1 Clinical Nurse Specialist: 1 Qualified Social Worker: 1
Staff by category
Certified Nursing Assistant 89 0 89 23,536 91 100% 7.7
Licensed Practical Nurse 27 0 27 8,650 91 100% 9.3
Registered Nurse 8 0 8 2,746 91 100% 9.5
Clinical Nurse Specialist 4 1 5 2,004 71 78% 8.3
Other Dietary Services Staff 8 0 8 1,477 89 98% 7.7
RN Director of Nursing 2 0 2 1,007 65 71% 8.7
Speech Language Pathologist 0 4 4 920 72 79% 7.5
Administrator 1 0 1 504 63 69% 8
Respiratory Therapy Technician 0 3 3 503 64 70% 7.7
Mental Health Service Worker 5 0 5 497 51 56% 6.4
Occupational Therapy Aide 1 0 1 496 62 68% 8
Dietitian 1 0 1 496 62 68% 8
Nurse Practitioner 1 0 1 480 60 66% 8
Physical Therapy Aide 0 3 3 468 65 71% 7
Physical Therapy Assistant 0 2 2 412 62 68% 6.6
Occupational Therapy Assistant 0 3 3 70 40 44% 1.7
Qualified Social Worker 0 1 1 40 10 11% 4
Medical Director 0 1 1 36 23 25% 1.6
Dental Services Staff 2 0 2 16 2 2% 7.8
89 Certified Nursing Assistant
% of Days 100%
27 Licensed Practical Nurse
% of Days 100%
8 Registered Nurse
% of Days 100%
5 Clinical Nurse Specialist
% of Days 78%
8 Other Dietary Services Staff
% of Days 98%
2 RN Director of Nursing
% of Days 71%
4 Speech Language Pathologist
% of Days 79%
1 Administrator
% of Days 69%
3 Respiratory Therapy Technician
% of Days 70%
5 Mental Health Service Worker
% of Days 56%
1 Occupational Therapy Aide
% of Days 68%
1 Dietitian
% of Days 68%
1 Nurse Practitioner
% of Days 66%
3 Physical Therapy Aide
% of Days 71%
2 Physical Therapy Assistant
% of Days 68%
3 Occupational Therapy Assistant
% of Days 44%
1 Qualified Social Worker
% of Days 11%
1 Medical Director
% of Days 25%
2 Dental Services Staff
% of Days 2%

Facility Characteristics

Source: CMS Long-Term Care Facility Characteristics (Data as of Jan 2026)

Total census
117 residents
Residents by payment source
Medicare
2 residents (1.7%)
Medicaid
103 residents (88%)
Private pay or other
12 residents (10.3%)
Programs & Services
Residents' Group

Residents meet regularly to discuss policies, care quality, and activities

Active Resident Council

Organized group of residents that meets regularly to discuss facility policies, quality of life, and activities.

Quality of care over time

These measures show how residents usually do over time at this home, based on health outcomes and preventive care.

High-risk clinical events score Info A composite score based on pressure ulcers, falls with injury, weight loss, walking ability decline, and activities of daily living decline. 6.3
26% better than Michigan average

Michigan average: 8.4

Functional decline score Info A composite score based on activities of daily living decline, walking ability decline, and incontinence. 15.5
In line with Michigan average

Michigan average: 16.3

Long-stay resident measures
Significantly above average Michigan avg: 4.2 Info CMS star rating based on long-stay quality measure performance. 5 stars = significantly above average, 1 star = significantly below average.
Need for Help with Daily Activities Increased Info Percent of long-stay residents whose need for help with daily activities has increased 7.8%
37% better than Michigan average

Michigan average: 12.5%

Walking Ability Worsened Info Percent of long-stay residents whose ability to move independently worsened 12.1%
21% better than Michigan average

Michigan average: 15.3%

Low Risk Residents with Bowel/Bladder Incontinence Info Percent of low risk long-stay residents who lose control of their bowels or bladder 26.6%
27% worse than Michigan average

Michigan average: 21.0%

Falls with Major Injury Info Percent of long-stay residents experiencing one or more falls with major injury 0.7%
77% better than Michigan average

Michigan average: 3.2%

High Risk Residents with Pressure Ulcers Info Percent of long-stay high risk residents with pressure ulcers 5.9%
In line with Michigan average

Michigan average: 5.7%

Urinary Tract Infection Info Percent of long-stay residents with a urinary tract infection 0.5%
71% better than Michigan average

Michigan average: 1.7%

Lost Too Much Weight Info Percent of long-stay residents who lose too much weight 4.8%
15% better than Michigan average

Michigan average: 5.7%

Depressive Symptoms Info Percent of long-stay residents who have depressive symptoms 0.0%
100% better than Michigan average

Michigan average: 3.9%

Antipsychotic Use Info Percent of long-stay residents who received an antipsychotic medication 8.1%
46% better than Michigan average

Michigan average: 15.0%

Pneumococcal Vaccine Info Percent of long-stay residents assessed and appropriately given the pneumococcal vaccine 98.3%
In line with Michigan average

Michigan average: 94.9%

Influenza Vaccine Info Percent of long-stay residents assessed and appropriately given the seasonal influenza vaccine 91.2%
In line with Michigan average

Michigan average: 95.0%

Short-stay resident measures
Average Michigan avg: 3.1 Info CMS star rating based on short-stay quality measure performance. 5 stars = much above average, 1 star = much below average.
Pneumococcal Vaccine Info Percent of short-stay residents assessed and appropriately given the pneumococcal vaccine 70.8%
14% worse than Michigan average

Michigan average: 82.5%

Antipsychotic medication increase Info Percent of short-stay residents who newly received an antipsychotic medication 1.3%
9% better than Michigan average

Michigan average: 1.4%

Influenza Vaccine Info Percent of short-stay residents assessed and appropriately given the seasonal influenza vaccine 77.2%
In line with Michigan average

Michigan average: 79.5%

Re-hospitalized after SNF stay Info Percentage of short-stay residents who were re-hospitalized after their nursing home admission. 24.2%
In line with Michigan average

Michigan average: 24.2%

Emergency department visits Info Percentage of short-stay residents who had an outpatient emergency department visit. 3.9%
66% better than Michigan average

Michigan average: 11.5%

Falls with major injury Info Percentage of SNF residents who experience falls with major injury during their stay. 0.0%
100% better than Michigan average

Michigan average: 0.8%

Successful return to home or community Info Rate of successful return to home or community from a skilled nursing facility. 39.1%
23% worse than Michigan average

Michigan average: 50.6%

Penalties and fines

Federal penalties imposed by CMS for regulatory violations, including civil money penalties (fines) and denials of payment for new Medicare/Medicaid admissions.

Source: CMS Penalties Database (Data as of Jan 2026)

Total fines amount $15K
81% lower than Michigan average

Michigan average: $76K

Number of fines 1
51% fewer fines than Michigan average

Michigan average: 2.0

Payment Denials Info Serious action where Medicare and/or Medicaid temporarily stops payments for new residents until issues are fixed. 0
100% fewer payment denials than Michigan average

Michigan average: 0.8

Fines amount comparison
This facility $15K
Michigan average $76K
Penalty History

Penalties are imposed by CMS for violations of federal nursing home regulations.

Civil Money Penalty Info Fines imposed for noncompliance, which can be assessed per day or per instance of violation. Jan 31, 2023
$15K

Last updated: Jan 2026

Guides for Better Senior Living

Care Cost Calculator: See Prices in Your Area

Nursing Home Data Explorer

Don’t Wait Too Long: 7 Red Flag Signs Your Parent Needs Assisted Living Now

The True Cost of Assisted Living in 2025 – And How Families Are Paying For It

Understanding Senior Living Costs: Pricing Models, Discounts & Financial Assistance

Financial Aid for Michigan Seniors

Get financial aid guidance

MI Choice Waiver

Michigan Medicaid MI Choice Waiver

Age 65+ or disabled, Michigan resident, Medicaid- eligible, nursing home-level care need.

~$2,829/month (300% FBR, individual).

$2,000 (individual), $3,000 (couple).

Delivered through regional waiver agents; waitlists possible.

Home Help Program

Michigan Home Help

Age 65+ or disabled, Michigan resident, Medicaid- eligible or low-income.

~$1,732/month (individual, Medicaid threshold).

$2,000 (individual).

Can hire family caregivers; less intensive than waiver.

Program of All-Inclusive Care for the Elderly (PACE)

Michigan PACE

Age 55+, Michigan resident, nursing home-level care need, safe with PACE support.

~$2,829/month (Medicaid-eligible); private pay option available.

$2,000 (individual), $3,000 (couple).

16 PACE centers (e.g., Ingham, Wayne counties); expanding slowly.

Medicare Savings Program (MSP)

Michigan Medicare Savings Program

Age 65+ or disabled, Michigan resident, Medicare Part A/B.

~$2,510/month (QMB), ~$3,380/month (SLMB), ~$3,598/month (QI)—individual.

$9,430 (individual), $14,130 (couple).

Three tiers; no waitlist; includes Extra Help for Part D.

National Family Caregiver Support Program (NFCSP) Respite

Michigan NFCSP Respite Care

Caregivers of 60+ needing care or 55+ caregivers of others; Michigan resident; functional needs (2+ ADLs).

Prioritizes ~$24,980/year (individual); no strict cap.

Not assessed; need-based.

16 AAAs; prioritizes low-income, rural caregivers.

Senior Community Service Employment Program (SCSEP)

Michigan SCSEP

Age 55+, unemployed, low-income, Michigan resident.

~$1,983/month (125% FPL).

Not specified; income-focused.

Priority for veterans, rural residents; Operation ABLE partnership.

VA Aid and Attendance (A&A) and Housebound Benefits

Michigan VA Aid and Attendance/Housebound

Age 65+ or disabled veteran/spouse, Michigan resident, wartime service, need for ADL help (A&A) or homebound.

Net income < ~$1,984/month (veteran with dependent, A&A); pension offsets income.

~$155,356 (net worth limit).

High veteran demand in urban/rural areas.

Tour Icon
Planning a tour? Check our touring checklist.
Chat Icon
Thinking of living here? We can help you speak to a current resident