Crestpark Wynne, LLC
CMS overall rating Info CMS (the Centers for Medicare & Medicaid Services) is the federal agency that rates nursing home quality. Its Overall Rating runs from 1 to 5 stars, combining health inspections, staffing, and quality measures, with inspections weighted most heavily.

Crestpark Wynne, LLC

CMS overall rating Info CMS (the Centers for Medicare & Medicaid Services) is the federal agency that rates nursing home quality. Its Overall Rating runs from 1 to 5 stars, combining health inspections, staffing, and quality measures, with inspections weighted most heavily.
Calculator: See prices in your area
Crestpark Wynne, LLC accepts Medicare, Medicaid, and private pay.

Overview of Crestpark Wynne, LLC

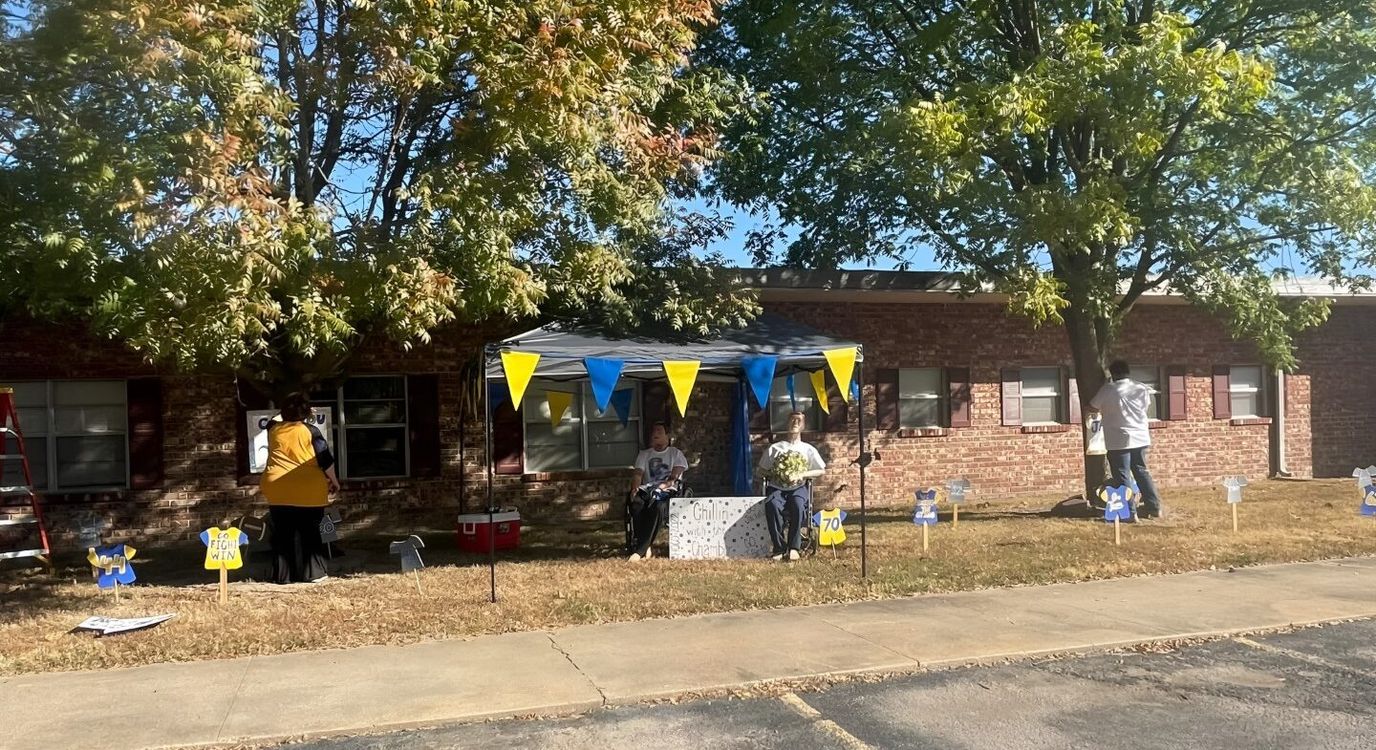
Experience a worry-free retirement at Crestpark Wynne, LLC, a dedicated community in Wynne, AR, offering skilled nursing and rehabilitation. A compassionate and well-trained team provides the highest quality of care tailored to residents’ unique needs around the clock. The community also promotes a nurturing and welcoming environment, ensuring residents feel at ease during their stay.

Physical therapy, occupational therapy, and speech therapy are provided to enhance residents’ living experiences. Healthy meals are important for residents’ wellness, so delicious and well-balanced dining options are provided to meet their dietary needs and preferences. With its comprehensive care and extensive amenities, residents can rest assured of finding the right care to live beyond their potential.

Quality ratings

Measured by Centers for Medicare & Medicaid Services (CMS)

Overall rating Info The Overall CMS Rating combines results from health inspections, staffing levels and quality measures. Health inspections carry the most weight. Staffing and quality scores can increase or decrease the final rating based on performance compared to state and national standards.
Health Inspection Info Based on the results of the facility's three most recent standard inspections and any complaint investigations. CMS reviews the number, scope, and severity of deficiencies, with more recent findings weighted more heavily.
Staffing Info Measures average nursing staff hours per resident per day, including Registered Nurses (RNs) and total nursing staff. Ratings are adjusted based on the level of care residents require and are compared to state and national benchmarks.
Quality Measures Info Based on clinical and physical health indicators reported to CMS, such as hospital readmissions, falls, pressure ulcers, and improvements in mobility. These measures reflect how well residents' health needs are being managed.

Staffing hours breakdown

Info Daily nursing hours per resident by staff type, reported to CMS. Higher is generally better — compare this facility to state and national averages to see where staffing stands.

Hours per resident per day — compared to state averages

Total nursing care / resident Info Total adjusted nursing hours per resident per day, combining RN, LPN, and aide time. CMS adjusts this for case-mix so facilities can be fairly compared.
4h 22m per day
vs avg

2 of 6 metrics below state avg

Standout metric Registered Nurse (RN) is +48% above state avg
Staff typeHours / Day / Residentvs state avg
Registered Nurse (RN) Info RNs hold the highest nursing license and can assess residents, interpret test results, and direct care plans. More RN hours per day often signals stronger clinical oversight and faster response to health changes. 36m per day ▲ 48% State avg: 24m per day · National avg: 41m per day
LPN / LVN Info Licensed Practical Nurses (LPNs) or Licensed Vocational Nurses (LVNs) deliver routine hands-on care — medication administration, wound dressing, and monitoring vital signs. They work under RN supervision and make up a large share of daily bedside care. 1h 11m per day ▲ 25% State avg: 57m per day · National avg: 52m per day
Nurse Aide Info Certified Nurse Aides (CNAs) provide the most direct day-to-day assistance: bathing, dressing, feeding, and mobility. Nurse aide hours are typically the largest staffing category and directly affect residents' quality of life. 2h 33m per day ▼ 7% State avg: 2h 44m per day · National avg: 2h 21m per day
Weekend Total Nursing Info Combined nursing hours (RN + LPN + Nurse Aide) per resident per day on weekends. Staffing often drops on weekends — this figure reveals whether the facility maintains adequate coverage outside of weekday hours. 3h 48m per day ▲ 9% State avg: 3h 29m per day · National avg: 3h 26m per day
Physical Therapist Info Hours per resident per day provided by licensed Physical Therapists (PTs) or PT Assistants. PT services help residents recover mobility after injury or illness and are especially important for post-acute (short-stay) rehabilitation. 0m per day ▼ 93% State avg: 2m per day · National avg: 4m per day
Weekend RN Info Registered nurse hours specifically on weekends. Facilities sometimes reduce RN presence on Saturdays and Sundays — a low weekend RN figure compared to weekday hours can indicate reduced clinical oversight when most administrative staff are absent. 16m per day ■ Avg State avg: 16m per day · National avg: 29m per day

Capacity and availability

Avg. Length of Stay
285 days
Bed community size
137-bed community Rank #39 / 330Bed count — State benchmarkedThis home is ranked 39th out of 330 homes in Arkansas. Shows this facility's certified or reported bed count compared to other Arkansas facilities. Larger communities may offer more amenities, programs, and on-site services for residents and families.Rankings are based only on facilities in Arkansas that report data for that category. Facilities without available data are excluded from the ranking.Click the rank badge to see the full State ranking.Click here to see the full State ranking.
A larger shared setting that may offer more common spaces and organized community services.
Years in operation
17 years in operation
A community with a solid operating history and experience delivering ongoing care.
Walk Score
Walk Score: 43 / 100 Rank #142 / 419Walk Score — State benchmarkedThis home is ranked 142nd out of 419 homes in Arkansas. Shows how walkable this facility's neighborhood is compared to the average Walk Score across Arkansas facilities. Higher scores benefit residents, families, and staff.Rankings are based only on facilities in Arkansas that report data for that category. Facilities without available data are excluded from the ranking.Click the rank badge to see the full State ranking.Click here to see the full State ranking.
Somewhat walkable. A few nearby services may be reachable on foot, but most trips require transportation.
BBB Rating
BBB Rating: A+ (Not Accredited)
An independent rating from the Better Business Bureau based on factors such as complaint history, transparency, and business practices.
How BBB ratings work

About this community

Occupancy

Occupancy rate
28%
Lower than the Arkansas average: 71.3%
Occupied beds
38 / 137
Average occupied beds in Arkansas homes 77 beds

License Details

Facility TypeSkilled Nursing Facility With Dual Certified Beds (medicaid / Medicare)
CountyCross
Business TypeLimited Liability Company
CMS Certification Number45166
Certification TypeMedicaid / Medicare

Ownership & Operating Entity

Crestpark Wynne, LLC is legally operated by Crestpark Wynne, LLC, and administered by Laura Cullen.

Type Of Units

Medicaid and Medicare
137 units
Total beds
137 units

Staffing

Key information about the people who lead and staff this community.

Leadership

ContactMrs. Sarah Crowder, Administrator

Contact Information

Fax870-238-1989

Contact Crestpark Wynne, LLC

Inspection History

In Arkansas, the Department of Human Services, Office of Long Term Care is authorized to conduct unannounced inspections and issue official quality of care reports for all senior living providers.

Since 2023 · 3 years of data 28 deficiencies

Inspection Scorecard Info This scorecard compares key inspection, deficiency, and complaint metrics at this facility against the Arkansas state average. Metrics rated ≥15% worse than average are highlighted in red; those ≥15% better are highlighted in green.

Since 2023 vs. Arkansas state average
Overall vs. AR average 2 Worse Metrics worse than Arkansas average:
• Total deficiencies (33% above)
• Deficiencies per year (33% above)
0 Better No metrics in this bucket.
Latest Inspection July 24, 2025 Routine

Deficiencies Info Deficiencies are formal regulatory issues recorded during state inspections.

This FacilityAR Averagevs. AR Avg
Total deficiencies Info Formal regulatory issues recorded by inspectors across all inspection types. 2821 This facility has 33% more total deficiencies than a typical Arkansas assisted living residence (28 vs. AR avg 21).↑ 33% worse
Deficiencies per year Info Average deficiencies per year since 2023. 9.37 This facility has 33% more deficiencies per year than a typical Arkansas assisted living residence (9.3 vs. AR avg 7).↑ 33% worse

Inspection Reports Summary Info An editor-reviewed summary of the themes and findings across this facility's recent inspection reports.

  • July 24, 2025 annual inspection found 3 deficiencies including failure to implement Enhanced Barrier Precautions for wounds, improper food storage, and missing Payroll Based Journal staffing data for Q2 2025.
  • April 12, 2024 routine inspection identified 8 deficiencies involving late assessments, incomplete care plans, poor hygiene, unsafe fall prevention, food safety violations, and improper disposal of soiled incontinence waste.
  • March 16, 2023 annual inspection cited 4 deficiencies for poor pureed food consistency, unsanitary kitchen and storage areas, inaccurate immunization records, and ineffective pest control.

Health Inspection History

Inspections since 2023
Total health inspections 3

State average N/A


Last Health inspection on Jul 2025

Total health citations
16

State average N/A

Citations per inspection
5.33

State average N/A


Health citations are formal notices following inspections when they fail to comply with safety and care standards.

15 of 16 citations resulted from standard inspections; and 1 of 16 came from combined inspections (standard and complaint).

Breakdown of citation severity (last 3 years)
Critical health citations
0
In line with State average

State average: N/A


Serious health citations
0
In line with State average

State average: N/A

0 critical citations State average: N/A

0 serious citations State average: N/A

16 moderate citations State average: N/A

0 minor citations State average: N/A
Citations history (last 3 years)
Administration moderate citation Jul 24, 2025
Corrected

Infection Control moderate citation Jul 24, 2025
Corrected

Nutrition moderate citation Jul 24, 2025
Corrected

Infection Control moderate citation Apr 12, 2024
Corrected

Staffing Data

Reporting period: October 1 – December 31, 2025 (Q4 2025). Source: CMS Payroll-Based Journal report.

Total staff 74
Employees 68
Contractors 6
Staff to resident ratio 2.06 : 1
0% compared with State average

State average ratio: 0 : 0

Avg staff/day 29
Average shift 7.7 hours
0% compared with State average

State average: 0 hours

Total staff hours (quarter) 20,496

Nursing staff breakdown

Q4 2025 · Oct 1 – Dec 31 More info This data comes from the CMS Payroll-Based Journal report covering October 1 – December 31, 2025.
Registered Nurse

Manages medical care and health needs.

RN Staff Info All 3 RN Staff are full-time employees. No contractors work on this role. 3
Average shift length Info Average shift length. Calculated as total hours divided by days worked and average staff per day. 8.7 hours
Licensed Practical Nurse

Assists with medical care and medications.

LPN Staff Info All 17 LPN Staff are full-time employees. No contractors work on this role. 17
Average shift length Info Average shift length. Calculated as total hours divided by days worked and average staff per day. 8.8 hours
Certified Nursing Assistant

Helps with daily care and mobility.

CNA Staff Info All 30 CNA Staff are full-time employees. No contractors work on this role. 30
Average shift length Info Average shift length. Calculated as total hours divided by days worked and average staff per day. 7.8 hours

Contractor staffing

Q4 2025 · Oct 1 – Dec 31 More info This data comes from the CMS Payroll-Based Journal report covering October 1 – December 31, 2025.

Total hours from contractors

0.9%

185 contractor hours this quarter

Occupational Therapy Assistant: 2 Speech Language Pathologist: 1 Occupational Therapy Aide: 1 Respiratory Therapy Technician: 1 Physical Therapy Aide: 1

Staff by category

Q4 2025 · Oct 1 – Dec 31 More info This data comes from the CMS Payroll-Based Journal report covering October 1 – December 31, 2025.
Certified Nursing Assistant300309,10292100%7.8
Licensed Practical Nurse170173,83192100%8.8
Physical Therapist8083,39092100%7.6
Registered Nurse3031,1237582%8.7
Nurse Practitioner1015446874%8
Administrator1015286672%8
RN Director of Nursing1015286672%8
Dietitian1015055863%8.7
Clinical Nurse Specialist3035036773%7.5
Nurse Aide in Training2022553841%6.4
Speech Language Pathologist0111115459%2.1
Physical Therapy Aide0113544%8.7
Occupational Therapy Aide0112155%4.2
Occupational Therapy Assistant0221022%5
Respiratory Therapy Technician01181314%0.6
Medical Director101311%2.5
30 Certified Nursing Assistant
% of Days 100%
17 Licensed Practical Nurse
% of Days 100%
8 Physical Therapist
% of Days 100%
3 Registered Nurse
% of Days 82%
1 Nurse Practitioner
% of Days 74%
1 Administrator
% of Days 72%
1 RN Director of Nursing
% of Days 72%
1 Dietitian
% of Days 63%
3 Clinical Nurse Specialist
% of Days 73%
2 Nurse Aide in Training
% of Days 41%
1 Speech Language Pathologist
% of Days 59%
1 Physical Therapy Aide
% of Days 4%
1 Occupational Therapy Aide
% of Days 5%
2 Occupational Therapy Assistant
% of Days 2%
1 Respiratory Therapy Technician
% of Days 14%
1 Medical Director
% of Days 1%

Penalties and fines

Federal penalties imposed by CMS for regulatory violations, including civil money penalties (fines) and denials of payment for new Medicare/Medicaid admissions.

Source: CMS Penalties Database

No penalties in the past 3 years

No civil money penalties or payment denials were reported in the last 3 years.

Quality of care over time

These measures show how residents usually do over time at this home, based on health outcomes and preventive care.

High-risk clinical events score Info A composite score based on pressure ulcers, falls with injury, weight loss, walking ability decline, and activities of daily living decline. 8.8
14% worse than State average

State average: 7.7

Functional decline score Info A composite score based on activities of daily living decline, walking ability decline, and incontinence. 14.5
9% worse than State average

State average: 13.3

Long-stay resident measures
Below average State avg: 4.2 Info CMS star rating based on long-stay quality measure performance. 5 stars = significantly above average, 1 star = significantly below average.
Need for Help with Daily Activities Increased Info Percent of long-stay residents whose need for help with daily activities has increased 11.6%
In line with State average

State average: 11.5%

Walking Ability Worsened Info Percent of long-stay residents whose ability to move independently worsened 19.4%
45% worse than State average

State average: 13.4%

Low Risk Residents with Bowel/Bladder Incontinence Info Percent of low risk long-stay residents who lose control of their bowels or bladder 12.5%
17% better than State average

State average: 15.1%

Falls with Major Injury Info Percent of long-stay residents experiencing one or more falls with major injury 6.5%
65% worse than State average

State average: 3.9%

High Risk Residents with Pressure Ulcers Info Percent of long-stay high risk residents with pressure ulcers 5.4%
13% worse than State average

State average: 4.7%

Urinary Tract Infection Info Percent of long-stay residents with a urinary tract infection 2.2%
74% worse than State average

State average: 1.3%

Lost Too Much Weight Info Percent of long-stay residents who lose too much weight 1.0%
80% better than State average

State average: 5.0%

Depressive Symptoms Info Percent of long-stay residents who have depressive symptoms 0.0%
100% better than State average

State average: 1.5%

Antipsychotic Use Info Percent of long-stay residents who received an antipsychotic medication 11.9%
14% worse than State average

State average: 10.5%

Pneumococcal Vaccine Info Percent of long-stay residents assessed and appropriately given the pneumococcal vaccine 100.0%
6% better than State average

State average: 94.4%

Influenza Vaccine Info Percent of long-stay residents assessed and appropriately given the seasonal influenza vaccine 100.0%
In line with State average

State average: 96.2%

Hospitalizations per 1,000 days Info Number of hospitalizations per 1,000 long-stay resident days. 2.48
26% worse than State average

State average: 1.97

ED visits per 1,000 days Info Number of outpatient emergency department visits per 1,000 long-stay resident days. 4.02
84% worse than State average

State average: 2.18

Short-stay resident measures
Pneumococcal Vaccine Info Percent of short-stay residents assessed and appropriately given the pneumococcal vaccine 100.0%
24% better than State average

State average: 80.9%

Breakdown by payment type

Medicare

48% of new residents, usually for short-term rehab.

Typical stay 16 days

Private pay

32% of new residents, often for short stays.

Typical stay 4 - 5 months

Medicaid

20% of new residents, often for long-term daily care.

Typical stay 2 - 3 years

Facility Characteristics

Source: CMS Long-Term Care Facility Characteristics (Data as of Jan 2026)

Total residents 36
Medicare
2
5.6% of residents
Medicaid
23
63.9% of residents
Private pay or other
11
30.6% of residents
Programs & Services
Nurse Aide Training

State-approved Nurse Aide Training and Competency Evaluation Program on-site

Finances and operations

Based on CMS SNF Cost Report for fiscal year ending in 12/2023.

For-profit
Operated by a single business entity.
Net patient revenue Info Net patient revenue — what the home actually collects for resident care, after contractual allowances, bad debt and discounts are subtracted from its gross charges (CMS cost report, Worksheet G-3). It covers resident care only; money the home earns from other sources is shown separately as "Other income."
$4.0M
Net patient income Info Net patient income: net patient revenue minus the home's total operating expenses. A positive figure means it earns more from resident care than it spends to deliver it; a negative figure means the opposite. It excludes non-operating "other income."
-$322.9K
For-profit Operated by a single business entity.
Net patient revenue Info Net patient revenue — what the home actually collects for resident care, after contractual allowances, bad debt and discounts are subtracted from its gross charges (CMS cost report, Worksheet G-3). It covers resident care only; money the home earns from other sources is shown separately as "Other income."
$4.0M
Net patient income Info Net patient income: net patient revenue minus the home's total operating expenses. A positive figure means it earns more from resident care than it spends to deliver it; a negative figure means the opposite. It excludes non-operating "other income."
-$322.9K
Other income Info Money the home earns outside of resident care — such as investments, grants, rentals and other non-operating sources (CMS cost report, Worksheet G-3). It is tracked separately from net patient revenue: it is not part of that figure, and it is not included in net patient income.
$837.2K
Payroll costs Info Staff salaries plus wage-related costs — benefits such as payroll taxes, health insurance and retirement — from the home's own accounting records (CMS cost report, Worksheet A). Contract or agency labor is counted separately, under other operating costs.
$2.2M 53.6% of net patient revenue Info Payroll as a share of revenue: staff salaries and wage-related benefits divided by net patient revenue. A higher figure means more of each revenue dollar goes to staff pay.
Other operating costs Info Everything it costs to run the home apart from payroll — food, utilities, supplies, maintenance, contract labor and administration. Calculated as total operating expense minus payroll (staff salaries and wage-related benefits).
$2.2M
Total costs Info The home's total operating expense for the year — all the costs of running it, salaries included (CMS cost report, Worksheet G-3).
$4.4M

What does this home offer?

Building type icon
Building type icon

Building Type: Single-story

Beauty services icon

Beauty Services

Housekeeping icon
Housekeeping icon

Housekeeping Services

On-site medical care and health services icon

On-site Medical Care and Health Services

Who this home usually serves

TYPE OF STAY

Mostly short-term rehab stays

Most residents typically stay for a few weeks or months before returning home or moving on.

New residents most often arrive under Medicare (48% of admissions), and a typical Medicare stay runs around 16 days.

Admissions
56 total

Coverage residents most often arrive under.

Medicare 48%
Private pay 32%
Medicaid 20%
Discharges
48 total

Coverage residents most often leave under.

Medicare 23%
Private pay 50%
Medicaid 27%

Places of interest near Crestpark Wynne, LLC

Address 0.4 miles from city center Info Estimated distance in miles from Wynne's city center to Crestpark Wynne, LLC's address, calculated via Google Maps.

Calculate Travel Distance to Crestpark Wynne, LLC

Add your location

Address

Compare Nursing Homes around the area

The information below is reported by the Arkansas Department of Human Services, Office of Long Term Care.

Crestpark Wynne, LLC
NH
Wynne -137 A+ 43 -
Butterfield Trail Village
NH
AL
IL
Fayetteville (East Joyce Boulevard) -87 A+ 39 Studio / 1 Bed / 2 Bed
Barnes Healthcare
NH
MC
Lonoke -141 A+ 38 Private / Shared Rooms
The Green House Cottages of Poplar Grove
NH
HC
MC
RC
Little Rock (Leander) -120 A+ 31 Private Rooms / Semi-Private Rooms
Timberlane Health & Rehab
NH
MC
RC
El Dorado -106 A+ 33 -

Frequently Asked Questions about Crestpark Wynne, LLC

Is Crestpark Wynne, LLC in a walkable area?

Crestpark Wynne, LLC has a walk score of 43. Somewhat walkable. A few nearby services may be reachable on foot, but most trips require transportation.

What is the occupancy rate at Crestpark Wynne, LLC?

Crestpark Wynne, LLC's occupancy is 28%.

Does Crestpark Wynne, LLC operate as a for-profit or non-profit?

Crestpark Wynne, LLC is registered as a for-profit in AR.

Who is the administrator of Crestpark Wynne, LLC?

Laura Cullen is the administrator of Crestpark Wynne, LLC.

How many beds does Crestpark Wynne, LLC have?

Crestpark Wynne, LLC has 137 beds.

Are there photos of Crestpark Wynne, LLC?

Yes — there are 5 photos of Crestpark Wynne, LLC in the photo gallery on this page.

What is the address of Crestpark Wynne, LLC?

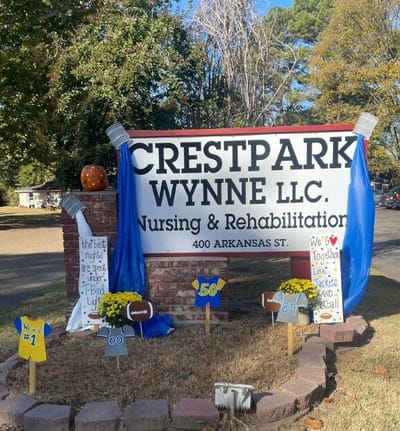
Crestpark Wynne, LLC is located at 400 Arkansas Street, Wynne, AR 72396.

Guides for Better Senior Living

Care Cost Calculator: See Prices in Your Area

Nursing Home Data Explorer

Don’t Wait Too Long: 7 Red Flag Signs Your Parent Needs Assisted Living Now

The True Cost of Assisted Living in 2025 – And How Families Are Paying For It

Understanding Senior Living Costs: Pricing Models, Discounts & Financial Assistance