Renewity Residential Assisted Living
Nursing Home & Assisted Living · Indiana, IN
CMS overall rating Info The Overall CMS Rating is scored from 1 to 5 stars and combines results from health inspections, staffing levels, and quality measures. Health inspections carry the most weight. Staffing and quality scores can increase or decrease the final rating based on performance compared to state and national standards.

Renewity Residential Assisted Living

Nursing Home & Assisted Living · Indiana, IN
CMS overall rating Info The Overall CMS Rating is scored from 1 to 5 stars and combines results from health inspections, staffing levels, and quality measures. Health inspections carry the most weight. Staffing and quality scores can increase or decrease the final rating based on performance compared to state and national standards.
Calculator: See prices in your area
Renewity Residential Assisted Living accepts Medicare, Medicaid, and private pay.

Overview of Renewity Residential Assisted Living

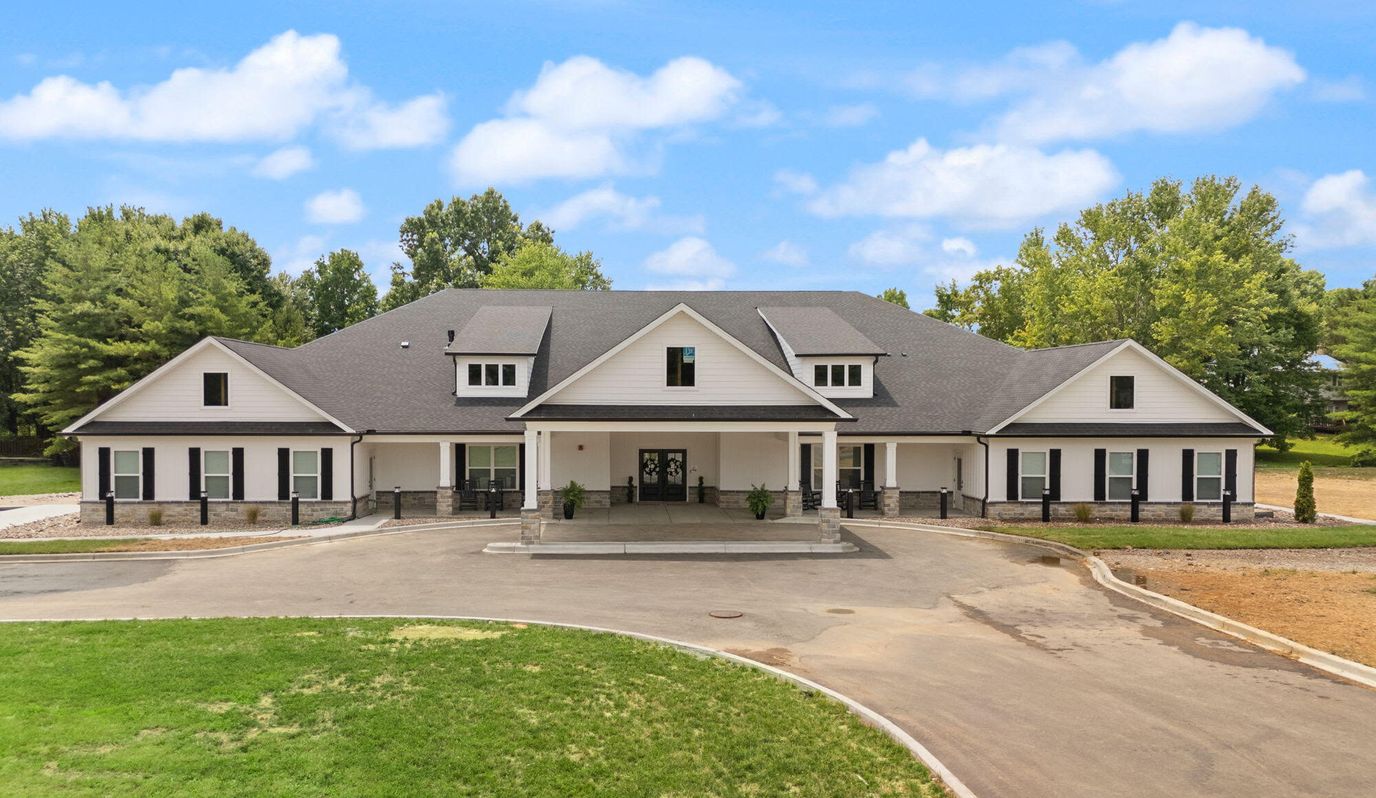
Beautifully set in the harmonious neighborhood of New Albany, IN, Renewity Residential Assisted Living is a blissful retreat that offers assisted living. This 20-bed community strives to keep residents comfortable, providing top-tier care tailored to their unique needs around the clock. Residents can also ease their worries, with one caregiver assigned for every five of them.Featuring The Tovertafel and a variety of fun activities, the community promotes an active and vibrant lifestyle for residents’ recreation and wellness. Delicious and well-balanced home-cooked meals are also served to ensure residents have a hassle-free dining experience that cater to their dietary needs and preferences. With its intimate and nurturing setting, residents are guaranteed the utmost care and comfort they deserve.

Quality ratings

Measured by Centers for Medicare & Medicaid Services (CMS)

Overall rating Info The Overall CMS Rating combines results from health inspections, staffing levels and quality measures. Health inspections carry the most weight. Staffing and quality scores can increase or decrease the final rating based on performance compared to state and national standards.
▼ 35.2% Below IN avg. ▼ 35.2% Below IN avg.Click the badge to see the full State ranking.Click here to see the full State ranking.
Health Inspection Info Based on the results of the facility's three most recent standard inspections and any complaint investigations. CMS reviews the number, scope, and severity of deficiencies, with more recent findings weighted more heavily.
▼ 64.4% Below IN avg. ▼ 64.4% Below IN avg.Click the badge to see the full State ranking.Click here to see the full State ranking.
Staffing Info Measures average nursing staff hours per resident per day, including Registered Nurses (RNs) and total nursing staff. Ratings are adjusted based on the level of care residents require and are compared to state and national benchmarks.
▼ 18.6% Below IN avg. ▼ 18.6% Below IN avg.Click the badge to see the full State ranking.Click here to see the full State ranking.
Quality Measures Info Based on clinical and physical health indicators reported to CMS, such as hospital readmissions, falls, pressure ulcers, and improvements in mobility. These measures reflect how well residents' health needs are being managed.
▲ 22.3% Above IN avg. ▲ 22.3% Above IN avg.Click the badge to see the full State ranking.Click here to see the full State ranking.

Staffing hours breakdown

Info Daily nursing hours per resident by staff type, reported to CMS. Higher is generally better — compare this facility to state and national averages to see where staffing stands.

Hours per resident per day — compared to Indiana state averages

Total nursing care / resident Info Total adjusted nursing hours per resident per day, combining RN, LPN, and aide time. CMS adjusts this for case-mix so facilities can be fairly compared.
2h 58m per day
This facility Indiana avg (3h 26m per day)
vs Indiana avg
-14%
Staff typeHours / Day / Residentvs state avg
Total Nursing (Weekend) Info Combined nursing hours (RN + LPN + Nurse Aide) per resident per day on weekends. Staffing often drops on weekends — this figure reveals whether the facility maintains adequate coverage outside of weekday hours. 2h 47m per day

Capacity and availability

This home usually has limited availability

Occupancy between 85% and 95% suggests balanced demand.

Higher occupancy than the Indiana average: 69.4%
Occupancy rate 91.3%
Avg. Length of Stay 112 days
Occupancy rate
91.3%
Avg. Length of Stay
112 days

Who this home usually serves

TYPE OF STAY

Mostly long-term care residents

Most residents stay for extended periods and receive ongoing daily care.

Breakdown by payment type

Medicare

16% of new residents, usually for short-term rehab.

Typical stay 24 days

Private pay

27% of new residents, often for short stays.

Typical stay 3 months

Medicaid

56% of new residents, often for long-term daily care.

Typical stay 5 - 6 months

Finances and operations

Privately-owned community
Operated by a business corporation.
Home revenue
$16.2M
Profit
$395.7K
Privately-owned community Operated by a business corporation.
Home revenue
$16.2M
Profit
$395.7K
Payroll costs Info The portion of the home's budget spent on staff, including nurses, caregivers, and other employees who support care and operations.
$5.9M
36.4% of revenue
Other operating costs Info All remaining costs needed to run the home, such as food, utilities, building maintenance, supplies and administrative expenses.
$401.9K
Total costs $6.3M
Walk Score
Walk Score: 0 / 100
Car-dependent. Most errands require a car, with limited nearby walkable options.

What does this home offer?

Housing options icon

Housing Options: Suites

Staff to resident icon

Staff to Resident Ratio: 1 Staff : 5 Residents

Building type icon
Building type icon

Building Type: Single-story

Dining services icon

Dining Services

Beauty services icon

Beauty Services

Social and recreational activities icon

Social and Recreational Activities

Exercise program icon

Exercise Programs

Types of Care at Renewity Residential Assisted Living

Assisted Living

Contact Renewity Residential Assisted Living

Health Inspection History

Inspections Since 2023
Total health inspections 11

Indiana average 6


Last Health inspection on Nov 2025

Total health citations
41

Indiana average 25

Citations per inspection
3.73

Indiana average 4.12


Health citations are formal notices following inspections when they fail to comply with safety and care standards.

19 of 41 citations resulted from standard inspections; 17 of 41 resulted from complaint investigations; and 5 of 41 came from combined inspections (standard and complaint).

Breakdown of citation severity (last 3 years)
Critical Health citations
0
100% better than Indiana average

Indiana average: 0.2


Serious Health citations
0
100% better than Indiana average

Indiana average: 0.6

0 critical citations Indiana average: 0.2

0 serious citations Indiana average: 0.6

41 moderate citations Indiana average: 23.8

0 minor citations Indiana average: 0.4
Citations history (last 3 years)
Environmental moderate citation Nov 13, 2025
Corrected

Pharmacy moderate citation Sep 08, 2025
Corrected

Pharmacy moderate citation Jun 02, 2025
Corrected

Nutrition moderate citation May 08, 2025
Corrected

Financial Assistance for
Nursing Home in Indiana

Renewity Residential Assisted Living is located in New Albany, Indiana.
Here are the financial assistance programs available to residents in Indiana.

Get Financial aid guidance

Aged and Disabled Waiver

Indiana Medicaid A&D Waiver

Age 65+ or disabled
General Indiana resident, Medicaid-eligible, nursing home-level care need.
Income Limits (2025) ~$2,829/month 300% FBR, individual
Asset Limits $2,000 (individual), $3,000 (couple).
IN

Requires level-of-care determination.

Benefits
Personal care (5-7 hours/day) Respite (240 hours/year) Adult day care (~$60/day) Home health services

CHOICE Program

Indiana CHOICE

Age 60+
General Indiana resident, at risk of nursing home.
Income Limits ~$2,000/month varies
Asset Limits $10,000 individual
IN

Limited funding; regional variation.

Benefits
In-home care (3-5 hours/week) Respite (up to 10 days/year) Transportation (~5 trips/month)

Residential Care Assistance Program (RCAP)

Indiana Residential Care Assistance Program

Age 65+
General or blind, or disabled, Indiana resident, in approved facility, low-income or SSI recipient.
Income Limits (2025) ~$1,004/month including SSI
Asset Limits $2,000 (individual), $3,000 (couple).
IN

~50 facilities statewide; per diem rate set by FSSA.

Benefits
Room/board Laundry Minimal care coordination (~$20-$50/day subsidy)

Medicare Savings Program (MSP)

Indiana Medicare Savings Program

Age 65+ or disabled
General Indiana resident, Medicare Part A/B.
Income Limits (2025) ~$2,510/month (QMB), ~$3,380/month (SLMB), ~$3,598/month (QI)—individual.
Asset Limits $9,430 (individual), $14,130 (couple).
IN

Three tiers; no waitlist.

Benefits
Covers Part B premiums ($174.70/month) Deductibles ($240/year) Copays (~20%)

National Family Caregiver Support Program (NFCSP) Respite

Indiana NFCSP Respite Care

Age
General Caregivers of 60+ needing care or 55+ caregivers of others; Indiana resident; functional needs (2+ ADLs).
Income Limits (2025) Prioritizes ~$24,980/year (individual); no strict cap.
Asset Limits Not assessed; need-based.
IN

16 AAAs; prioritizes low-income, rural caregivers.

Benefits
Respite (4-6 hours/week or 5 days/year) Adult day care ($60/day) Caregiver training

VA Aid and Attendance (A&A) and Housebound Benefits

Indiana VA Aid and Attendance/Housebound

Age 65+ or disabled veteran/spouse
General Indiana resident, wartime service, need for ADL help (A&A) or homebound.
Income Limits (2025) Net income < ~$1,984/month (veteran with dependent, A&A); pension offsets income.
Asset Limits ~$155,356 net worth limit
IN

High veteran demand statewide.

Benefits
Cash (~$1,433-$2,642/month veteran, ~$951-$1,318 spouse) for care costs (e.g., in-home, assisted living)

Places of interest near Renewity Residential Assisted Living

Address 5.5 miles from city center Info Estimated distance in miles from New Albany's city center to Renewity Residential Assisted Living's address, calculated via Google Maps.

Calculate Travel Distance to Renewity Residential Assisted Living

Add your location

Address

Staffing Data

Reporting period: April 1 – June 30, 2025 (Q2 2025). Source: CMS Payroll-Based Journal report.

Total staff 128
Employees 106
Contractors 22
Staff to resident ratio 1.35:1
1347268% better than Indiana average
Indiana average ratio: 0.00:1 Indiana average ratio: 0.00:1See full Indiana ranking
Avg staff/day 43
Average shift 8.4 hours
9% better than Indiana average
Indiana average: 7.7 hours Indiana average shift: 7.7 hoursSee full Indiana ranking
Total staff hours (quarter) 33,056

Nursing staff breakdown

Q2 2025 · Apr 1 – Jun 30 More info This data comes from the CMS Payroll-Based Journal report covering April 1 – June 30, 2025.
Registered Nurse

Manages medical care and health needs.

Total count 9
Average shift length Info Average shift length. Calculated as total hours divided by days worked and average staff per day. 10.4 hours

No contractors work on this role.

Licensed Practical Nurse

Assists with medical care and medications.

Total count 15
Average shift length Info Average shift length. Calculated as total hours divided by days worked and average staff per day. 9.1 hours

No contractors work on this role.

Certified Nursing Assistant

Helps with daily care and mobility.

Total count 49
Average shift length Info Average shift length. Calculated as total hours divided by days worked and average staff per day. 8.9 hours

No contractors work on this role.

Contractor staffing

Q2 2025 · Apr 1 – Jun 30 More info This data comes from the CMS Payroll-Based Journal report covering April 1 – June 30, 2025.

Total hours from contractors

6.9%

2,297 contractor hours this quarter

Respiratory Therapy Technician: 6 Qualified Social Worker: 6 Physical Therapy Assistant: 3 Speech Language Pathologist: 3 Physical Therapy Aide: 3 Medical Director: 1

Staff by category

Q2 2025 · Apr 1 – Jun 30 More info This data comes from the CMS Payroll-Based Journal report covering April 1 – June 30, 2025.
Certified Nursing Assistant4904916,71691100%8.9
Licensed Practical Nurse150155,10791100%9.1
Registered Nurse9092,45191100%10.4
Clinical Nurse Specialist9091,5706875%8.1
Medication Aide/Technician4041,0487987%9.9
Other Dietary Services Staff6061,0389099%6.6
Qualified Social Worker0665656976%6.5
Administrator1015126470%8
Nurse Practitioner1015126470%8
Dietitian1014906268%7.9
Speech Language Pathologist0334886673%6.6
Dental Services Staff2024746774%7
Physical Therapy Assistant0334337380%5.9
Respiratory Therapy Technician0664167481%5.3
Mental Health Service Worker1013725560%6.8
Physical Therapy Aide0333476167%5.5
Occupational Therapy Aide1012893741%7.8
RN Director of Nursing202915358%1.5
Medical Director0114889%6
Occupational Therapy Assistant1014767%7.8
Nurse Aide in Training4044578%5
49 Certified Nursing Assistant
% of Days 100%
15 Licensed Practical Nurse
% of Days 100%
9 Registered Nurse
% of Days 100%
9 Clinical Nurse Specialist
% of Days 75%
4 Medication Aide/Technician
% of Days 87%
6 Other Dietary Services Staff
% of Days 99%
6 Qualified Social Worker
% of Days 76%
1 Administrator
% of Days 70%
1 Nurse Practitioner
% of Days 70%
1 Dietitian
% of Days 68%
3 Speech Language Pathologist
% of Days 73%
2 Dental Services Staff
% of Days 74%
3 Physical Therapy Assistant
% of Days 80%
6 Respiratory Therapy Technician
% of Days 81%
1 Mental Health Service Worker
% of Days 60%
3 Physical Therapy Aide
% of Days 67%
1 Occupational Therapy Aide
% of Days 41%
2 RN Director of Nursing
% of Days 58%
1 Medical Director
% of Days 9%
1 Occupational Therapy Assistant
% of Days 7%
4 Nurse Aide in Training
% of Days 8%

Facility Characteristics

Source: CMS Long-Term Care Facility Characteristics (Data as of Jan 2026)

Total residents 95
Medicare
2
2.1% of residents
Medicaid
87
91.6% of residents
Private pay or other
6
6.3% of residents
Programs & Services
Residents Group

Residents meet regularly to discuss policies, care quality, and activities

Active Resident Council

Organized group of residents that meets regularly to discuss facility policies, quality of life, and activities.

Quality of care over time

These measures show how residents usually do over time at this home, based on health outcomes and preventive care.

High-risk clinical events score Info A composite score based on pressure ulcers, falls with injury, weight loss, walking ability decline, and activities of daily living decline. 3.1
62% better than Indiana average

Indiana average: 8.0

Functional decline score Info A composite score based on activities of daily living decline, walking ability decline, and incontinence. 11.8
31% better than Indiana average

Indiana average: 17.1

Long-stay resident measures
Need for Help with Daily Activities Increased Info Percent of long-stay residents whose need for help with daily activities has increased 2.9%
76% better than Indiana average

Indiana average: 12.0%

Walking Ability Worsened Info Percent of long-stay residents whose ability to move independently worsened 4.3%
70% better than Indiana average

Indiana average: 14.4%

Low Risk Residents with Bowel/Bladder Incontinence Info Percent of low risk long-stay residents who lose control of their bowels or bladder 28.2%
15% worse than Indiana average

Indiana average: 24.6%

Falls with Major Injury Info Percent of long-stay residents experiencing one or more falls with major injury 2.1%
46% better than Indiana average

Indiana average: 3.9%

High Risk Residents with Pressure Ulcers Info Percent of long-stay high risk residents with pressure ulcers 4.2%
In line with Indiana average

Indiana average: 4.4%

Urinary Tract Infection Info Percent of long-stay residents with a urinary tract infection 0.3%
79% better than Indiana average

Indiana average: 1.2%

Lost Too Much Weight Info Percent of long-stay residents who lose too much weight 1.8%
68% better than Indiana average

Indiana average: 5.7%

Depressive Symptoms Info Percent of long-stay residents who have depressive symptoms 71.5%
196% worse than Indiana average

Indiana average: 24.1%

Antipsychotic Use Info Percent of long-stay residents who received an antipsychotic medication 15.9%
28% worse than Indiana average

Indiana average: 12.4%

Pneumococcal Vaccine Info Percent of long-stay residents assessed and appropriately given the pneumococcal vaccine 68.0%
27% worse than Indiana average

Indiana average: 93.7%

Influenza Vaccine Info Percent of long-stay residents assessed and appropriately given the seasonal influenza vaccine 98.0%
In line with Indiana average

Indiana average: 95.4%

Short-stay resident measures
Pneumococcal Vaccine Info Percent of short-stay residents assessed and appropriately given the pneumococcal vaccine 32.9%
60% worse than Indiana average

Indiana average: 81.7%

Antipsychotic medication increase Info Percent of short-stay residents who newly received an antipsychotic medication 0.0%
100% better than Indiana average

Indiana average: 1.4%

Influenza Vaccine Info Percent of short-stay residents assessed and appropriately given the seasonal influenza vaccine 36.2%
54% worse than Indiana average

Indiana average: 79.0%

Penalties and fines

Federal penalties imposed by CMS for regulatory violations, including civil money penalties (fines) and denials of payment for new Medicare/Medicaid admissions.

Source: CMS Penalties Database (Data as of Jan 2026)

Total fines amount $10K
64% lower than Indiana average

Indiana average: $27K

Number of fines 1
28% fewer fines than Indiana average

Indiana average: 1.4

Payment Denials Info Serious action where Medicare and/or Medicaid temporarily stops payments for new residents until issues are fixed. 0
100% fewer payment denials than Indiana average

Indiana average: 0.4

Fines amount comparison
This facility $10K
Indiana average $27K

No penalties in the past 3 years

No civil money penalties or payment denials were reported in the last 3 years.

Guides for Better Senior Living

Care Cost Calculator: See Prices in Your Area

Nursing Home Data Explorer

Don’t Wait Too Long: 7 Red Flag Signs Your Parent Needs Assisted Living Now

The True Cost of Assisted Living in 2025 – And How Families Are Paying For It

Understanding Senior Living Costs: Pricing Models, Discounts & Financial Assistance

Frequently Asked Questions about Renewity Residential Assisted Living

What neighborhood is Renewity Residential Assisted Living in?

Renewity Residential Assisted Living is in the Blackiston Mill neighborhood.

What is the address of Renewity Residential Assisted Living?

Renewity Residential Assisted Living is located at 3755 St Joseph Rd, New Albany, IN 47150, United States.

What is the phone number of Renewity Residential Assisted Living?

(502) 758-1978 will put you in contact with the team at Renewity Residential Assisted Living.

Is Renewity Residential Assisted Living Medicare or Medicaid certified?

Yes — Renewity Residential Assisted Living is a CMS-certified provider of Medicare and Medicaid.

Explore Open Rooms
1 Contact details
2 What type of senior care service are you looking for?
3 What budget do you have in mind for senior care?
4 How soon do you need to find care?
5 Additional details

Thank you for your interest!

Our team will be in touch shortly to help with next steps.