Maple Hills Skilled Nursing & Rehabilitation
CMS overall rating Info CMS (the Centers for Medicare & Medicaid Services) is the federal agency that rates nursing home quality. Its Overall Rating runs from 1 to 5 stars, combining health inspections, staffing, and quality measures, with inspections weighted most heavily.

Maple Hills Skilled Nursing & Rehabilitation

CMS overall rating Info CMS (the Centers for Medicare & Medicaid Services) is the federal agency that rates nursing home quality. Its Overall Rating runs from 1 to 5 stars, combining health inspections, staffing, and quality measures, with inspections weighted most heavily.
Calculator: See prices in your area
Maple Hills Skilled Nursing & Rehabilitation accepts Medicare, Medicaid, and private pay.

Overview of Maple Hills Skilled Nursing & Rehabilitation

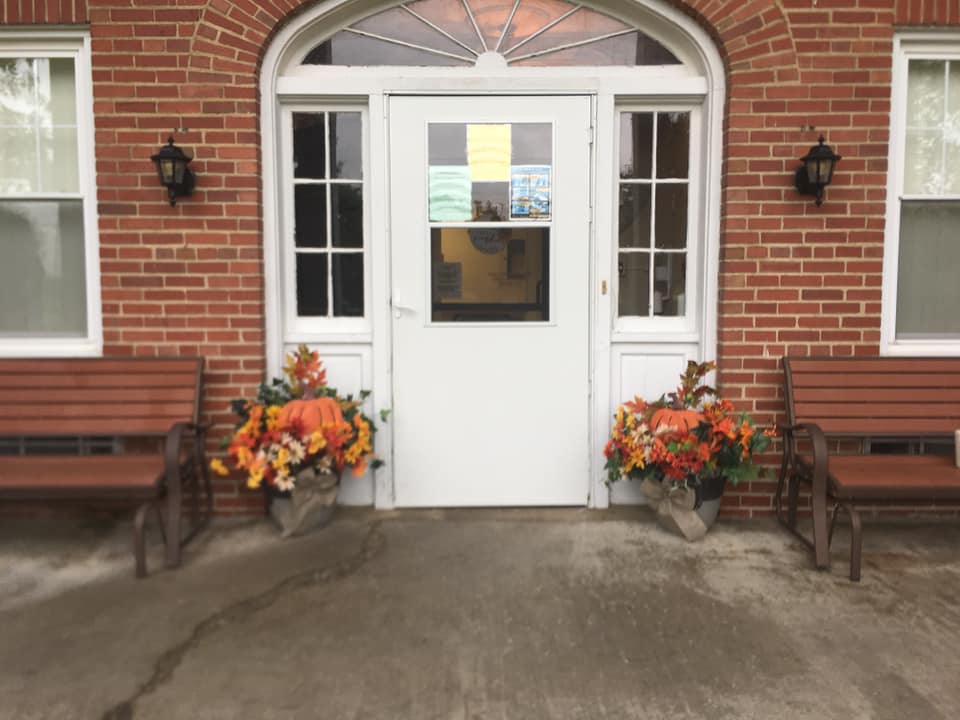
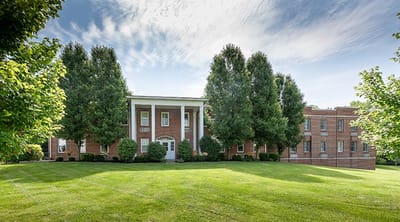
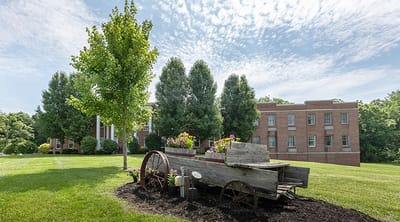
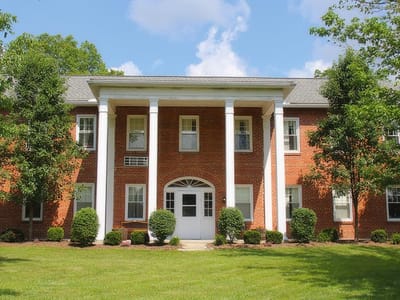
Nestled in the serene neighborhood of McArthur, OH, Maple Hills Skilled Nursing & Rehabilitation is an outstanding nursing home that offers rehabilitation and skilled nursing. The community strives to meet healthcare needs through exceptional support provided around the clock. Medicare and Medicaid are also accepted to ease residents’ financial burdens.

Arts and crafts, social events, and light exercises ensure residents maintain an active lifestyle and remain socially engaged. Physical, occupational, and speech therapy are also available to help residents recover without hassles. The community is a great choice for those seeking comprehensive care to live to their potential in retirement.

Quality ratings

Measured by Centers for Medicare & Medicaid Services (CMS)

Overall rating Info The Overall CMS Rating combines results from health inspections, staffing levels and quality measures. Health inspections carry the most weight. Staffing and quality scores can increase or decrease the final rating based on performance compared to state and national standards.
Health Inspection Info Based on the results of the facility's three most recent standard inspections and any complaint investigations. CMS reviews the number, scope, and severity of deficiencies, with more recent findings weighted more heavily.
Staffing Info Measures average nursing staff hours per resident per day, including Registered Nurses (RNs) and total nursing staff. Ratings are adjusted based on the level of care residents require and are compared to state and national benchmarks.
Quality Measures Info Based on clinical and physical health indicators reported to CMS, such as hospital readmissions, falls, pressure ulcers, and improvements in mobility. These measures reflect how well residents' health needs are being managed.

Staffing hours breakdown

Info Daily nursing hours per resident by staff type, reported to CMS. Higher is generally better — compare this facility to state and national averages to see where staffing stands.

Hours per resident per day — compared to state averages

Total nursing care / resident Info Total adjusted nursing hours per resident per day, combining RN, LPN, and aide time. CMS adjusts this for case-mix so facilities can be fairly compared.
2h 41m per day
Rank #201 / 210Nurse hours — State benchmarkedThis home is ranked 201st out of 210 homes in Ohio. Shows adjusted nurse hours per resident per day benchmarked to the Ohio average, with a ranking across 210 Ohio facilities. More hours mean more direct care. The national average is about 3.5 hrs; below 3.0 is a red flag.Rankings are based only on facilities in Ohio that report data for that category. Facilities without available data are excluded from the ranking.Click the rank badge to see the full State ranking.Click here to see the full State ranking.
vs avg

4 of 6 metrics below state avg

Standout metric Registered Nurse (RN) is +64% above state avg
Staff typeHours / Day / Residentvs state avg
Registered Nurse (RN) Info RNs hold the highest nursing license and can assess residents, interpret test results, and direct care plans. More RN hours per day often signals stronger clinical oversight and faster response to health changes. 1h 2m per day ▲ 64% State avg: 38m per day · National avg: 41m per day
LPN / LVN Info Licensed Practical Nurses (LPNs) or Licensed Vocational Nurses (LVNs) deliver routine hands-on care — medication administration, wound dressing, and monitoring vital signs. They work under RN supervision and make up a large share of daily bedside care. 26m per day ▼ 55% State avg: 58m per day · National avg: 52m per day
Nurse Aide Info Certified Nurse Aides (CNAs) provide the most direct day-to-day assistance: bathing, dressing, feeding, and mobility. Nurse aide hours are typically the largest staffing category and directly affect residents' quality of life. 1h 37m per day ▼ 24% State avg: 2h 8m per day · National avg: 2h 21m per day
Weekend Total Nursing Info Combined nursing hours (RN + LPN + Nurse Aide) per resident per day on weekends. Staffing often drops on weekends — this figure reveals whether the facility maintains adequate coverage outside of weekday hours. 2h 48m per day ▼ 15% State avg: 3h 17m per day · National avg: 3h 26m per day
Physical Therapist Info Hours per resident per day provided by licensed Physical Therapists (PTs) or PT Assistants. PT services help residents recover mobility after injury or illness and are especially important for post-acute (short-stay) rehabilitation. 2m per day ▼ 44% State avg: 3m per day · National avg: 4m per day
Weekend RN Info Registered nurse hours specifically on weekends. Facilities sometimes reduce RN presence on Saturdays and Sundays — a low weekend RN figure compared to weekday hours can indicate reduced clinical oversight when most administrative staff are absent. 30m per day ▲ 22% State avg: 25m per day · National avg: 29m per day

Capacity and availability

This home usually has availability

Lower occupancy than the state average
Occupancy rate
75.7% Rank #148 / 211Occupancy rate — State benchmarkedThis home is ranked 148th out of 211 homes in Ohio. Shows this facility's occupancy rate versus the Ohio average, with its Statewide rank out of 211. Higher occupancy signals strong local demand and financial stability.Rankings are based only on facilities in Ohio that report data for that category. Facilities without available data are excluded from the ranking.Click the rank badge to see the full State ranking.Click here to see the full State ranking.
Avg. Length of Stay
179 days
Bed community size
42-bed community Rank #257 / 323Bed count — State benchmarkedThis home is ranked 257th out of 323 homes in Ohio. Shows this facility's certified or reported bed count compared to other Ohio facilities. Larger communities may offer more amenities, programs, and on-site services for residents and families.Rankings are based only on facilities in Ohio that report data for that category. Facilities without available data are excluded from the ranking.Click the rank badge to see the full State ranking.Click here to see the full State ranking.
A moderately sized community that may balance personal attention with shared amenities and social activities.
Walk Score
Walk Score: 0 / 100 Rank #687 / 705Walk Score — State benchmarkedThis home is ranked 687th out of 705 homes in Ohio. Shows how walkable this facility's neighborhood is compared to the average Walk Score across Ohio facilities. Higher scores benefit residents, families, and staff.Rankings are based only on facilities in Ohio that report data for that category. Facilities without available data are excluded from the ranking.Click the rank badge to see the full State ranking.Click here to see the full State ranking.
Car-dependent. Most errands require a car, with limited nearby walkable options.

Contact Maple Hills Skilled Nursing & Rehabilitation

Staffing Data

Reporting period: October 1 – December 31, 2025 (Q4 2025). Source: CMS Payroll-Based Journal report.

Total staff 83
Employees 51
Contractors 32
Staff to resident ratio 2.59 : 1
0% compared with State average

State average ratio: 0 : 0

Avg staff/day 17
Average shift 8.3 hours
0% compared with State average

State average: 0 hours

Total staff hours (quarter) 12,921

Nursing staff breakdown

Q4 2025 · Oct 1 – Dec 31 More info This data comes from the CMS Payroll-Based Journal report covering October 1 – December 31, 2025.
Registered Nurse

Manages medical care and health needs.

RN Staff Info 19 total: 8 full-time employees and 11 contractors. 19
Average shift length Info Average shift length. Calculated as total hours divided by days worked and average staff per day. 8.5 hours
Licensed Practical Nurse

Assists with medical care and medications.

LPN Staff Info 10 total: 6 full-time employees and 4 contractors. 10
Average shift length Info Average shift length. Calculated as total hours divided by days worked and average staff per day. 10.9 hours
Certified Nursing Assistant

Helps with daily care and mobility.

CNA Staff Info 33 total: 19 full-time employees and 14 contractors. 33
Average shift length Info Average shift length. Calculated as total hours divided by days worked and average staff per day. 9.1 hours

Contractor staffing

Q4 2025 · Oct 1 – Dec 31 More info This data comes from the CMS Payroll-Based Journal report covering October 1 – December 31, 2025.

Total hours from contractors

5.2%

670 contractor hours this quarter

Certified Nursing Assistant: 14 Registered Nurse: 11 Licensed Practical Nurse: 4 Occupational Therapy Aide: 1 Occupational Therapy Assistant: 1 Medical Director: 1

Staff by category

Q4 2025 · Oct 1 – Dec 31 More info This data comes from the CMS Payroll-Based Journal report covering October 1 – December 31, 2025.
Certified Nursing Assistant1914335,06392100%9.1
Registered Nurse811192,38992100%8.5
Licensed Practical Nurse64101,3637986%10.9
Other Dietary Services Staff2021,0159199%7.7
Speech Language Pathologist3037546874%7.2
Physical Therapy Aide2025086672%7.3
Nurse Practitioner1014676267%7.5
Dental Services Staff1014465863%7.7
Clinical Nurse Specialist2024215964%7
Administrator2022082628%8
Respiratory Therapy Technician101894751%1.9
Nurse Aide in Training101661213%5.5
Occupational Therapy Aide011591415%4.2
Physical Therapy Assistant202322628%1.2
Qualified Social Worker101192022%0.9
Medical Director0111444%3.4
Occupational Therapy Assistant0111033%3.3
33 Certified Nursing Assistant
% of Days 100%
19 Registered Nurse
% of Days 100%
10 Licensed Practical Nurse
% of Days 86%
2 Other Dietary Services Staff
% of Days 99%
3 Speech Language Pathologist
% of Days 74%
2 Physical Therapy Aide
% of Days 72%
1 Nurse Practitioner
% of Days 67%
1 Dental Services Staff
% of Days 63%
2 Clinical Nurse Specialist
% of Days 64%
2 Administrator
% of Days 28%
1 Respiratory Therapy Technician
% of Days 51%
1 Nurse Aide in Training
% of Days 13%
1 Occupational Therapy Aide
% of Days 15%
2 Physical Therapy Assistant
% of Days 28%
1 Qualified Social Worker
% of Days 22%
1 Medical Director
% of Days 4%
1 Occupational Therapy Assistant
% of Days 3%

Penalties and fines

Federal penalties imposed by CMS for regulatory violations, including civil money penalties (fines) and denials of payment for new Medicare/Medicaid admissions.

Source: CMS Penalties Database

No penalties in the past 3 years

No civil money penalties or payment denials were reported in the last 3 years.

Quality of care over time

These measures show how residents usually do over time at this home, based on health outcomes and preventive care.

High-risk clinical events score Info A composite score based on pressure ulcers, falls with injury, weight loss, walking ability decline, and activities of daily living decline. 4.4
25% better than State average

State average: 5.8

Functional decline score Info A composite score based on activities of daily living decline, walking ability decline, and incontinence. 8.2
35% better than State average

State average: 12.7

Long-stay resident measures
Significantly above average State avg: 4.7 Info CMS star rating based on long-stay quality measure performance. 5 stars = significantly above average, 1 star = significantly below average.
Need for Help with Daily Activities Increased Info Percent of long-stay residents whose need for help with daily activities has increased 3.1%
54% better than State average

State average: 6.8%

Walking Ability Worsened Info Percent of long-stay residents whose ability to move independently worsened 4.0%
55% better than State average

State average: 8.9%

Low Risk Residents with Bowel/Bladder Incontinence Info Percent of low risk long-stay residents who lose control of their bowels or bladder 17.5%
20% better than State average

State average: 22.0%

Falls with Major Injury Info Percent of long-stay residents experiencing one or more falls with major injury 1.8%
49% better than State average

State average: 3.4%

High Risk Residents with Pressure Ulcers Info Percent of long-stay high risk residents with pressure ulcers 3.1%
21% better than State average

State average: 3.9%

Urinary Tract Infection Info Percent of long-stay residents with a urinary tract infection 0.0%
100% better than State average

State average: 0.5%

Lost Too Much Weight Info Percent of long-stay residents who lose too much weight 9.8%
58% worse than State average

State average: 6.2%

Depressive Symptoms Info Percent of long-stay residents who have depressive symptoms 85.5%
256% worse than State average

State average: 24.0%

Antipsychotic Use Info Percent of long-stay residents who received an antipsychotic medication 5.7%
33% better than State average

State average: 8.4%

Pneumococcal Vaccine Info Percent of long-stay residents assessed and appropriately given the pneumococcal vaccine 66.7%
28% worse than State average

State average: 92.4%

Influenza Vaccine Info Percent of long-stay residents assessed and appropriately given the seasonal influenza vaccine 66.7%
29% worse than State average

State average: 94.5%

Short-stay resident measures
Pneumococcal Vaccine Info Percent of short-stay residents assessed and appropriately given the pneumococcal vaccine 57.9%
26% worse than State average

State average: 78.0%

Antipsychotic medication increase Info Percent of short-stay residents who newly received an antipsychotic medication 0.0%
100% better than State average

State average: 1.3%

Influenza Vaccine Info Percent of short-stay residents assessed and appropriately given the seasonal influenza vaccine 30.8%
59% worse than State average

State average: 75.6%

Breakdown by payment type

Medicare

8% of new residents, usually for short-term rehab.

Typical stay 2 - 3 months

Private pay

45% of new residents, often for short stays.

Typical stay 3 - 4 months

Medicaid

48% of new residents, often for long-term daily care.

Typical stay 8 - 9 months

Facility Characteristics

Source: CMS Long-Term Care Facility Characteristics (Data as of Jan 2026)

Total residents 32
Medicaid
24
75% of residents
Private pay or other
8
25% of residents
Programs & Services
Residents Group

Residents meet regularly to discuss policies, care quality, and activities

Active Resident Council

Organized group of residents that meets regularly to discuss facility policies, quality of life, and activities.

Finances and operations

Based on CMS SNF Cost Report for fiscal year ending in 12/2023.

For-profit
Corporation
Net patient revenue Info Net patient revenue — what the home actually collects for resident care, after contractual allowances, bad debt and discounts are subtracted from its gross charges (CMS cost report, Worksheet G-3). It covers resident care only; money the home earns from other sources is shown separately as "Other income."
$2.7M
Net patient income Info Net patient income: net patient revenue minus the home's total operating expenses. A positive figure means it earns more from resident care than it spends to deliver it; a negative figure means the opposite. It excludes non-operating "other income."
-$402.1K
For-profit Corporation
Net patient revenue Info Net patient revenue — what the home actually collects for resident care, after contractual allowances, bad debt and discounts are subtracted from its gross charges (CMS cost report, Worksheet G-3). It covers resident care only; money the home earns from other sources is shown separately as "Other income."
$2.7M Rank #203 / 210Revenue — State benchmarkedThis home is ranked 203rd out of 210 homes in Ohio. Shows this facility's annual revenue compared to the Ohio average. Higher revenue generally means more resources for staffing and capital — read alongside Payroll %.Rankings are based only on facilities in Ohio that report data for that category. Facilities without available data are excluded from the ranking.Click the rank badge to see the full State ranking.Click here to see the full State ranking.
Net patient income Info Net patient income: net patient revenue minus the home's total operating expenses. A positive figure means it earns more from resident care than it spends to deliver it; a negative figure means the opposite. It excludes non-operating "other income."
-$402.1K
Other income Info Money the home earns outside of resident care — such as investments, grants, rentals and other non-operating sources (CMS cost report, Worksheet G-3). It is tracked separately from net patient revenue: it is not part of that figure, and it is not included in net patient income.
$651.4K
Payroll costs Info Staff salaries plus wage-related costs — benefits such as payroll taxes, health insurance and retirement — from the home's own accounting records (CMS cost report, Worksheet A). Contract or agency labor is counted separately, under other operating costs. Rank #206 / 210Payroll — State benchmarkedThis home is ranked 206th out of 210 homes in Ohio. Shows total annual staff payroll benchmarked to the Ohio average. Higher payroll investment relative to peers often signals better staffing and less reliance on cheaper contract labor.Rankings are based only on facilities in Ohio that report data for that category. Facilities without available data are excluded from the ranking.Click the rank badge to see the full State ranking.Click here to see the full State ranking.
$1.6M 58.8% of net patient revenue Info Payroll as a share of revenue: staff salaries and wage-related benefits divided by net patient revenue. A higher figure means more of each revenue dollar goes to staff pay. Rank #140 / 210Payroll % — State benchmarkedThis home is ranked 140th out of 210 homes in Ohio. Shows payroll as a percentage of revenue versus the Ohio average. Well-run Ohio facilities typically land around 54–64% — the top third Statewide. Below 25% may signal understaffing or heavy agency use — read with Staffing ratings.Rankings are based only on facilities in Ohio that report data for that category. Facilities without available data are excluded from the ranking.Click the rank badge to see the full State ranking.Click here to see the full State ranking.
Other operating costs Info Everything it costs to run the home apart from payroll — food, utilities, supplies, maintenance, contract labor and administration. Calculated as total operating expense minus payroll (staff salaries and wage-related benefits).
$1.5M
Total costs Info The home's total operating expense for the year — all the costs of running it, salaries included (CMS cost report, Worksheet G-3).
$3.1M

What does this home offer?

Building type icon
Building type icon

Building Type: 2-story

Social and recreational activities icon

Social and Recreational Activities

On-site medical care and health services icon

On-site Medical Care and Health Services

Rehabilitative support icon

Rehabilitative Support

Who this home usually serves

TYPE OF STAY

Mostly long-term care residents

Most residents stay for extended periods and receive ongoing daily care.

New residents most often arrive under Medicaid (48% of admissions), and a typical Medicaid stay runs around 8 - 9 months.

Admissions
65 total

Coverage residents most often arrive under.

Medicare 8%
Private pay 45%
Medicaid 48%
Discharges
65 total

Coverage residents most often leave under.

Medicare 8%
Private pay 45%
Medicaid 48%

Places of interest near Maple Hills Skilled Nursing & Rehabilitation

Address 2.0 miles from city center Info Estimated distance in miles from Mcarthur's city center to Maple Hills Skilled Nursing & Rehabilitation's address, calculated via Google Maps.

Calculate Travel Distance to Maple Hills Skilled Nursing & Rehabilitation

Add your location

Address

Compare Nursing Homes around the area

The information below is reported by the Ohio Department of Health, Bureau of Survey and Certification.

Maple Hills Skilled Nursing & Rehabilitation
NH
Mcarthur -42 - 0 -
Cottingham Retirement Community
NH
AL
HC
IL
MC
PC
RC
Cincinnati (Sharonville) -128 A+ 53 Private Rooms
Hickory Ridge Nursing & Rehab Center
NH
NC
Akron (Cascade Valley) -155 A+ 5 Studio / 1 Bed
Meadow Grove Transitional Care
NH
NC
PC
Grove City (Blue Star Drive) -99 A+ 1 Private / Semi-Private Rooms
Beachwood Commons by New Perspective
NH
AL
IL
MC
Beachwood -120 A+ 15 Studio / 1 Bed

Frequently Asked Questions about Maple Hills Skilled Nursing & Rehabilitation

What neighborhood is Maple Hills Skilled Nursing & Rehabilitation in?

Maple Hills Skilled Nursing & Rehabilitation is in the Mcarthur neighborhood.

What is the occupancy rate at Maple Hills Skilled Nursing & Rehabilitation?

Maple Hills Skilled Nursing & Rehabilitation's occupancy is 75.7%.

Does Maple Hills Skilled Nursing & Rehabilitation operate as a for-profit or non-profit?

Maple Hills Skilled Nursing & Rehabilitation is registered as a for-profit.

Are there photos of Maple Hills Skilled Nursing & Rehabilitation?

Yes — there are 4 photos of Maple Hills Skilled Nursing & Rehabilitation in the photo gallery on this page.

What is the address of Maple Hills Skilled Nursing & Rehabilitation?

Maple Hills Skilled Nursing & Rehabilitation is located at 31054 State Route 93 North, Mcarthur, OH 45651.

What is the phone number of Maple Hills Skilled Nursing & Rehabilitation?

(740) 596-5955 will put you in contact with the team at Maple Hills Skilled Nursing & Rehabilitation.

Is Maple Hills Skilled Nursing & Rehabilitation Medicare or Medicaid certified?

Yes — Maple Hills Skilled Nursing & Rehabilitation is a CMS-certified provider of Medicare and Medicaid.

Guides for Better Senior Living

Care Cost Calculator: See Prices in Your Area

Nursing Home Data Explorer

Don’t Wait Too Long: 7 Red Flag Signs Your Parent Needs Assisted Living Now

The True Cost of Assisted Living in 2025 – And How Families Are Paying For It

Understanding Senior Living Costs: Pricing Models, Discounts & Financial Assistance