Chambers Health and Rehabilitation
Nursing Home, Memory Care & Respite Care · Carlisle, AR
CMS overall rating Info CMS (the Centers for Medicare & Medicaid Services) is the federal agency that rates nursing home quality. Its Overall Rating runs from 1 to 5 stars, combining health inspections, staffing, and quality measures, with inspections weighted most heavily.

Chambers Health and Rehabilitation

Nursing Home, Memory Care & Respite Care · Carlisle, AR
CMS overall rating Info CMS (the Centers for Medicare & Medicaid Services) is the federal agency that rates nursing home quality. Its Overall Rating runs from 1 to 5 stars, combining health inspections, staffing, and quality measures, with inspections weighted most heavily.
Calculator: See prices in your area
Chambers Health and Rehabilitation accepts Medicare, Medicaid, and private pay.

Overview of Chambers Health and Rehabilitation

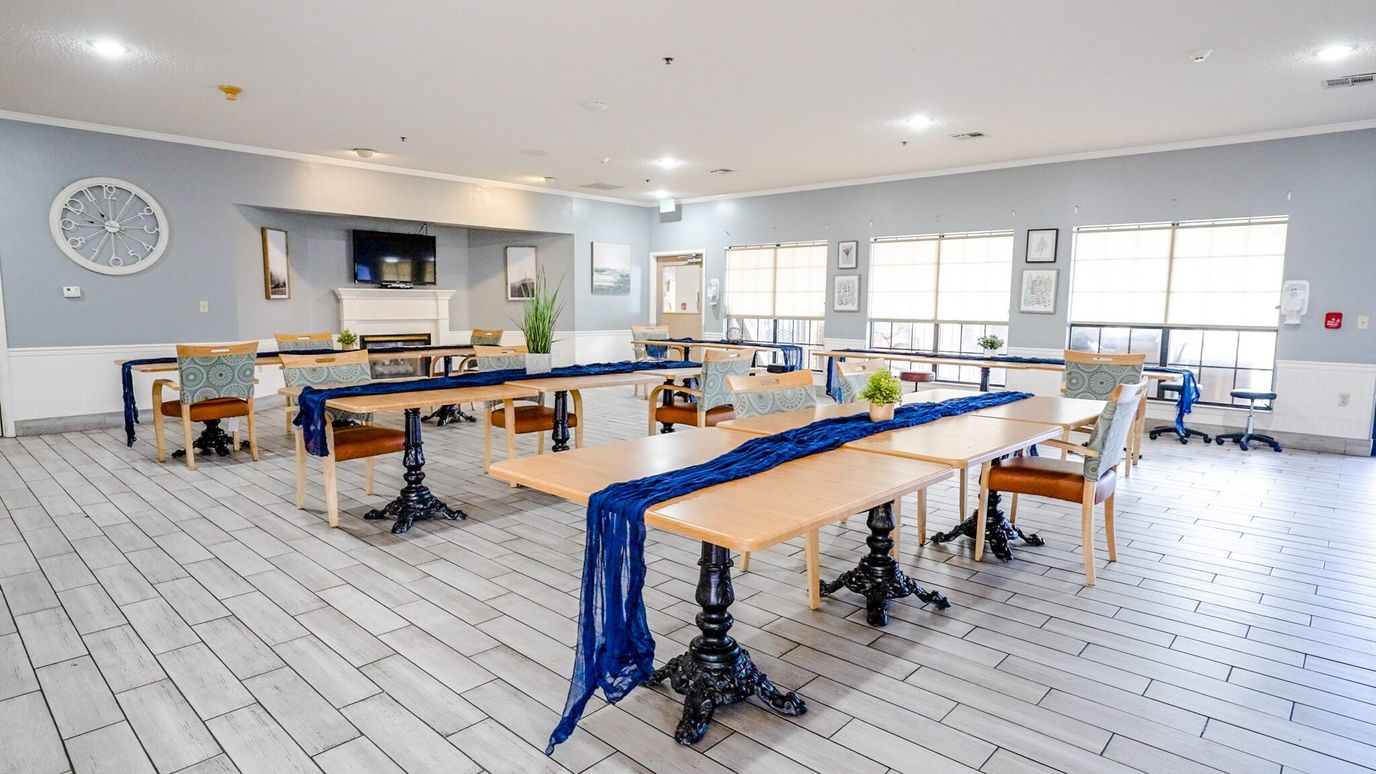
Chambers Health and Rehabilitation is a 90-bed care home on East Park Street in Carlisle, Arkansas, run by LonokeCo Ops, Inc and owner Michelle Moran. Right now, about half the beds are filled (52 percent occupancy), so they can take new residents pretty quickly. People stay here for an average of 208 days, meaning the daily routine on the floor is split between folks recovering from brief hospital stays and those who live there full-time.

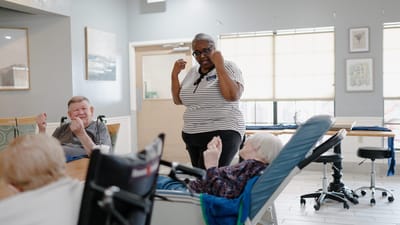
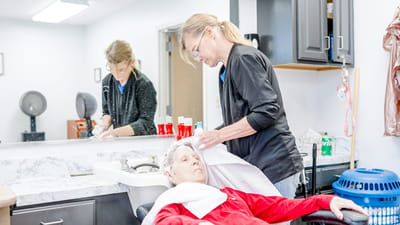
Nurses and aides handle the day-to-day care, clocking an average of 4 hours and 42 minutes of hands-on time with each resident every day. This round-the-clock team covers clinical needs, short-term respite breaks for family caregivers, and rehab sessions in a therapy gym built with its own kitchen and bathroom to help people practice daily living skills. If you are coming to visit, keep in mind the area has a low walk score of 21, so you will definitely need a car to get around.

State inspectors visit the facility regularly to run health and safety surveys. This specific report does not show any major, recurring patterns of safety violations, but it is always smart to ask the director of nursing to show you their latest inspection paperwork when you go in for a tour.

Families exploring care options can call the admissions department to see what rooms are open and walk through the move-in forms. The business office handles billing through Medicare, Medicaid, and private pay, and the kitchen staff can fill you in on their local Southern menu options.

Quality ratings

Measured by Centers for Medicare & Medicaid Services (CMS)

Overall rating Info The Overall CMS Rating combines results from health inspections, staffing levels and quality measures. Health inspections carry the most weight. Staffing and quality scores can increase or decrease the final rating based on performance compared to state and national standards.
Health Inspection Info Based on the results of the facility's three most recent standard inspections and any complaint investigations. CMS reviews the number, scope, and severity of deficiencies, with more recent findings weighted more heavily.
Staffing Info Measures average nursing staff hours per resident per day, including Registered Nurses (RNs) and total nursing staff. Ratings are adjusted based on the level of care residents require and are compared to state and national benchmarks.
Quality Measures Info Based on clinical and physical health indicators reported to CMS, such as hospital readmissions, falls, pressure ulcers, and improvements in mobility. These measures reflect how well residents' health needs are being managed.

Staffing hours breakdown

Info Daily nursing hours per resident by staff type, reported to CMS. Higher is generally better — compare this facility to state and national averages to see where staffing stands.

Hours per resident per day — compared to state averages

Total nursing care / resident Info Total adjusted nursing hours per resident per day, combining RN, LPN, and aide time. CMS adjusts this for case-mix so facilities can be fairly compared.
4h 42m per day
vs avg

3 of 6 metrics below state avg

Standout metric LPN / LVN is +27% above state avg
Staff typeHours / Day / Residentvs state avg
Registered Nurse (RN) Info RNs hold the highest nursing license and can assess residents, interpret test results, and direct care plans. More RN hours per day often signals stronger clinical oversight and faster response to health changes. 18m per day ▼ 26% State avg: 24m per day · National avg: 41m per day
LPN / LVN Info Licensed Practical Nurses (LPNs) or Licensed Vocational Nurses (LVNs) deliver routine hands-on care — medication administration, wound dressing, and monitoring vital signs. They work under RN supervision and make up a large share of daily bedside care. 1h 12m per day ▲ 27% State avg: 57m per day · National avg: 52m per day
Nurse Aide Info Certified Nurse Aides (CNAs) provide the most direct day-to-day assistance: bathing, dressing, feeding, and mobility. Nurse aide hours are typically the largest staffing category and directly affect residents' quality of life. 2h 49m per day ▲ 4% State avg: 2h 43m per day · National avg: 2h 20m per day
Weekend Total Nursing Info Combined nursing hours (RN + LPN + Nurse Aide) per resident per day on weekends. Staffing often drops on weekends — this figure reveals whether the facility maintains adequate coverage outside of weekday hours. 3h 44m per day ▲ 7% State avg: 3h 29m per day · National avg: 3h 26m per day
Physical Therapist Info Hours per resident per day provided by licensed Physical Therapists (PTs) or PT Assistants. PT services help residents recover mobility after injury or illness and are especially important for post-acute (short-stay) rehabilitation. 0m per day ▼ 81% State avg: 2m per day · National avg: 4m per day
Weekend RN Info Registered nurse hours specifically on weekends. Facilities sometimes reduce RN presence on Saturdays and Sundays — a low weekend RN figure compared to weekday hours can indicate reduced clinical oversight when most administrative staff are absent. 10m per day ▼ 39% State avg: 16m per day · National avg: 28m per day

Capacity and availability

Avg. Length of Stay
208 days
Bed community size
90-bed community Rank #160 / 330Bed count — State benchmarkedThis home is ranked 160th out of 330 homes in Arkansas. Shows this facility's certified or reported bed count compared to other Arkansas facilities. Larger communities may offer more amenities, programs, and on-site services for residents and families.Rankings are based only on facilities in Arkansas that report data for that category. Facilities without available data are excluded from the ranking.Click the rank badge to see the full State ranking.Click here to see the full State ranking.
A larger shared setting that may offer more common spaces and organized community services.
Walk Score
Walk Score: 21 / 100 Rank #286 / 419Walk Score — State benchmarkedThis home is ranked 286th out of 419 homes in Arkansas. Shows how walkable this facility's neighborhood is compared to the average Walk Score across Arkansas facilities. Higher scores benefit residents, families, and staff.Rankings are based only on facilities in Arkansas that report data for that category. Facilities without available data are excluded from the ranking.Click the rank badge to see the full State ranking.Click here to see the full State ranking.
Car-dependent. Most errands require a car, with limited nearby walkable options.

About this community

Occupancy

Occupancy rate
52%
Lower than the Arkansas average: 71.3%
Occupied beds
47 / 90
Average occupied beds in Arkansas homes 77 beds

License Details

Facility TypeSkilled Nursing Facility With Dual Certified Beds (medicaid/medicare)
CountyLonoke
CMS Certification Number045318
Certification TypeMedicaid / Medicare

Ownership & Operating Entity

Chambers Health and Rehabilitation is legally operated by LonokeCo Ops, Inc., and administered by Michelle Moran.

Owner NameLonokeco Ops, Inc
Profit StatusFor-profit

Type Of Units

Medicaid and Medicare
90 units
Total beds
90 units

Therapy & Rehabilitation

2 services
Rehabilitation Services
Respite Care

Staffing & Medical

1 service
24-Hour Staffing

Contact Information

Fax870-552-7601

Amenities & Lifestyle

Communal Dining Space
Dedicated Activity Area
Enclosed Outdoor Courtyard
Therapy Gym With State-Of-The-Art Equipment
Full Kitchen And Bathroom For Rehabilitation
Activities
Specific ProgramsShort-Term Rehab, Specialty Nursing, Nutritional Support

Contact Chambers Health and Rehabilitation

Inspection History

In Arkansas, the Department of Human Services, Office of Long Term Care is authorized to conduct unannounced inspections and issue official quality of care reports for all senior living providers.

Since 2023 · 3 years of data 11 deficiencies

Inspection Scorecard Info This scorecard compares key inspection, deficiency, and complaint metrics at this facility against the Arkansas state average. Metrics rated ≥15% worse than average are highlighted in red; those ≥15% better are highlighted in green.

Since 2023 vs. Arkansas state average
Overall vs. AR average 0 Worse No metrics in this bucket. 2 Better Metrics better than Arkansas average:
• Total deficiencies (48% below)
• Deficiencies per year (47% below)
Latest Inspection December 11, 2025 Routine

Deficiencies Info Deficiencies are formal regulatory issues recorded during state inspections.

This FacilityAR Averagevs. AR Avg
Total deficiencies Info Formal regulatory issues recorded by inspectors across all inspection types. 1121 This facility has 48% fewer total deficiencies than a typical Arkansas assisted living residence (11 vs. AR avg 21).↓ 48% better
Deficiencies per year Info Average deficiencies per year since 2023. 3.77 This facility has 47% fewer deficiencies per year than a typical Arkansas assisted living residence (3.7 vs. AR avg 7).↓ 47% better

Inspection Reports Summary Info An editor-reviewed summary of the themes and findings across this facility's recent inspection reports.

  • December 11, 2025 inspection found two deficiencies: nurse failed competency in intramuscular injection causing underdosing, and medication error rate was 7.69%, exceeding the 5% threshold.
  • August 1, 2024 inspection cited three deficiencies including expired food items in the kitchen, dietary staff hand hygiene failures, and lack of PPE use on COVID-19 contact precautions.
  • May 16, 2023 complaint investigation substantiated failures in skin care treatment and oxygen tubing maintenance for multiple residents.

Health Inspection History

Inspections since 2022
Total health inspections 5

State average N/A


Last Health inspection on Aug 2024

Total health citations
13

State average N/A

Citations per inspection
2.6

State average N/A


Health citations are formal notices following inspections when they fail to comply with safety and care standards.

10 of 13 citations resulted from standard inspections; and 3 of 13 resulted from complaint investigations.

Breakdown of citation severity (last 4 years)
Critical health citations
0
In line with State average

State average: N/A


Serious health citations
0
In line with State average

State average: N/A

0 critical citations State average: N/A

0 serious citations State average: N/A

13 moderate citations State average: N/A

0 minor citations State average: N/A
Citations history (last 4 years)
Infection Control moderate citation Aug 01, 2024
Corrected

Nutrition moderate citation Aug 01, 2024
Corrected

Pharmacy moderate citation Mar 26, 2024
Corrected

Pharmacy moderate citation Aug 10, 2023
Corrected

Staffing Data

Reporting period: October 1 – December 31, 2025 (Q4 2025). Source: CMS Payroll-Based Journal report.

Total staff 63
Employees 50
Contractors 13
Staff to resident ratio 1.34 : 1
0% compared with State average

State average ratio: 0 : 0

Avg staff/day 28
Average shift 8.7 hours
0% compared with State average

State average: 0 hours

Total staff hours (quarter) 22,335

Nursing staff breakdown

Q4 2025 · Oct 1 – Dec 31 More info This data comes from the CMS Payroll-Based Journal report covering October 1 – December 31, 2025.
Registered Nurse

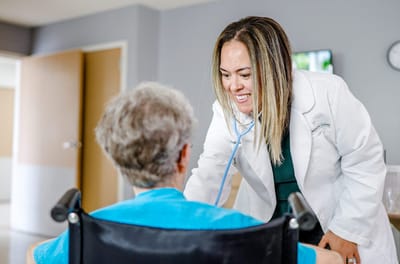
Manages medical care and health needs.

RN Staff Info All 1 RN Staff are full-time employees. No contractors work on this role. 1
Average shift length Info Average shift length. Calculated as total hours divided by days worked and average staff per day. 7.2 hours
Licensed Practical Nurse

Assists with medical care and medications.

LPN Staff Info All 10 LPN Staff are full-time employees. No contractors work on this role. 10
Average shift length Info Average shift length. Calculated as total hours divided by days worked and average staff per day. 9.5 hours
Certified Nursing Assistant

Helps with daily care and mobility.

CNA Staff Info All 32 CNA Staff are full-time employees. No contractors work on this role. 32
Average shift length Info Average shift length. Calculated as total hours divided by days worked and average staff per day. 9.3 hours

Contractor staffing

Q4 2025 · Oct 1 – Dec 31 More info This data comes from the CMS Payroll-Based Journal report covering October 1 – December 31, 2025.

Total hours from contractors

3%

679 contractor hours this quarter

Clinical Nurse Specialist: 5 Physical Therapy Assistant: 2 Speech Language Pathologist: 2 Respiratory Therapy Technician: 2 Qualified Social Worker: 2

Staff by category

Q4 2025 · Oct 1 – Dec 31 More info This data comes from the CMS Payroll-Based Journal report covering October 1 – December 31, 2025.
Certified Nursing Assistant3203213,25692100%9.3
Licensed Practical Nurse100105,12292100%9.5
Clinical Nurse Specialist2577547582%6.2
Dietitian1015306571%8.2
RN Director of Nursing1015226773%7.8
Mental Health Service Worker1014986470%7.8
Administrator1014966267%8
Nurse Practitioner1014966267%8
Speech Language Pathologist0222446470%3.8
Physical Therapy Assistant0222376773%3.5
Registered Nurse1011432022%7.2
Respiratory Therapy Technician022291516%1.9
Qualified Social Worker022867%1.4
32 Certified Nursing Assistant
% of Days 100%
10 Licensed Practical Nurse
% of Days 100%
7 Clinical Nurse Specialist
% of Days 82%
1 Dietitian
% of Days 71%
1 RN Director of Nursing
% of Days 73%
1 Mental Health Service Worker
% of Days 70%
1 Administrator
% of Days 67%
1 Nurse Practitioner
% of Days 67%
2 Speech Language Pathologist
% of Days 70%
2 Physical Therapy Assistant
% of Days 73%
1 Registered Nurse
% of Days 22%
2 Respiratory Therapy Technician
% of Days 16%
2 Qualified Social Worker
% of Days 7%

Penalties and fines

Federal penalties imposed by CMS for regulatory violations, including civil money penalties (fines) and denials of payment for new Medicare/Medicaid admissions.

Source: CMS Penalties Database

No penalties in the past 3 years

No civil money penalties or payment denials were reported in the last 3 years.

Quality of care over time

These measures show how residents usually do over time at this home, based on health outcomes and preventive care.

High-risk clinical events score Info A composite score based on pressure ulcers, falls with injury, weight loss, walking ability decline, and activities of daily living decline. 8.3
8% worse than State average

State average: 7.7

Functional decline score Info A composite score based on activities of daily living decline, walking ability decline, and incontinence. 17.4
31% worse than State average

State average: 13.3

Long-stay resident measures
Significantly above average State avg: 4.2 Info CMS star rating based on long-stay quality measure performance. 5 stars = significantly above average, 1 star = significantly below average.
Need for Help with Daily Activities Increased Info Percent of long-stay residents whose need for help with daily activities has increased 16.8%
46% worse than State average

State average: 11.5%

Walking Ability Worsened Info Percent of long-stay residents whose ability to move independently worsened 16.3%
22% worse than State average

State average: 13.4%

Low Risk Residents with Bowel/Bladder Incontinence Info Percent of low risk long-stay residents who lose control of their bowels or bladder 19.3%
28% worse than State average

State average: 15.1%

Falls with Major Injury Info Percent of long-stay residents experiencing one or more falls with major injury 2.7%
32% better than State average

State average: 3.9%

High Risk Residents with Pressure Ulcers Info Percent of long-stay high risk residents with pressure ulcers 5.2%
9% worse than State average

State average: 4.7%

Urinary Tract Infection Info Percent of long-stay residents with a urinary tract infection 0.6%
57% better than State average

State average: 1.3%

Lost Too Much Weight Info Percent of long-stay residents who lose too much weight 0.6%
88% better than State average

State average: 5.0%

Depressive Symptoms Info Percent of long-stay residents who have depressive symptoms 0.0%
100% better than State average

State average: 1.5%

Antipsychotic Use Info Percent of long-stay residents who received an antipsychotic medication 1.1%
89% better than State average

State average: 10.5%

Pneumococcal Vaccine Info Percent of long-stay residents assessed and appropriately given the pneumococcal vaccine 100.0%
6% better than State average

State average: 94.4%

Influenza Vaccine Info Percent of long-stay residents assessed and appropriately given the seasonal influenza vaccine 100.0%
In line with State average

State average: 96.2%

Hospitalizations per 1,000 days Info Number of hospitalizations per 1,000 long-stay resident days. 2.10
7% worse than State average

State average: 1.97

ED visits per 1,000 days Info Number of outpatient emergency department visits per 1,000 long-stay resident days. 0.55
75% better than State average

State average: 2.18

Short-stay resident measures
Above average State avg: 2.7 Info CMS star rating based on short-stay quality measure performance. 5 stars = much above average, 1 star = much below average.
Pneumococcal Vaccine Info Percent of short-stay residents assessed and appropriately given the pneumococcal vaccine 98.8%
22% better than State average

State average: 80.9%

Antipsychotic medication increase Info Percent of short-stay residents who newly received an antipsychotic medication 1.9%
23% worse than State average

State average: 1.5%

Influenza Vaccine Info Percent of short-stay residents assessed and appropriately given the seasonal influenza vaccine 47.5%
39% worse than State average

State average: 77.7%

Re-hospitalized after SNF stay Info Percentage of short-stay residents who were re-hospitalized after their nursing home admission. 38.1%
51% worse than State average

State average: 25.2%

Emergency department visits Info Percentage of short-stay residents who had an outpatient emergency department visit. 3.1%
78% better than State average

State average: 13.8%

Falls with major injury Info Percentage of SNF residents who experience falls with major injury during their stay. 2.6%
232% worse than State average

State average: 0.8%

Ability to care for self at discharge Info Percentage of residents at or above expected ability to care for themselves at discharge. 52.2%
In line with State average

State average: 53.7%

Successful return to home or community Info Rate of successful return to home or community from a skilled nursing facility. 49.3%
In line with State average

State average: 50.6%

Breakdown by payment type

Medicare

23% of new residents, usually for short-term rehab.

Typical stay 2 - 3 months

Private pay

62% of new residents, often for short stays.

Typical stay 3 - 4 months

Medicaid

15% of new residents, often for long-term daily care.

Typical stay 2 - 3 years

Facility Characteristics

Source: CMS Long-Term Care Facility Characteristics (Data as of Jan 2026)

Total residents 47
Medicare
3
6.4% of residents
Medicaid
33
70.2% of residents
Private pay or other
11
23.4% of residents
Programs & Services
Residents Group

Residents meet regularly to discuss policies, care quality, and activities

Active Resident Council

Organized group of residents that meets regularly to discuss facility policies, quality of life, and activities.

Finances and operations

Based on CMS SNF Cost Report for fiscal year ending in 12/2023.

For-profit
Corporation
Net patient revenue Info Net patient revenue — what the home actually collects for resident care, after contractual allowances, bad debt and discounts are subtracted from its gross charges (CMS cost report, Worksheet G-3). It covers resident care only; money the home earns from other sources is shown separately as "Other income."
$5.4M
Net patient income Info Net patient income: net patient revenue minus the home's total operating expenses. A positive figure means it earns more from resident care than it spends to deliver it; a negative figure means the opposite. It excludes non-operating "other income."
-$432.3K
For-profit Corporation
Net patient revenue Info Net patient revenue — what the home actually collects for resident care, after contractual allowances, bad debt and discounts are subtracted from its gross charges (CMS cost report, Worksheet G-3). It covers resident care only; money the home earns from other sources is shown separately as "Other income."
$5.4M
Net patient income Info Net patient income: net patient revenue minus the home's total operating expenses. A positive figure means it earns more from resident care than it spends to deliver it; a negative figure means the opposite. It excludes non-operating "other income."
-$432.3K
Other income Info Money the home earns outside of resident care — such as investments, grants, rentals and other non-operating sources (CMS cost report, Worksheet G-3). It is tracked separately from net patient revenue: it is not part of that figure, and it is not included in net patient income.
$6.7K
Payroll costs Info Staff salaries plus wage-related costs — benefits such as payroll taxes, health insurance and retirement — from the home's own accounting records (CMS cost report, Worksheet A). Contract or agency labor is counted separately, under other operating costs.
$3.0M 54.8% of net patient revenue Info Payroll as a share of revenue: staff salaries and wage-related benefits divided by net patient revenue. A higher figure means more of each revenue dollar goes to staff pay.
Other operating costs Info Everything it costs to run the home apart from payroll — food, utilities, supplies, maintenance, contract labor and administration. Calculated as total operating expense minus payroll (staff salaries and wage-related benefits).
$2.9M
Total costs Info The home's total operating expense for the year — all the costs of running it, salaries included (CMS cost report, Worksheet G-3).
$5.9M

Who this home usually serves

TYPE OF STAY

Primarily short stays

Residents typically stay for brief periods, with frequent admissions and discharges throughout the year.

Most new residents arrive under private pay (62% of admissions), and a typical private pay stay runs around 3 - 4 months.

Admissions
91 total

Coverage residents most often arrive under.

Medicare 23%
Private pay 62%
Medicaid 15%
Discharges
93 total

Coverage residents most often leave under.

Medicare 29%
Private pay 57%
Medicaid 14%

Places of interest near Chambers Health and Rehabilitation

Address 0.0 miles from city center Info Estimated distance in miles from Carlisle's city center to Chambers Health and Rehabilitation's address, calculated via Google Maps.

Calculate Travel Distance to Chambers Health and Rehabilitation

Add your location

Address

Compare Nursing Homes around the area

The information below is reported by the Arkansas Department of Human Services, Office of Long Term Care.

Chambers Health and Rehabilitation
NH
MC
RC
Carlisle -90 - 21 -
Barnes Healthcare
NH
MC
Lonoke -141 A+ 38 Private / Shared Rooms
Timberlane Health & Rehab
NH
MC
RC
El Dorado -106 A+ 33 -
Bear Creek Healthcare LLC
NH
De Queen -131 - 35 -
Maple Healthcare
NH
Hazen -70 - 21 Private / Shared Rooms

Frequently Asked Questions about Chambers Health and Rehabilitation

Who is the owner of Chambers Health and Rehabilitation?

Chambers Health and Rehabilitation is legally operated by LonokeCo Ops, Inc., and administered by Michelle Moran.

Is Chambers Health and Rehabilitation in a walkable area?

Chambers Health and Rehabilitation has a walk score of 21. Car-dependent. Most errands require a car, with limited nearby walkable options.

What is the occupancy rate at Chambers Health and Rehabilitation?

Chambers Health and Rehabilitation's occupancy is 52%.

Does Chambers Health and Rehabilitation operate as a for-profit or non-profit?

Chambers Health and Rehabilitation is registered as a for-profit in AR.

Who is the administrator of Chambers Health and Rehabilitation?

Michelle Moran is the administrator of Chambers Health and Rehabilitation.

How many beds does Chambers Health and Rehabilitation have?

Chambers Health and Rehabilitation has 90 beds.

Are there photos of Chambers Health and Rehabilitation?

Yes — there are 14 photos of Chambers Health and Rehabilitation in the photo gallery on this page.

Guides for Better Senior Living

Care Cost Calculator: See Prices in Your Area

Nursing Home Data Explorer

Don’t Wait Too Long: 7 Red Flag Signs Your Parent Needs Assisted Living Now

The True Cost of Assisted Living in 2025 – And How Families Are Paying For It

Understanding Senior Living Costs: Pricing Models, Discounts & Financial Assistance