Bailey Creek Health and Rehab
Nursing Home & Assisted Living · Texarkana, AR
CMS overall rating Info CMS (the Centers for Medicare & Medicaid Services) is the federal agency that rates nursing home quality. Its Overall Rating runs from 1 to 5 stars, combining health inspections, staffing, and quality measures, with inspections weighted most heavily.

Bailey Creek Health and Rehab

Nursing Home & Assisted Living · Texarkana, AR
CMS overall rating Info CMS (the Centers for Medicare & Medicaid Services) is the federal agency that rates nursing home quality. Its Overall Rating runs from 1 to 5 stars, combining health inspections, staffing, and quality measures, with inspections weighted most heavily.
Calculator: See prices in your area
Bailey Creek Health and Rehab accepts Medicare, Medicaid, and private pay.

Overview of Bailey Creek Health and Rehab

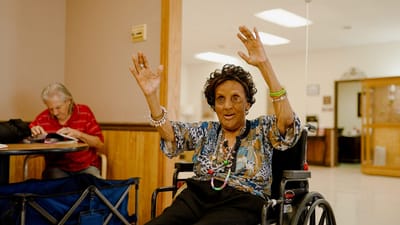
Clay Ferguson owns, and TXKNC, Inc operates Bailey Creek Health and Rehab, a 115-bed nursing facility on East 42nd Street in Texarkana, Arkansas. The building has been open for 31 years and currently cares for 74 residents, which puts its occupancy level at 64 percent. People stay here for an average of 158 days, a timeline showing that the daily floor routines split attention between short-term therapy recovery and permanent residential care.

The daily routine depends on a 24-hour nursing team that logs an average of 4 hours and 58 minutes of direct, hands-on attention per resident every day. Registered nurses, practical nurses, and assistants use these hours to run clinical treatments alongside specialized physical, occupational, and speech therapy routines. When visiting, keep in mind the neighborhood has a walk score of 65, making it moderately walkable so you can easily handle a few errands on foot, though most trips across town require a car.

State inspectors have previously noted compliance problems at this facility regarding care plan compliance, medication management, environmental maintenance, and infection control. Surveys also flagged issues with general dietary practices and resident privacy rules. Reviewing these older health department logs with the administrator is a direct way to see how the staff handles daily quality control monitoring.

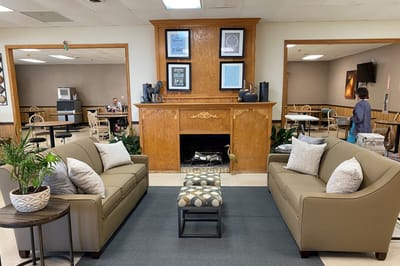
Older adults looking into local care options can check in with the admissions coordinator to look over private room layouts with attached showers or to walk through the standard entry forms. The business office handles stay coverage through traditional Medicare, state Medicaid, or private out-of-pocket funds, and the staff can detail campus features like the enclosed outdoor courtyard with a gazebo, specialized outdoor therapy equipment, and regular group entertainment activities.

Quality ratings

Measured by Centers for Medicare & Medicaid Services (CMS)

Overall rating Info The Overall CMS Rating combines results from health inspections, staffing levels and quality measures. Health inspections carry the most weight. Staffing and quality scores can increase or decrease the final rating based on performance compared to state and national standards.
▼ 68.1% Below AR avg. ▼ 68.1% Below AR avg.AR average: 3.1Click the badge to see the full State ranking.Click here to see the full State ranking.
Health Inspection Info Based on the results of the facility's three most recent standard inspections and any complaint investigations. CMS reviews the number, scope, and severity of deficiencies, with more recent findings weighted more heavily.
▼ 65.4% Below AR avg. ▼ 65.4% Below AR avg.AR average: 2.9Click the badge to see the full State ranking.Click here to see the full State ranking.
Staffing Info Measures average nursing staff hours per resident per day, including Registered Nurses (RNs) and total nursing staff. Ratings are adjusted based on the level of care residents require and are compared to state and national benchmarks.
▲ 25.6% Above AR avg. ▲ 25.6% Above AR avg.AR average: 3.2Click the badge to see the full State ranking.Click here to see the full State ranking.
Quality Measures Info Based on clinical and physical health indicators reported to CMS, such as hospital readmissions, falls, pressure ulcers, and improvements in mobility. These measures reflect how well residents' health needs are being managed.
▲ 9.3% Above AR avg. ▲ 9.3% Above AR avg.AR average: 3.7Click the badge to see the full State ranking.Click here to see the full State ranking.

Staffing hours breakdown

Info Daily nursing hours per resident by staff type, reported to CMS. Higher is generally better — compare this facility to state and national averages to see where staffing stands.

Hours per resident per day — compared to Arkansas state averages

Total nursing care / resident Info Total adjusted nursing hours per resident per day, combining RN, LPN, and aide time. CMS adjusts this for case-mix so facilities can be fairly compared.
4h 58m per day
This facility Arkansas avg (4h 40m per day)
vs Arkansas avg
+6%

5 of 6 metrics below state avg

Standout metric Registered Nurse (RN) is +4% above state avg
Staff typeHours / Day / Residentvs state avg
Registered Nurse (RN) Info RNs hold the highest nursing license and can assess residents, interpret test results, and direct care plans. More RN hours per day often signals stronger clinical oversight and faster response to health changes. 25m per day ▲ 4% State avg: 24m per day · National avg: 41m per day
LPN / LVN Info Licensed Practical Nurses (LPNs) or Licensed Vocational Nurses (LVNs) deliver routine hands-on care — medication administration, wound dressing, and monitoring vital signs. They work under RN supervision and make up a large share of daily bedside care. 51m per day ▼ 11% State avg: 57m per day · National avg: 52m per day
Nurse Aide Info Certified Nurse Aides (CNAs) provide the most direct day-to-day assistance: bathing, dressing, feeding, and mobility. Nurse aide hours are typically the largest staffing category and directly affect residents' quality of life. 2h 34m per day ▼ 6% State avg: 2h 44m per day · National avg: 2h 21m per day
Weekend Total Nursing Info Combined nursing hours (RN + LPN + Nurse Aide) per resident per day on weekends. Staffing often drops on weekends — this figure reveals whether the facility maintains adequate coverage outside of weekday hours. 3h 3m per day ▼ 12% State avg: 3h 29m per day · National avg: 3h 26m per day
Physical Therapist Info Hours per resident per day provided by licensed Physical Therapists (PTs) or PT Assistants. PT services help residents recover mobility after injury or illness and are especially important for post-acute (short-stay) rehabilitation. 1m per day ▼ 71% State avg: 2m per day · National avg: 4m per day
Weekend RN Info Registered nurse hours specifically on weekends. Facilities sometimes reduce RN presence on Saturdays and Sundays — a low weekend RN figure compared to weekday hours can indicate reduced clinical oversight when most administrative staff are absent. 15m per day ▼ 6% State avg: 16m per day · National avg: 29m per day

Capacity and availability

Avg. Length of Stay
158 days
Bed community size
115-bed community Rank #83 / 330Bed count — State benchmarkedThis home is ranked 83rd out of 330 homes in Arkansas. Shows this facility's certified or reported bed count compared to other Arkansas facilities. Larger communities may offer more amenities, programs, and on-site services for residents and families.Rankings are based only on facilities in Arkansas that report data for that category. Facilities without available data are excluded from the ranking.Click the rank badge to see the full State ranking.Click here to see the full State ranking.
A larger shared setting that may offer more common spaces and organized community services.
Years in operation
31 years in operation
A longer operating history, which may indicate experience navigating regulations and delivering ongoing care.
Walk Score
Walk Score: 65 / 100 Rank #31 / 419Walk Score — State benchmarkedThis home is ranked 31st out of 419 homes in Arkansas. Shows how walkable this facility's neighborhood is compared to the average Walk Score across Arkansas facilities. Higher scores benefit residents, families, and staff.Rankings are based only on facilities in Arkansas that report data for that category. Facilities without available data are excluded from the ranking.Click the rank badge to see the full State ranking.Click here to see the full State ranking.
Moderately walkable. Some errands can be accomplished on foot, with a mix of nearby amenities.
BBB Rating
BBB Rating: A+ (Not Accredited)
An independent rating from the Better Business Bureau based on factors such as complaint history, transparency, and business practices.
How BBB ratings work

About this community

Occupancy

Occupancy rate
64%
Lower than the Arkansas average: 71.3%
Occupied beds
74 / 115
Average occupied beds in Arkansas homes 77 beds

License Details

Facility TypeSkilled Nursing Facility With Dual Certified Beds (medicaid /medicare)
CountyMiller
CMS Certification Number045241
Certification TypeMedicaid / Medicare

Ownership & Operating Entity

Bailey Creek Health and Rehab is legally operated by TXKNC, Inc., and administered by Sarah Gaither.

Owner NameTxknc, Inc
Profit StatusFor-profit

Type Of Units

Medicaid and Medicare
115 units
Total beds
115 units

Therapy & Rehabilitation

2 services
Rehabilitation Services
Respite Care

Staffing & Medical

1 service
24-Hour Staffing

Contact Information

Fax870-773-2802

Amenities & Lifestyle

Private Rooms With Showers
Large Communal Dining Space
Dedicated Activity Area
Physical Therapy
Occupational Therapy
Speech Therapy
Enclosed Outdoor Courtyard With Gazebo
Specialized Outdoor Therapy Equipment
Activities
Specific ProgramsShort-Term Rehab, Engaging social and recreational activities

Contact Bailey Creek Health and Rehab

Inspection History

In Arkansas, the Department of Human Services, Office of Long Term Care is authorized to conduct unannounced inspections and issue official quality of care reports for all senior living providers.

Since 2022 · 4 years of data 35 deficiencies

Inspection Scorecard Info This scorecard compares key inspection, deficiency, and complaint metrics at this facility against the Arkansas state average. Metrics rated ≥15% worse than average are highlighted in red; those ≥15% better are highlighted in green.

Since 2022 vs. Arkansas state average
Overall vs. AR average 2 Worse Metrics worse than Arkansas average:
• Total deficiencies (67% above)
• Deficiencies per year (66% above)
0 Better No metrics in this bucket.
Latest Inspection September 6, 2024 Routine

Deficiencies Info Deficiencies are formal regulatory issues recorded during state inspections.

This FacilityAR Averagevs. AR Avg
Total deficiencies Info Formal regulatory issues recorded by inspectors across all inspection types. 3521 This facility has 67% more total deficiencies than a typical Arkansas nursing home (35 vs. AR avg 21).↑ 67% worse
Deficiencies per year Info Average deficiencies per year since 2022. 8.85.3 This facility has 66% more deficiencies per year than a typical Arkansas nursing home (8.8 vs. AR avg 5.3).↑ 66% worse

Inspection Reports Summary Info An editor-reviewed summary of the themes and findings across this facility's recent inspection reports.

  • September 6, 2024 inspection found 9 deficiencies including failure to ensure resident privacy, unsafe environmental hazards, improper medication storage, poor dietary and infection control practices, and inadequate dementia training.
  • February 27, 2024 complaint investigation substantiated failure to thoroughly investigate verbal abuse allegations by a CNA, placing all 62 residents at risk of verbal abuse.
  • January 3, 2024 complaint investigation substantiated failure to follow Resident #1’s two-person care plan, resulting in a fall with head injury and subsequent resident death.

Health Inspection History

Inspections since 2022
Total health inspections 5

Arkansas average 4.2


Last Health inspection on Sep 2024

Total health citations
17

Arkansas average 21.8

Citations per inspection
3.4

Arkansas average 5.32


Health citations are formal notices following inspections when they fail to comply with safety and care standards.

15 of 17 citations resulted from standard inspections; and 2 of 17 resulted from complaint investigations.

Breakdown of citation severity (last 4 years)
Critical health citations
0
100% better than Arkansas average

Arkansas average: 0.4


Serious health citations
0
100% better than Arkansas average

Arkansas average: 0.2

0 critical citations Arkansas average: 0.4

0 serious citations Arkansas average: 0.2

17 moderate citations Arkansas average: 20.9

0 minor citations Arkansas average: 0.4
Citations history (last 4 years)
Infection Control moderate citation Sep 06, 2024
Corrected

Nursing Services moderate citation Sep 06, 2024
Corrected

Nutrition moderate citation Sep 06, 2024
Corrected

Nutrition moderate citation Sep 06, 2024
Corrected

Staffing Data

Reporting period: October 1 – December 31, 2025 (Q4 2025). Source: CMS Payroll-Based Journal report.

Total staff 99
Employees 85
Contractors 14
Staff to resident ratio 1.34 : 1
16% fewer staff per resident than Arkansas average
Arkansas average ratio: 1.59 : 1 Arkansas average ratio: 1.59 : 1See full Arkansas ranking
Avg staff/day 46
Average shift 7.1 hours
11% worse than Arkansas average
Arkansas average: 8 hours Arkansas average shift: 8 hoursSee full Arkansas ranking
Total staff hours (quarter) 30,180

Nursing staff breakdown

Q4 2025 · Oct 1 – Dec 31 More info This data comes from the CMS Payroll-Based Journal report covering October 1 – December 31, 2025.
Registered Nurse

Manages medical care and health needs.

RN Staff Info All 4 RN Staff are full-time employees. No contractors work on this role. 4
Average shift length Info Average shift length. Calculated as total hours divided by days worked and average staff per day. 7.9 hours
Licensed Practical Nurse

Assists with medical care and medications.

LPN Staff Info All 17 LPN Staff are full-time employees. No contractors work on this role. 17
Average shift length Info Average shift length. Calculated as total hours divided by days worked and average staff per day. 7.2 hours
Certified Nursing Assistant

Helps with daily care and mobility.

CNA Staff Info All 50 CNA Staff are full-time employees. No contractors work on this role. 50
Average shift length Info Average shift length. Calculated as total hours divided by days worked and average staff per day. 7.3 hours

Contractor staffing

Q4 2025 · Oct 1 – Dec 31 More info This data comes from the CMS Payroll-Based Journal report covering October 1 – December 31, 2025.

Total hours from contractors

2.7%

802 contractor hours this quarter

Clinical Nurse Specialist: 4 Physical Therapy Assistant: 3 Physical Therapy Aide: 2 Speech Language Pathologist: 2 Qualified Social Worker: 2 Respiratory Therapy Technician: 1

Staff by category

Q4 2025 · Oct 1 – Dec 31 More info This data comes from the CMS Payroll-Based Journal report covering October 1 – December 31, 2025.
Certified Nursing Assistant5005017,42492100%7.3
Licensed Practical Nurse170174,37592100%7.2
Registered Nurse4041,79692100%7.9
RN Director of Nursing4041,7777683%8.5
Nurse Aide in Training3031,27192100%7.2
Clinical Nurse Specialist3477267986%6.3
Dietitian1015446368%8.6
Administrator1015286672%8
Nurse Practitioner1015286672%8
Mental Health Service Worker1014896470%7.6
Physical Therapy Aide0223026672%4.6
Speech Language Pathologist0222996672%4.5
Respiratory Therapy Technician011695257%1.3
Physical Therapy Assistant033433437%1.2
Qualified Social Worker022989%1.1
50 Certified Nursing Assistant
% of Days 100%
17 Licensed Practical Nurse
% of Days 100%
4 Registered Nurse
% of Days 100%
4 RN Director of Nursing
% of Days 83%
3 Nurse Aide in Training
% of Days 100%
7 Clinical Nurse Specialist
% of Days 86%
1 Dietitian
% of Days 68%
1 Administrator
% of Days 72%
1 Nurse Practitioner
% of Days 72%
1 Mental Health Service Worker
% of Days 70%
2 Physical Therapy Aide
% of Days 72%
2 Speech Language Pathologist
% of Days 72%
1 Respiratory Therapy Technician
% of Days 57%
3 Physical Therapy Assistant
% of Days 37%
2 Qualified Social Worker
% of Days 9%

Penalties and fines

Federal penalties imposed by CMS for regulatory violations, including civil money penalties (fines) and denials of payment for new Medicare/Medicaid admissions.

Source: CMS Penalties Database

No penalties in the past 3 years

No civil money penalties or payment denials were reported in the last 3 years.

Quality of care over time

These measures show how residents usually do over time at this home, based on health outcomes and preventive care.

High-risk clinical events score Info A composite score based on pressure ulcers, falls with injury, weight loss, walking ability decline, and activities of daily living decline. 7.3
5% better than Arkansas average

Arkansas average: 7.7

Functional decline score Info A composite score based on activities of daily living decline, walking ability decline, and incontinence. 12.1
9% better than Arkansas average

Arkansas average: 13.3

Long-stay resident measures
Above average Arkansas avg: 4.2 Info CMS star rating based on long-stay quality measure performance. 5 stars = significantly above average, 1 star = significantly below average.
Need for Help with Daily Activities Increased Info Percent of long-stay residents whose need for help with daily activities has increased 5.8%
50% better than Arkansas average

Arkansas average: 11.5%

Walking Ability Worsened Info Percent of long-stay residents whose ability to move independently worsened 15.7%
18% worse than Arkansas average

Arkansas average: 13.4%

Low Risk Residents with Bowel/Bladder Incontinence Info Percent of low risk long-stay residents who lose control of their bowels or bladder 14.8%
In line with Arkansas average

Arkansas average: 15.1%

Falls with Major Injury Info Percent of long-stay residents experiencing one or more falls with major injury 3.8%
In line with Arkansas average

Arkansas average: 3.9%

High Risk Residents with Pressure Ulcers Info Percent of long-stay high risk residents with pressure ulcers 6.1%
29% worse than Arkansas average

Arkansas average: 4.7%

Urinary Tract Infection Info Percent of long-stay residents with a urinary tract infection 1.9%
50% worse than Arkansas average

Arkansas average: 1.3%

Lost Too Much Weight Info Percent of long-stay residents who lose too much weight 5.1%
In line with Arkansas average

Arkansas average: 5.0%

Depressive Symptoms Info Percent of long-stay residents who have depressive symptoms 0.0%
100% better than Arkansas average

Arkansas average: 1.5%

Antipsychotic Use Info Percent of long-stay residents who received an antipsychotic medication 7.6%
28% better than Arkansas average

Arkansas average: 10.5%

Pneumococcal Vaccine Info Percent of long-stay residents assessed and appropriately given the pneumococcal vaccine 97.0%
In line with Arkansas average

Arkansas average: 94.4%

Influenza Vaccine Info Percent of long-stay residents assessed and appropriately given the seasonal influenza vaccine 97.4%
In line with Arkansas average

Arkansas average: 96.2%

Hospitalizations per 1,000 days Info Number of hospitalizations per 1,000 long-stay resident days. 2.12
8% worse than Arkansas average

Arkansas average: 1.97

ED visits per 1,000 days Info Number of outpatient emergency department visits per 1,000 long-stay resident days. 1.38
37% better than Arkansas average

Arkansas average: 2.18

Short-stay resident measures
Average Arkansas avg: 2.7 Info CMS star rating based on short-stay quality measure performance. 5 stars = much above average, 1 star = much below average.
Pneumococcal Vaccine Info Percent of short-stay residents assessed and appropriately given the pneumococcal vaccine 70.3%
13% worse than Arkansas average

Arkansas average: 80.9%

Antipsychotic medication increase Info Percent of short-stay residents who newly received an antipsychotic medication 0.0%
100% better than Arkansas average

Arkansas average: 1.5%

Influenza Vaccine Info Percent of short-stay residents assessed and appropriately given the seasonal influenza vaccine 87.8%
13% better than Arkansas average

Arkansas average: 77.7%

Re-hospitalized after SNF stay Info Percentage of short-stay residents who were re-hospitalized after their nursing home admission. 31.8%
26% worse than Arkansas average

Arkansas average: 25.2%

Emergency department visits Info Percentage of short-stay residents who had an outpatient emergency department visit. 20.4%
48% worse than Arkansas average

Arkansas average: 13.8%

Falls with major injury Info Percentage of SNF residents who experience falls with major injury during their stay. 0.0%
100% better than Arkansas average

Arkansas average: 0.8%

Ability to care for self at discharge Info Percentage of residents at or above expected ability to care for themselves at discharge. 65.2%
21% better than Arkansas average

Arkansas average: 53.7%

Successful return to home or community Info Rate of successful return to home or community from a skilled nursing facility. 50.6%
In line with Arkansas average

Arkansas average: 50.6%

Breakdown by payment type

Medicare

16% of new residents, usually for short-term rehab.

Typical stay 1 - 2 months

Private pay

66% of new residents, often for short stays.

Typical stay 29 days

Medicaid

17% of new residents, often for long-term daily care.

Typical stay 2 years

Facility Characteristics

Source: CMS Long-Term Care Facility Characteristics (Data as of Jan 2026)

Total residents 74
Medicare
1
1.4% of residents
Medicaid
60
81.1% of residents
Private pay or other
13
17.6% of residents
Programs & Services
Residents Group

Residents meet regularly to discuss policies, care quality, and activities

Nurse Aide Training

State-approved Nurse Aide Training and Competency Evaluation Program on-site

Active Resident Council

Organized group of residents that meets regularly to discuss facility policies, quality of life, and activities.

Finances and operations

Based on CMS SNF Cost Report for fiscal year ending in 12/2023.

For-profit
Corporation
Net patient revenue Info Net patient revenue — what the home actually collects for resident care, after contractual allowances, bad debt and discounts are subtracted from its gross charges (CMS cost report, Worksheet G-3). It covers resident care only; money the home earns from other sources is shown separately as "Other income."
$6.8M
Net patient income Info Net patient income: net patient revenue minus the home's total operating expenses. A positive figure means it earns more from resident care than it spends to deliver it; a negative figure means the opposite. It excludes non-operating "other income."
$622.4K
For-profit Corporation
Net patient revenue Info Net patient revenue — what the home actually collects for resident care, after contractual allowances, bad debt and discounts are subtracted from its gross charges (CMS cost report, Worksheet G-3). It covers resident care only; money the home earns from other sources is shown separately as "Other income."
$6.8M
Net patient income Info Net patient income: net patient revenue minus the home's total operating expenses. A positive figure means it earns more from resident care than it spends to deliver it; a negative figure means the opposite. It excludes non-operating "other income."
$622.4K
Other income Info Money the home earns outside of resident care — such as investments, grants, rentals and other non-operating sources (CMS cost report, Worksheet G-3). It is tracked separately from net patient revenue: it is not part of that figure, and it is not included in net patient income.
$10.3K
Payroll costs Info Staff salaries plus wage-related costs — benefits such as payroll taxes, health insurance and retirement — from the home's own accounting records (CMS cost report, Worksheet A). Contract or agency labor is counted separately, under other operating costs.
$3.0M 44.1% of net patient revenue Info Payroll as a share of revenue: staff salaries and wage-related benefits divided by net patient revenue. A higher figure means more of each revenue dollar goes to staff pay.
Other operating costs Info Everything it costs to run the home apart from payroll — food, utilities, supplies, maintenance, contract labor and administration. Calculated as total operating expense minus payroll (staff salaries and wage-related benefits).
$3.2M
Total costs Info The home's total operating expense for the year — all the costs of running it, salaries included (CMS cost report, Worksheet G-3).
$6.2M

Who this home usually serves

TYPE OF STAY

Primarily long-term care, limited rehab

Most residents stay long-term, while a smaller portion are admitted for short-term rehab.

Most new residents arrive under private pay (66% of admissions), and a typical private pay stay runs around 29 days.

Admissions
143 total

Coverage residents most often arrive under.

Medicare 16%
Private pay 66%
Medicaid 17%
Discharges
139 total

Coverage residents most often leave under.

Medicare 19%
Private pay 64%
Medicaid 17%

Places of interest near Bailey Creek Health and Rehab

Address 0.0 miles from city center Info Estimated distance in miles from Texarkana's city center to Bailey Creek Health and Rehab's address, calculated via Google Maps.

Calculate Travel Distance to Bailey Creek Health and Rehab

Add your location

Address

Financial Assistance for
Nursing Home in Arkansas

Bailey Creek Health and Rehab is located in Texarkana, Arkansas.
Here are the financial assistance programs available to residents in Arkansas.

Get Financial aid guidance

ARChoices

Arkansas Medicaid ARChoices

Age 65+ or 21+ with disability
General Arkansas resident, Medicaid- eligible, nursing home-level care need.
Income Limits (2025) ~$2,829/month 300% FBR, individual
Asset Limits $2,000 (individual), $3,000 (couple).
AR

Rural focus; possible waitlists.

Benefits
Personal care (5-7 hours/day) Meals ($7/meal) Respite care (240 hours/year) Adult day services ($60/day)

Choices in Living Resource Center

Arkansas Choices in Living

Age 60+
General Arkansas resident.
Income Limits No strict limit; prioritizes low-income.
Asset Limits Not applicable.
AR

Limited direct funding; mostly referral-based.

Benefits
Care coordination Limited respite (up to 5 days/year) Transportation assistance (~5 trips/month)

Living Choices Assisted Living Waiver

Arkansas Medicaid Living Choices Assisted Living Waiver

Age 65+
General Arkansas resident, requires nursing home-level care, lives in a Level II assisted living facility.
Income Limits (2025) ~$2,829/month 300% FBR, individual
Asset Limits $2,000 (individual), $3,000 (couple); spousal rules apply.
AR

Limited provider network; excludes Level I facilities (no nursing services).

Benefits
Personal care (~5 hours/day) Medication management Nursing Activities Transportation

Program of All-Inclusive Care for the Elderly (PACE)

Arkansas Medicaid PACE

Age 55+
General Arkansas resident, nursing home-level care, safe with PACE support.
Income Limits (2025) ~$2,829/month 300% FBR
Asset Limits $2,000 (individual), $3,000 (couple).
AR

Limited geographic availability.

Benefits
Primary/preventive care Personal care (5-7 hours/day) Meals Transportation Therapy

Arkansas State Plan Personal Care

Arkansas Medicaid Personal Care Program

Age
General Any age, Arkansas resident, needs ADL/IADL help, Medicaid-eligible.
Income Limits (2025) ~$1,004/month individual
Asset Limits $9,660 (individual), $14,470 (couple).
AR

No nursing home-level care requirement.

Benefits
Personal care (~4-6 hours/day) Homemaker services (e.g., meal prep)

Frequently Asked Questions about Bailey Creek Health and Rehab

What neighborhood is Bailey Creek Health and Rehab in?

Bailey Creek Health and Rehab is in the Downtown neighborhood of Texarkana.

Who is the owner of Bailey Creek Health and Rehab?

Bailey Creek Health and Rehab is legally operated by TXKNC, Inc., and administered by Sarah Gaither.

Is Bailey Creek Health and Rehab in a walkable area?

Bailey Creek Health and Rehab has a walk score of 65. Moderately walkable. Some errands can be accomplished on foot, with a mix of nearby amenities.

What is the occupancy rate at Bailey Creek Health and Rehab?

Bailey Creek Health and Rehab's occupancy is 64%.

Does Bailey Creek Health and Rehab operate as a for-profit or non-profit?

Bailey Creek Health and Rehab is registered as a for-profit in AR.

Who is the administrator of Bailey Creek Health and Rehab?

Sarah Gaither is the administrator of Bailey Creek Health and Rehab.

How many beds does Bailey Creek Health and Rehab have?

Bailey Creek Health and Rehab has 115 beds.

Guides for Better Senior Living

Care Cost Calculator: See Prices in Your Area

Nursing Home Data Explorer

Don’t Wait Too Long: 7 Red Flag Signs Your Parent Needs Assisted Living Now

The True Cost of Assisted Living in 2025 – And How Families Are Paying For It

Understanding Senior Living Costs: Pricing Models, Discounts & Financial Assistance