Life Care Center of Kansas City
CMS overall rating Info CMS (the Centers for Medicare & Medicaid Services) is the federal agency that rates nursing home quality. Its Overall Rating runs from 1 to 5 stars, combining health inspections, staffing, and quality measures, with inspections weighted most heavily.

Life Care Center of Kansas City

CMS overall rating Info CMS (the Centers for Medicare & Medicaid Services) is the federal agency that rates nursing home quality. Its Overall Rating runs from 1 to 5 stars, combining health inspections, staffing, and quality measures, with inspections weighted most heavily.
Calculator: See prices in your area
Life Care Center of Kansas City accepts Medicare, Medicaid, and private pay.

Overview of Life Care Center of Kansas City

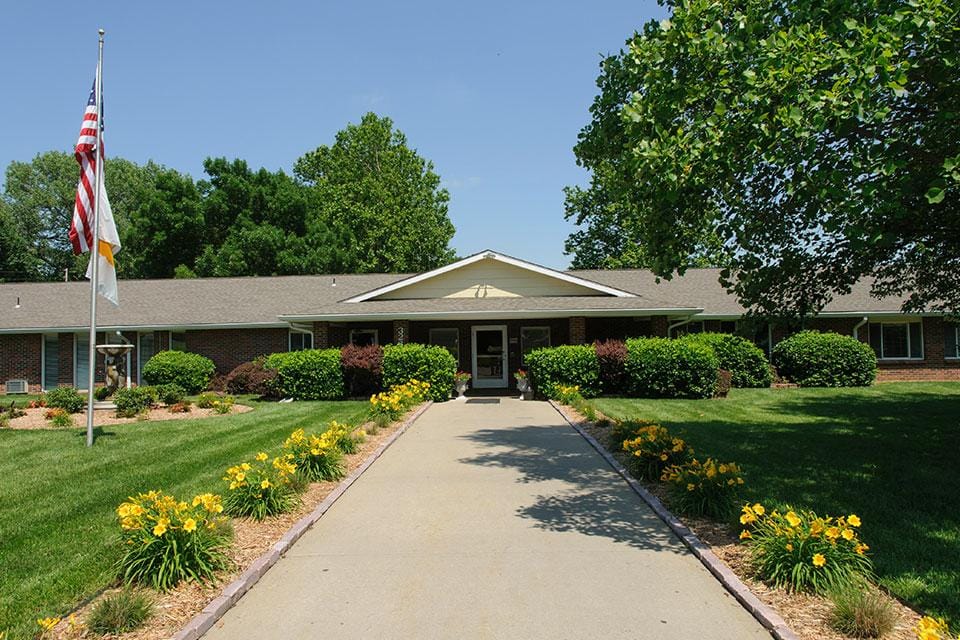
Life Care Center of Kansas City is a skilled nursing and rehabilitation center. The upscale nursing home aims to change the meaning of skilled nursing and rehabilitation for seniors through the exceptional level of care that is delivered by their patient-friendly staff as an approach to offer the best care possible for their residents. Life Care Center can be trusted as a safe and secure community that cares for every patient’s needs. 
Convenience and hassle-free living is the center of Life Care Center services: medication management, post-surgical care, and wound care; as well as their 24-hour skilled nursing care services provide compassionate care as it is their utmost priority. Other services include 24/7 easy admissions, fall prevention, IV therapy, discharge planning, and case management.

(913) 299-1770

Quality ratings

Measured by Centers for Medicare & Medicaid Services (CMS)

Overall rating Info The Overall CMS Rating combines results from health inspections, staffing levels and quality measures. Health inspections carry the most weight. Staffing and quality scores can increase or decrease the final rating based on performance compared to state and national standards.
▲ 20.8% Above MO avg. ▲ 20.8% Above MO avg.MO average: 2.5Click the badge to see the full State ranking.Click here to see the full State ranking.
Health Inspection Info Based on the results of the facility's three most recent standard inspections and any complaint investigations. CMS reviews the number, scope, and severity of deficiencies, with more recent findings weighted more heavily.
▼ 27.9% Below MO avg. ▼ 27.9% Below MO avg.MO average: 2.8Click the badge to see the full State ranking.Click here to see the full State ranking.
Staffing Info Measures average nursing staff hours per resident per day, including Registered Nurses (RNs) and total nursing staff. Ratings are adjusted based on the level of care residents require and are compared to state and national benchmarks.
▲ 82.8% Above MO avg. ▲ 82.8% Above MO avg.MO average: 2.2Click the badge to see the full State ranking.Click here to see the full State ranking.
Quality Measures Info Based on clinical and physical health indicators reported to CMS, such as hospital readmissions, falls, pressure ulcers, and improvements in mobility. These measures reflect how well residents' health needs are being managed.
▲ 88.1% Above MO avg. ▲ 88.1% Above MO avg.MO average: 2.7Click the badge to see the full State ranking.Click here to see the full State ranking.

Staffing hours breakdown

Info Daily nursing hours per resident by staff type, reported to CMS. Higher is generally better — compare this facility to state and national averages to see where staffing stands.

Hours per resident per day — compared to Missouri state averages

Total nursing care / resident Info Total adjusted nursing hours per resident per day, combining RN, LPN, and aide time. CMS adjusts this for case-mix so facilities can be fairly compared.
4h 55m per day
This facility Missouri avg (3h 44m per day)
vs Missouri avg
+32%

4 of 6 metrics below state avg

Standout metric Physical Therapist is +151% above state avg
Staff typeHours / Day / Residentvs state avg
Registered Nurse (RN) Info RNs hold the highest nursing license and can assess residents, interpret test results, and direct care plans. More RN hours per day often signals stronger clinical oversight and faster response to health changes. 28m per day ▼ 35% State avg: 43m per day · National avg: 41m per day
LPN / LVN Info Licensed Practical Nurses (LPNs) or Licensed Vocational Nurses (LVNs) deliver routine hands-on care — medication administration, wound dressing, and monitoring vital signs. They work under RN supervision and make up a large share of daily bedside care. 1h 9m per day ▲ 73% State avg: 40m per day · National avg: 52m per day
Nurse Aide Info Certified Nurse Aides (CNAs) provide the most direct day-to-day assistance: bathing, dressing, feeding, and mobility. Nurse aide hours are typically the largest staffing category and directly affect residents' quality of life. 2h 6m per day ▼ 22% State avg: 2h 42m per day · National avg: 2h 21m per day
Weekend Total Nursing Info Combined nursing hours (RN + LPN + Nurse Aide) per resident per day on weekends. Staffing often drops on weekends — this figure reveals whether the facility maintains adequate coverage outside of weekday hours. 3h 7m per day ▼ 13% State avg: 3h 35m per day · National avg: 3h 26m per day
Physical Therapist Info Hours per resident per day provided by licensed Physical Therapists (PTs) or PT Assistants. PT services help residents recover mobility after injury or illness and are especially important for post-acute (short-stay) rehabilitation. 5m per day ▲ 151% State avg: 2m per day · National avg: 4m per day
Weekend RN Info Registered nurse hours specifically on weekends. Facilities sometimes reduce RN presence on Saturdays and Sundays — a low weekend RN figure compared to weekday hours can indicate reduced clinical oversight when most administrative staff are absent. 13m per day ▼ 54% State avg: 29m per day · National avg: 29m per day

Capacity and availability

Avg. Length of Stay
106 days
Bed community size
82-bed community Rank #56 / 224Bed count — State benchmarkedThis home is ranked 56th out of 224 homes in Kansas. Shows this facility's certified or reported bed count compared to other Kansas facilities. Larger communities may offer more amenities, programs, and on-site services for residents and families.Ranking totals vary by category as each rank only includes facilities that report data for that metric. Homes missing that data point aren't included in the ranking.Click the rank badge to see the full State ranking.Click here to see the full State ranking.
A larger shared setting that may offer more common spaces and organized community services.
Walk Score
Walk Score: 34 / 100 Rank #243 / 363Walk Score — State benchmarkedThis home is ranked 243rd out of 363 homes in Kansas. Shows how walkable this facility's neighborhood is compared to the average Walk Score across Kansas facilities. Higher scores benefit residents, families, and staff.Ranking totals vary by category as each rank only includes facilities that report data for that metric. Homes missing that data point aren't included in the ranking.Click the rank badge to see the full State ranking.Click here to see the full State ranking.
Somewhat walkable. A few nearby services may be reachable on foot, but most trips require transportation.

About this community

Occupancy

Occupancy rate
70%
Similar to the Missouri average: 66.6%
Occupied beds
57 / 82
Average occupied beds in Missouri homes 72 beds

License Details

Facility TypeNursing Facility
StatusActive
CountyWyandotte
License Number175281
CMS Certification Number175281

Ownership & Operating Entity

Life Care Center of Kansas City is administrated by Matthew Memmer.

OwnerKANSAS CITY MEDICAL INVESTORS LLC

Type Of Units

NF (Nursing Facility)
82 units
SNF/NF (Combined)
82 units
Total beds
82 units

Staffing

Key information about the people who lead and staff this community.

Leadership

ContactRandy Sutterfield, Executive Director

Contact Life Care Center of Kansas City

Inspection History

In Missouri, the Department for Aging and Disability Services, Survey and Certification Commission performs the unannounced inspections required for facility licensing and federal certification.

Since 2022 · 4 years of data 56 deficiencies 29 inspections

Inspection Scorecard Info This scorecard compares key inspection, citation, and complaint metrics at this facility against the Missouri state average. Metrics rated ≥15% worse than average are highlighted in red; those ≥15% better are highlighted in green.

Since 2022 vs. Missouri state average
Overall vs. KS average 0 Worse No metrics in this bucket. 4 Better Metrics better than Missouri average:
• Total deficiencies (44% below)
• Deficiencies per year (44% below)
• Deficiencies per inspection (39% below)
• Total inspections (9% below)
Latest Inspection September 3, 2025

Deficiencies Info Deficiencies are formal regulatory issues recorded during state inspections.

This FacilityKS Averagevs. KS Avg
Total deficiencies Info Formal regulatory issues recorded by inspectors across all inspection types. 56100 This facility has 44% fewer total deficiencies than a typical Missouri nursing home (56 vs. KS avg 100).↓ 44% better
Deficiencies per year Info Average deficiencies per year since 2022. 1425 This facility has 44% fewer deficiencies per year than a typical Missouri nursing home (14 vs. KS avg 25).↓ 44% better
Deficiencies per inspection Info Average deficiencies per inspection. 1.93.1 This facility has 39% fewer deficiencies per inspection than a typical Missouri nursing home (1.9 vs. KS avg 3.1).↓ 39% better

Inspections Info State inspections evaluate whether the facility meets health and safety standards.

This FacilityKS Averagevs. KS Avg
Total inspections Info Combined count of all routine and focused inspections. Excludes complaint investigations. 2932 This facility has 9% fewer total inspections than a typical Missouri nursing home (29 vs. KS avg 32).↓ 9% better

Inspection Reports Summary Info An editor-reviewed summary of the themes and findings across this facility's recent inspection reports.

  • The most recent inspection on August 20, 2025, identified multiple deficiencies related to resident care, medication management, infection control, and facility safety. Earlier inspections showed a pattern of similar issues, including inadequate supervision to prevent elopement, incomplete care documentation, and failures in accommodating resident needs and maintaining a safe environment. Deficiencies frequently involved resident assistance with daily living activities, pressure ulcer prevention, medication monitoring, and sanitary food storage. A complaint investigation in July 2024 was substantiated regarding inadequate supervision that allowed a resident to exit the facility unsupervised. The inspection history indicates ongoing challenges with compliance, with no clear improvement trend over time.

Health Inspection History

Inspections since 2022
Total health inspections 6

Missouri average 6.6


Last Health inspection on Aug 2025

Total health citations
61

Missouri average 36.5

Citations per inspection
10.17

Missouri average 5.67


Health citations are formal notices following inspections when they fail to comply with safety and care standards.

57 of 61 citations resulted from standard inspections; and 4 of 61 resulted from complaint investigations.

Breakdown of citation severity (last 4 years)
Critical health citations
0
100% better than Missouri average

Missouri average: 0.7


Serious health citations
1
In line with Missouri average

Missouri average: 1

0 critical citations Missouri average: 0.7

1 serious citation Missouri average: 1

59 moderate citations Missouri average: 33.6

1 minor citation Missouri average: 1.2
Citations history (last 4 years)
Infection Control moderate citation Aug 20, 2025
Corrected

Infection Control moderate citation Aug 20, 2025
Corrected

Nutrition moderate citation Aug 20, 2025
Corrected

Pharmacy moderate citation Aug 20, 2025
Corrected

Staffing Data

Reporting period: October 1 – December 31, 2025 (Q4 2025). Source: CMS Payroll-Based Journal report.

Total staff 85
Employees 83
Contractors 2
Staff to resident ratio 1.47 : 1
13% fewer staff per resident than Missouri average
Missouri average ratio: 1.69 : 1 Missouri average ratio: 1.69 : 1See full Missouri ranking
Avg staff/day 34
Average shift 7.5 hours
7% worse than Missouri average
Missouri average: 8.1 hours Missouri average shift: 8.1 hoursSee full Missouri ranking
Total staff hours (quarter) 23,593

Nursing staff breakdown

Q4 2025 · Oct 1 – Dec 31 More info This data comes from the CMS Payroll-Based Journal report covering October 1 – December 31, 2025.
Registered Nurse

Manages medical care and health needs.

RN Staff Info All 6 RN Staff are full-time employees. No contractors work on this role. 6
Average shift length Info Average shift length. Calculated as total hours divided by days worked and average staff per day. 7.2 hours
Licensed Practical Nurse

Assists with medical care and medications.

LPN Staff Info All 16 LPN Staff are full-time employees. No contractors work on this role. 16
Average shift length Info Average shift length. Calculated as total hours divided by days worked and average staff per day. 8 hours
Certified Nursing Assistant

Helps with daily care and mobility.

CNA Staff Info All 35 CNA Staff are full-time employees. No contractors work on this role. 35
Average shift length Info Average shift length. Calculated as total hours divided by days worked and average staff per day. 7.3 hours

Contractor staffing

Q4 2025 · Oct 1 – Dec 31 More info This data comes from the CMS Payroll-Based Journal report covering October 1 – December 31, 2025.

Total hours from contractors

0.2%

55 contractor hours this quarter

Medical Director: 1 Occupational Therapy Assistant: 1

Staff by category

Q4 2025 · Oct 1 – Dec 31 More info This data comes from the CMS Payroll-Based Journal report covering October 1 – December 31, 2025.
Certified Nursing Assistant350359,09492100%7.3
Licensed Practical Nurse160165,41592100%8
Medication Aide/Technician8082,42992100%7.4
Clinical Nurse Specialist2021,0246470%8
Registered Nurse6061,0068491%7.2
RN Director of Nursing2029246874%7.4
Administrator1015286672%8
Nurse Practitioner2025156470%7.9
Mental Health Service Worker1015046368%8
Speech Language Pathologist1014926267%7.9
Respiratory Therapy Technician1014606470%7.2
Dietitian1014056571%6.2
Other Dietary Services Staff1013816267%6.1
Occupational Therapy Aide1011742426%7.3
Qualified Social Worker3031253235%3.7
Physical Therapy Assistant202621415%4.4
Medical Director0112933%9.5
Occupational Therapy Assistant0112633%8.7
35 Certified Nursing Assistant
% of Days 100%
16 Licensed Practical Nurse
% of Days 100%
8 Medication Aide/Technician
% of Days 100%
2 Clinical Nurse Specialist
% of Days 70%
6 Registered Nurse
% of Days 91%
2 RN Director of Nursing
% of Days 74%
1 Administrator
% of Days 72%
2 Nurse Practitioner
% of Days 70%
1 Mental Health Service Worker
% of Days 68%
1 Speech Language Pathologist
% of Days 67%
1 Respiratory Therapy Technician
% of Days 70%
1 Dietitian
% of Days 71%
1 Other Dietary Services Staff
% of Days 67%
1 Occupational Therapy Aide
% of Days 26%
3 Qualified Social Worker
% of Days 35%
2 Physical Therapy Assistant
% of Days 15%
1 Medical Director
% of Days 3%
1 Occupational Therapy Assistant
% of Days 3%

Penalties and fines

Federal penalties imposed by CMS for regulatory violations, including civil money penalties (fines) and denials of payment for new Medicare/Medicaid admissions.

Source: CMS Penalties Database

No penalties in the past 3 years

No civil money penalties or payment denials were reported in the last 3 years.

Quality of care over time

These measures show how residents usually do over time at this home, based on health outcomes and preventive care.

High-risk clinical events score Info A composite score based on pressure ulcers, falls with injury, weight loss, walking ability decline, and activities of daily living decline. 3.5
67% better than Missouri average

Missouri average: 10.5

Functional decline score Info A composite score based on activities of daily living decline, walking ability decline, and incontinence. 7.0
66% better than Missouri average

Missouri average: 20.7

Long-stay resident measures
Significantly above average Missouri avg: 3.0 Info CMS star rating based on long-stay quality measure performance. 5 stars = significantly above average, 1 star = significantly below average.
Need for Help with Daily Activities Increased Info Percent of long-stay residents whose need for help with daily activities has increased 3.2%
83% better than Missouri average

Missouri average: 19.0%

Walking Ability Worsened Info Percent of long-stay residents whose ability to move independently worsened 3.0%
84% better than Missouri average

Missouri average: 19.4%

Low Risk Residents with Bowel/Bladder Incontinence Info Percent of low risk long-stay residents who lose control of their bowels or bladder 14.7%
38% better than Missouri average

Missouri average: 23.8%

Falls with Major Injury Info Percent of long-stay residents experiencing one or more falls with major injury 3.3%
26% better than Missouri average

Missouri average: 4.4%

High Risk Residents with Pressure Ulcers Info Percent of long-stay high risk residents with pressure ulcers 6.2%
33% worse than Missouri average

Missouri average: 4.6%

Urinary Tract Infection Info Percent of long-stay residents with a urinary tract infection 0.4%
87% better than Missouri average

Missouri average: 3.1%

Lost Too Much Weight Info Percent of long-stay residents who lose too much weight 1.7%
66% better than Missouri average

Missouri average: 5.1%

Depressive Symptoms Info Percent of long-stay residents who have depressive symptoms 0.0%
100% better than Missouri average

Missouri average: 5.2%

Antipsychotic Use Info Percent of long-stay residents who received an antipsychotic medication 8.0%
53% better than Missouri average

Missouri average: 16.9%

Pneumococcal Vaccine Info Percent of long-stay residents assessed and appropriately given the pneumococcal vaccine 99.2%
8% better than Missouri average

Missouri average: 91.9%

Influenza Vaccine Info Percent of long-stay residents assessed and appropriately given the seasonal influenza vaccine 98.5%
In line with Missouri average

Missouri average: 95.5%

Hospitalizations per 1,000 days Info Number of hospitalizations per 1,000 long-stay resident days. 3.24
76% worse than Missouri average

Missouri average: 1.84

ED visits per 1,000 days Info Number of outpatient emergency department visits per 1,000 long-stay resident days. 8.63
300% worse than Missouri average

Missouri average: 2.16

Short-stay resident measures
Above average Missouri avg: 2.6 Info CMS star rating based on short-stay quality measure performance. 5 stars = much above average, 1 star = much below average.
Pneumococcal Vaccine Info Percent of short-stay residents assessed and appropriately given the pneumococcal vaccine 99.0%
31% better than Missouri average

Missouri average: 75.6%

Antipsychotic medication increase Info Percent of short-stay residents who newly received an antipsychotic medication 0.0%
100% better than Missouri average

Missouri average: 2.2%

Influenza Vaccine Info Percent of short-stay residents assessed and appropriately given the seasonal influenza vaccine 85.2%
16% better than Missouri average

Missouri average: 73.5%

Re-hospitalized after SNF stay Info Percentage of short-stay residents who were re-hospitalized after their nursing home admission. 20.8%
10% better than Missouri average

Missouri average: 23.0%

Emergency department visits Info Percentage of short-stay residents who had an outpatient emergency department visit. 23.5%
101% worse than Missouri average

Missouri average: 11.7%

Falls with major injury Info Percentage of SNF residents who experience falls with major injury during their stay. 0.0%
100% better than Missouri average

Missouri average: 0.8%

Breakdown by payment type

Medicare

18% of new residents, usually for short-term rehab.

Typical stay 1 months

Private pay

33% of new residents, often for short stays.

Typical stay 1 - 2 months

Medicaid

50% of new residents, often for long-term daily care.

Typical stay 5 - 6 months

Facility Characteristics

Source: CMS Long-Term Care Facility Characteristics (Data as of Jan 2026)

Total residents 58
Medicaid
46
79.3% of residents
Private pay or other
12
20.7% of residents
Programs & Services
Residents Group

Residents meet regularly to discuss policies, care quality, and activities

Active Resident Council

Organized group of residents that meets regularly to discuss facility policies, quality of life, and activities.

Finances and operations

Based on CMS SNF Cost Report for fiscal year ending in 09/2023.

Privately-owned community
Operated by a single business entity.
Net patient revenue Info Net patient revenue — what the home actually collects for resident care, after contractual allowances, bad debt and discounts are subtracted from its gross charges (CMS cost report, Worksheet G-3). It covers resident care only; money the home earns from other sources is shown separately as "Other income."
$5.4M
Net patient income Info Net patient income: net patient revenue minus the home's total operating expenses. A positive figure means it earns more from resident care than it spends to deliver it; a negative figure means the opposite. It excludes non-operating "other income."
-$470.8K
Privately-owned community Operated by a single business entity.
Net patient revenue Info Net patient revenue — what the home actually collects for resident care, after contractual allowances, bad debt and discounts are subtracted from its gross charges (CMS cost report, Worksheet G-3). It covers resident care only; money the home earns from other sources is shown separately as "Other income."
$5.4M
Net patient income Info Net patient income: net patient revenue minus the home's total operating expenses. A positive figure means it earns more from resident care than it spends to deliver it; a negative figure means the opposite. It excludes non-operating "other income."
-$470.8K
Other income Info Money the home earns outside of resident care — such as investments, grants, rentals and other non-operating sources (CMS cost report, Worksheet G-3). It is tracked separately from net patient revenue: it is not part of that figure, and it is not included in net patient income.
$4.1K
Payroll costs Info Staff salaries plus wage-related costs — benefits such as payroll taxes, health insurance and retirement — from the home's own accounting records (CMS cost report, Worksheet A). Contract or agency labor is counted separately, under other operating costs.
$3.9M 72.5% of net patient revenue Info Payroll as a share of revenue: staff salaries and wage-related benefits divided by net patient revenue. A higher figure means more of each revenue dollar goes to staff pay.
Other operating costs Info Everything it costs to run the home apart from payroll — food, utilities, supplies, maintenance, contract labor and administration. Calculated as total operating expense minus payroll (staff salaries and wage-related benefits).
$2.0M
Total costs Info The home's total operating expense for the year — all the costs of running it, salaries included (CMS cost report, Worksheet G-3).
$5.9M

Who this home usually serves

TYPE OF STAY

Mostly long-term care residents

Most residents stay for extended periods and receive ongoing daily care.

Most new residents arrive under Medicaid (50% of admissions), and a typical Medicaid stay runs around 5 - 6 months.

Admissions
200 total

Coverage residents most often arrive under.

Medicare 18%
Private pay 33%
Medicaid 50%
Discharges
201 total

Coverage residents most often leave under.

Medicare 8%
Private pay 41%
Medicaid 51%

Places of interest near Life Care Center of Kansas City

Address 5.4 miles from city center Info Estimated distance in miles from Kansas City's city center to Life Care Center of Kansas City's address, calculated via Google Maps. — 3.87 miles to nearest hospital (Providence Medical Center)

Calculate Travel Distance to Life Care Center of Kansas City

Add your location

Address

Compare Nursing Home around Kansas

The information below is reported by the Missouri Department of Health and Senior Services, Division of Regulation and Licensure.

5 facilities compared · CMS & MO Dept. of Health data

Linden Woods Village
NH
AL
IL
Gladstone
40
Facility 40
MO AVG 97
Rank #419 / 454
85.0%
Facility 85.0%
MO AVG 66.6%
Rank #79 / 434
+28%
4.51
Facility 4.51
MO AVG 3.74
Rank #48 / 282
+31%+21%
$0
Facility $0
MO AVG $76.9k
Rank #1 / 289
12
Facility 12
MO AVG 36.5
Rank #30 / 287
4.0
Facility 4.0
MO AVG 5.7
Rank #77 / 287
-38-
53
Facility 53
MO AVG 45
Rank #217 / 563
Amanda Fizer
$8.5M
Facility $8.5M
MO AVG $8.4M
Rank #73 / 292
$3.8M
Facility $3.8M
MO AVG $3.3M
Rank #98 / 292
44.8%
Facility 44.8%
MO AVG 45.6%
Rank #225 / 292
265855
Northland Rehabilitation & Health Care
NH
HC
RC
Kansas City (Chouteau Estates)
118
Facility 118
MO AVG 97
Rank #145 / 454
82.2%
Facility 82.2%
MO AVG 66.6%
Rank #95 / 434
+23%
4.09
Facility 4.09
MO AVG 3.74
Rank #87 / 282
-22%+9%
$0
Facility $0
MO AVG $76.9k
Rank #1 / 289
18
Facility 18
MO AVG 36.5
Rank #66 / 287
6.0
Facility 6.0
MO AVG 5.7
Rank #182 / 287
-101-
34
Facility 34
MO AVG 45
Rank #361 / 563
Northland Rehabilitation & Health Care Center LLC
$12.2M
Facility $12.2M
MO AVG $8.4M
Rank #28 / 292
$4.4M
Facility $4.4M
MO AVG $3.3M
Rank #39 / 292
35.8%
Facility 35.8%
MO AVG 45.6%
Rank #238 / 292
265870
Life Care Center of Kansas City
NH
Kansas City (Bethel Welborn)82 69.5% -13%4.92 -30%+6%$06110.2160- 34 Jennifer Jennings$5.4M$3.9M72.5%175281
Armour Oaks Senior Living Community
NH
AL
IL
Kansas City (Waldo Homes)
38
Facility 38
MO AVG 97
Rank #424 / 454
100.0%
Facility 100.0%
MO AVG 66.6%
Rank #1 / 434
+50%
3.03
Facility 3.03
MO AVG 3.74
Rank #235 / 282
-27%-19%
$0
Facility $0
MO AVG $76.9k
Rank #1 / 289
39
Facility 39
MO AVG 36.5
Rank #186 / 287
6.5
Facility 6.5
MO AVG 5.7
Rank #202 / 287
-100A+
73
Facility 73
MO AVG 45
Rank #70 / 563
Womens Christian Association Of Kansas City Missouri
$2.9M
Facility $2.9M
MO AVG $8.4M
Rank #271 / 292
$2.2M
Facility $2.2M
MO AVG $3.3M
Rank #227 / 292
75.8%
Facility 75.8%
MO AVG 45.6%
Rank #13 / 292
265802
The Hilltop at Blue River
NH
PC
Kansas City (South Kansas City)
160
Facility 160
MO AVG 97
Rank #42 / 454
89.4%
Facility 89.4%
MO AVG 66.6%
Rank #46 / 434
+34%
2.63
Facility 2.63
MO AVG 3.74
Rank #258 / 282
-14%-30%
$34.7k
Facility $34.7k
MO AVG $76.9k
Rank #219 / 289
50
Facility 50
MO AVG 36.5
Rank #225 / 287
5.6
Facility 5.6
MO AVG 5.7
Rank #167 / 287
2145A+
4
Facility 4
MO AVG 45
Rank #530 / 563
10425 Opco LLC
$14.4M
Facility $14.4M
MO AVG $8.4M
Rank #37 / 292
$6.3M
Facility $6.3M
MO AVG $3.3M
Rank #40 / 292
44.1%
Facility 44.1%
MO AVG 45.6%
Rank #219 / 292
265597

Financial Assistance for
Nursing Home in Missouri

Life Care Center of Kansas City is located in Kansas City, Missouri.
Here are the financial assistance programs available to residents in Missouri.

Get Financial aid guidance

Aged and Disabled Waiver

Missouri Medicaid A&D Waiver

Age 65+ or disabled
General Missouri resident, Medicaid- eligible, nursing home-level care need.
Income Limits (2025) ~$2,829/month 300% FBR, individual
Asset Limits $2,000 (individual), $3,000 (couple).
MO

Rural access prioritized.

Benefits
Personal care (5-7 hours/day) Respite (240 hours/year) Adult day care (~$65/day) Home health services

Missouri Supplemental Nursing Care (SNC)

MO SNC

Age 65+
General Missouri resident, in approved facility.
Income Limits ~$1,215/month individual
Asset Limits $2,000 individual
MO

Supplements SSI; facility-based only.

Benefits
Monthly cash payment (~$156-$292/month) for care costs

Structured Family Caregiving Waiver (SFCW)

Missouri Structured Family Caregiving Waiver

Age 65+
General Missouri resident, MO HealthNet-eligible, NFLOC, dementia diagnosis, live with caregiver.
Income Limits (2025) ~$2,901/month (300% FBR, individual); QIT required.
Asset Limits $5,909.25 (individual), $11,818.45 (couple).
MO

Caregiver must be family; small program size.

Benefits
Cash stipend ($1,000-$1,500/month) to family caregiver Respite Training Supplies ($500/year)

MO HealthNet Aged, Blind, and Disabled (ABD)

Missouri MO HealthNet ABD

Age 65+ or disabled
General Missouri resident, MO HealthNet-eligible, needs help with 1+ ADL.
Income Limits (2025) ~$1,690/month (individual, projected); spenddown allowed.
Asset Limits $5,909.25 (individual), $11,818.45 (couple).
MO

Less intensive than waivers; statewide access.

Benefits
Personal care (2-4 hours/day) Homemaker services Limited respite Medical equipment

Medicare Savings Program (MSP)

Missouri Medicare Savings Program

Age 65+ or disabled
General Missouri resident, Medicare Part A/B.
Income Limits (2025) ~$2,510/month (QMB), ~$3,380/month (SLMB), ~$3,598/month (QI)—individual.
Asset Limits $9,430 (individual), $14,130 (couple).
MO

Three tiers; no waitlist; includes Extra Help for Part D.

Benefits
Covers Part B premiums ($174.70/month) Deductibles ($240/year) Copays (~20%)

Missouri Caregiver Program (Customized Caregiver Training & Relief)

Missouri Caregiver Program

Age
General Caregivers of 60+ with dementia, Missouri resident, functional needs (2+ ADLs).
Income Limits (2025) No strict cap; prioritizes low-income ~$24,980/year individual
Asset Limits Not assessed; need-based.
MO

Administered via AAAs and Alzheimer’s Association; rural focus.

Benefits
Respite (4-6 hours/week) Training Assistive tech ($500/year) Supplies

VA Aid and Attendance (A&A) and Housebound Benefits

Missouri VA Aid and Attendance/Housebound

Age 65+ or disabled veteran/spouse
General Missouri resident, wartime service, need for ADL help (A&A) or homebound.
Income Limits (2025) Net income < ~$1,984/month (veteran with dependent, A&A); pension offsets income.
Asset Limits ~$155,356 net worth limit
MO

High veteran demand in rural/urban areas.

Benefits
Cash (~$1,433-$2,642/month veteran, ~$951-$1,318 spouse) for care costs (e.g., in-home, assisted living)

Frequently Asked Questions about Life Care Center of Kansas City

What neighborhood is Life Care Center of Kansas City in?

Life Care Center of Kansas City is in the Bethel Welborn neighborhood of Kansas City.

Who is the owner of Life Care Center of Kansas City?

The legal owner and operator of Life Care Center of Kansas City is Kansas City Medical Investors Llc.

Is Life Care Center of Kansas City in a walkable area?

Life Care Center of Kansas City has a walk score of 34. Somewhat walkable. A few nearby services may be reachable on foot, but most trips require transportation.

What is the license number of Life Care Center of Kansas City?

According to KS state health department records, Life Care Center of Kansas City's license number is 175281.

What is the occupancy rate at Life Care Center of Kansas City?

Life Care Center of Kansas City's occupancy is 70%.

Who is the administrator of Life Care Center of Kansas City?

Matthew Memmer is the administrator of Life Care Center of Kansas City.

How many beds does Life Care Center of Kansas City have?

Life Care Center of Kansas City has 82 beds.

Guides for Better Senior Living

Care Cost Calculator: See Prices in Your Area

Nursing Home Data Explorer

Don’t Wait Too Long: 7 Red Flag Signs Your Parent Needs Assisted Living Now

The True Cost of Assisted Living in 2025 – And How Families Are Paying For It

Understanding Senior Living Costs: Pricing Models, Discounts & Financial Assistance