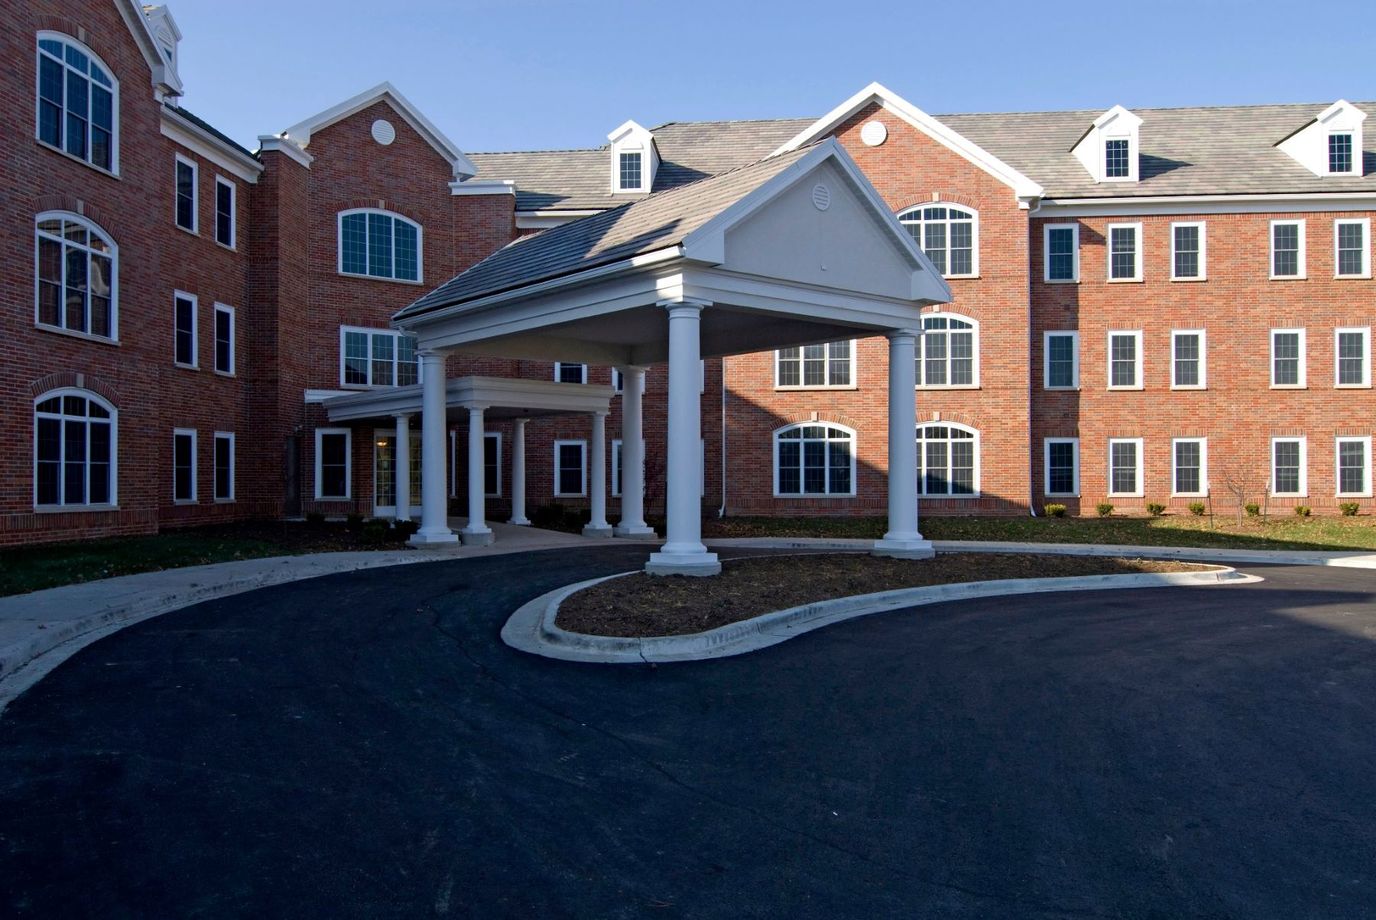
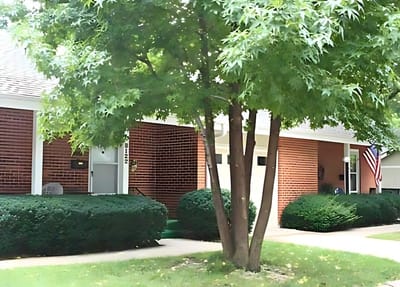
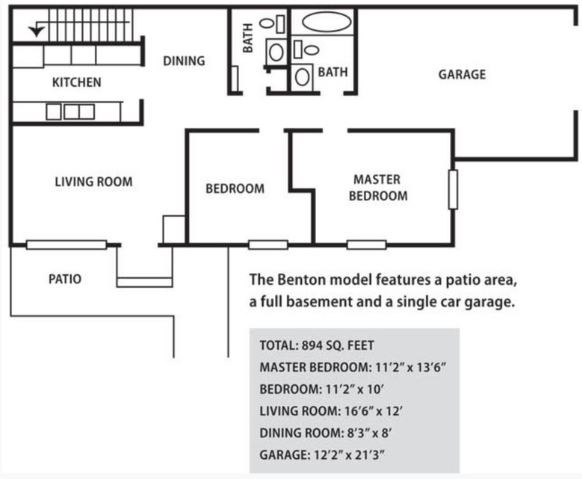
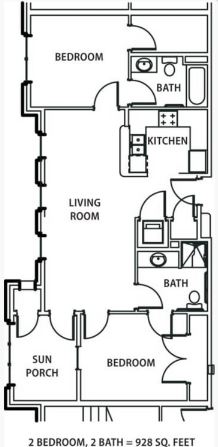
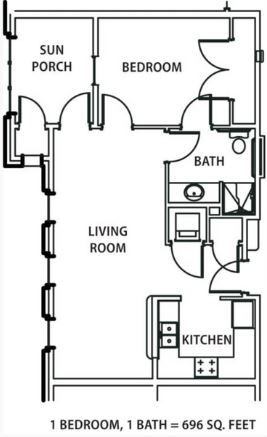
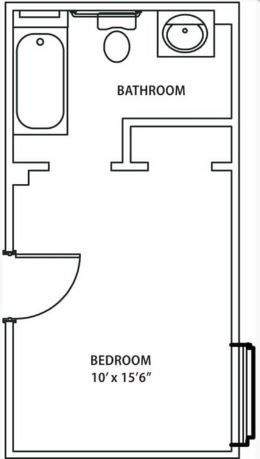
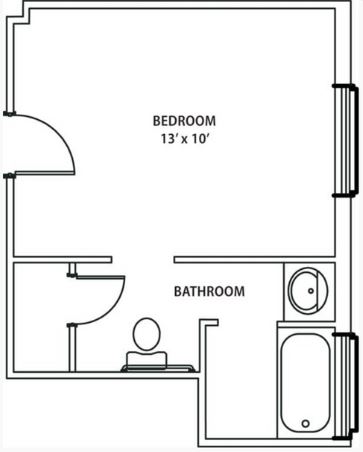
Armour Oaks Senior Living Community
Nursing Home, Assisted Living & Independent Living · Kansas, MO
CMS overall rating Info CMS (the Centers for Medicare & Medicaid Services) is the federal agency that rates nursing home quality. Its Overall Rating runs from 1 to 5 stars, combining health inspections, staffing, and quality measures, with inspections weighted most heavily.

Armour Oaks Senior Living Community

Nursing Home, Assisted Living & Independent Living · Kansas, MO
CMS overall rating Info CMS (the Centers for Medicare & Medicaid Services) is the federal agency that rates nursing home quality. Its Overall Rating runs from 1 to 5 stars, combining health inspections, staffing, and quality measures, with inspections weighted most heavily.
Calculator: See prices in your area
Armour Oaks Senior Living Community accepts Medicare, Medicaid, and private pay.

Overview of Armour Oaks Senior Living Community

At Armour Oaks senior living community, inclusivity is at the heart of their values. They celebrate diversity and welcome individuals of all races, genders, abilities, and religious beliefs. Their commitment to inclusivity extends to every aspect of the home, from staff and residents to policies and practices. They offer services, such as assisted living, independent living, and nursing care. The accommodations are designed to suit different preferences, with one- to two-bedroom apartments and two to three bedroom townhomes for those who desire more space and independence. The home embraces diversity and is Medicaid accepted, ensuring seniors have access to the care they deserve.

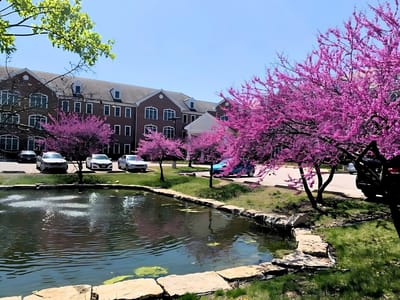
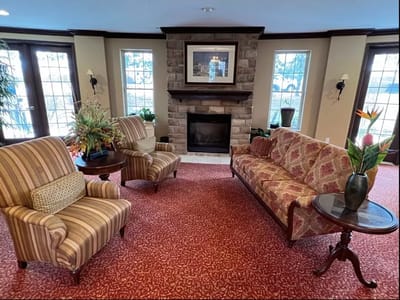
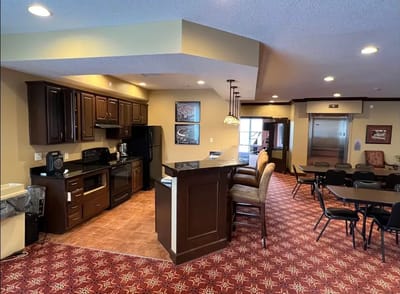
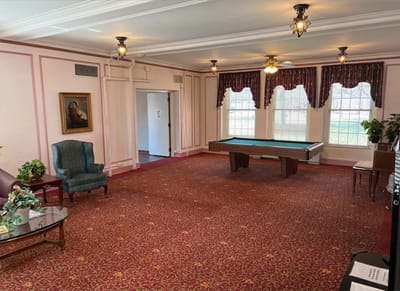
The community lives by an all-inclusive space. They have complete utilities, allowing seniors to focus on spending their day how they like it. Common areas abound, including fitness rooms for staying active, verandas for taking in the beauty of nature, and party rooms for socializing and making cherished memories. In addition to the physical amenities, they also offer chaplain services, providing comfort, guidance, and support to seniors in their sunset years. Indeed, there is nothing better than living in a home that promotes inclusivity and diversity, and celebrates the unique qualities of every individual.

Quality ratings

Measured by Centers for Medicare & Medicaid Services (CMS)

Overall rating Info The Overall CMS Rating combines results from health inspections, staffing levels and quality measures. Health inspections carry the most weight. Staffing and quality scores can increase or decrease the final rating based on performance compared to state and national standards.
▼ 19.5% Below MO avg. ▼ 19.5% Below MO avg.MO average: 2.5Click the badge to see the full State ranking.Click here to see the full State ranking.
Health Inspection Info Based on the results of the facility's three most recent standard inspections and any complaint investigations. CMS reviews the number, scope, and severity of deficiencies, with more recent findings weighted more heavily.
▲ 8.1% Above MO avg. ▲ 8.1% Above MO avg.MO average: 2.8Click the badge to see the full State ranking.Click here to see the full State ranking.
Staffing Info Measures average nursing staff hours per resident per day, including Registered Nurses (RNs) and total nursing staff. Ratings are adjusted based on the level of care residents require and are compared to state and national benchmarks.
▼ 54.3% Below MO avg. ▼ 54.3% Below MO avg.MO average: 2.2Click the badge to see the full State ranking.Click here to see the full State ranking.
Quality Measures Info Based on clinical and physical health indicators reported to CMS, such as hospital readmissions, falls, pressure ulcers, and improvements in mobility. These measures reflect how well residents' health needs are being managed.
▼ 24.7% Below MO avg. ▼ 24.7% Below MO avg.MO average: 2.7Click the badge to see the full State ranking.Click here to see the full State ranking.

Staffing hours breakdown

Info Daily nursing hours per resident by staff type, reported to CMS. Higher is generally better — compare this facility to state and national averages to see where staffing stands.

Hours per resident per day — compared to Missouri state averages

Total nursing care / resident Info This home is ranked 235th out of 282 homes in Missouri for nurse hours. Total adjusted nursing hours per resident per day, combining RN, LPN, and aide time. CMS adjusts this for case-mix so facilities can be fairly compared.
3h 2m per day
Rank #235 / 282Nurse hours — State benchmarkedThis home is ranked 235th out of 282 homes in Missouri. Shows adjusted nurse hours per resident per day benchmarked to the Missouri average, with a ranking across 282 Missouri facilities. More hours mean more direct care. The national average is about 3.5 hrs; below 3.0 is a red flag.Rankings are based only on facilities in Missouri that report data for that category. Facilities without available data are excluded from the ranking.Click the rank badge to see the full State ranking.Click here to see the full State ranking.
This facility Missouri avg (3h 44m per day)
vs Missouri avg
-19%

4 of 6 metrics below state avg

Standout metric LPN / LVN is +7% above state avg
Staff typeHours / Day / Residentvs state avg
Registered Nurse (RN) Info RNs hold the highest nursing license and can assess residents, interpret test results, and direct care plans. More RN hours per day often signals stronger clinical oversight and faster response to health changes. 15m per day ▼ 47% State avg: 28m per day · National avg: 41m per day
LPN / LVN Info Licensed Practical Nurses (LPNs) or Licensed Vocational Nurses (LVNs) deliver routine hands-on care — medication administration, wound dressing, and monitoring vital signs. They work under RN supervision and make up a large share of daily bedside care. 44m per day ▲ 7% State avg: 41m per day · National avg: 52m per day
Nurse Aide Info Certified Nurse Aides (CNAs) provide the most direct day-to-day assistance: bathing, dressing, feeding, and mobility. Nurse aide hours are typically the largest staffing category and directly affect residents' quality of life. 2h 16m per day ■ Avg State avg: 2h 19m per day · National avg: 2h 20m per day
Weekend Total Nursing Info Combined nursing hours (RN + LPN + Nurse Aide) per resident per day on weekends. Staffing often drops on weekends — this figure reveals whether the facility maintains adequate coverage outside of weekday hours. 2h 53m per day ▼ 5% State avg: 3h 3m per day · National avg: 3h 26m per day
Physical Therapist Info Hours per resident per day provided by licensed Physical Therapists (PTs) or PT Assistants. PT services help residents recover mobility after injury or illness and are especially important for post-acute (short-stay) rehabilitation. 0m per day ▼ 100% State avg: 2m per day · National avg: 4m per day
Weekend RN Info Registered nurse hours specifically on weekends. Facilities sometimes reduce RN presence on Saturdays and Sundays — a low weekend RN figure compared to weekday hours can indicate reduced clinical oversight when most administrative staff are absent. 17m per day ▼ 15% State avg: 20m per day · National avg: 28m per day

Capacity and availability

Avg. Length of Stay
372 days
Bed community size
38-bed community Rank #424 / 454Bed count — State benchmarkedThis home is ranked 424th out of 454 homes in Missouri. Shows this facility's certified or reported bed count compared to other Missouri facilities. Larger communities may offer more amenities, programs, and on-site services for residents and families.Rankings are based only on facilities in Missouri that report data for that category. Facilities without available data are excluded from the ranking.Click the rank badge to see the full State ranking.Click here to see the full State ranking.
A moderately sized community that may balance personal attention with shared amenities and social activities.
Years in operation
7 years in operation Rank #85 / 209Years in operation — State benchmarkedThis home is ranked 85th out of 209 homes in Missouri. Shows how long this facility has been in operation compared to other Missouri facilities. Longer operating histories may benefit residents, families, and staff.Rankings are based only on facilities in Missouri that report data for that category. Facilities without available data are excluded from the ranking.Click the rank badge to see the full State ranking.Click here to see the full State ranking.
An established community with some operational experience and growing routines.
Walk Score
Walk Score: 73 / 100 Rank #70 / 563Walk Score — State benchmarkedThis home is ranked 70th out of 563 homes in Missouri. Shows how walkable this facility's neighborhood is compared to the average Walk Score across Missouri facilities. Higher scores benefit residents, families, and staff.Rankings are based only on facilities in Missouri that report data for that category. Facilities without available data are excluded from the ranking.Click the rank badge to see the full State ranking.Click here to see the full State ranking.
Very walkable. Most errands can be accomplished on foot, and many essentials are within a short walk.
BBB Rating
BBB Rating: A+ (Not Accredited)
An independent rating from the Better Business Bureau based on factors such as complaint history, transparency, and business practices.
How BBB ratings work

About this community

Occupancy

Occupancy rate
100%
Rank #1 / 434Occupancy rate — State benchmarkedThis home is ranked 1st out of 434 homes in Missouri. Shows this facility's occupancy rate versus the Missouri average, with its Statewide rank out of 434. Higher occupancy signals strong local demand and financial stability.Rankings are based only on facilities in Missouri that report data for that category. Facilities without available data are excluded from the ranking.Click the rank badge to see the full State ranking.Click here to see the full State ranking.
Higher than the Missouri average: 66.6%
Occupied beds
38 / 38
Average occupied beds in Missouri homes 72 beds

License Details

Facility TypeSnf
CountyJackson

Ownership & Operating Entity

Armour Oaks Senior Living Community is legally operated by Women's Christian Assoc Of Kansas City, Mo, and administered by Isaac Smith.

Corporate EntityWOMEN'S CHRISTIAN ASSOCIATION OF KANSAS CITY, MO

Staffing

Key information about the people who lead and staff this community.

Leadership

ContactCharles Moore, CEO/Owner

Additional Policies & Features

Minimum Age55

Contact Armour Oaks Senior Living Community

Inspection History

In Missouri, the Department of Health and Senior Services, Division of Regulation and Licensure performs the inspections and unannounced surveys required for all long-term care providers.

Since 2018 · 8 years of data 134 deficiencies 18 inspections

Inspection Scorecard Info This scorecard compares key inspection, citation, and complaint metrics at this facility against the Missouri state average. Metrics rated ≥15% worse than average are highlighted in red; those ≥15% better are highlighted in green.

Since 2018 vs. Missouri state average
Overall vs. MO average 4 Worse Metrics worse than Missouri average:
• Total deficiencies (283% above)
• Deficiencies per year (282% above)
• Deficiencies per inspection (48% above)
• Total inspections (157% above)
0 Better No metrics in this bucket.
Latest Inspection May 28, 2025 Complaint Investigation

Deficiencies Info Deficiencies are formal regulatory issues recorded during state inspections.

This FacilityMO Averagevs. MO Avg
Total deficiencies Info Formal regulatory issues recorded by inspectors across all inspection types. 13435 This facility has 283% more total deficiencies than a typical Missouri nursing home (134 vs. MO avg 35).↑ 283% worse
Deficiencies per year Info Average deficiencies per year since 2018. 16.84.4 This facility has 282% more deficiencies per year than a typical Missouri nursing home (16.8 vs. MO avg 4.4).↑ 282% worse
Deficiencies per inspection Info Average deficiencies per inspection. 7.45 This facility has 48% more deficiencies per inspection than a typical Missouri nursing home (7.4 vs. MO avg 5).↑ 48% worse

Inspections Info State inspections evaluate whether the facility meets health and safety standards.

This FacilityMO Averagevs. MO Avg
Total inspections Info Combined count of all routine and focused inspections. Excludes complaint investigations. 187 This facility has 157% more total inspections than a typical Missouri nursing home (18 vs. MO avg 7).↑ 157% worse

Inspection Reports Summary Info An editor-reviewed summary of the themes and findings across this facility's recent inspection reports.

  • May 28, 2025 complaint investigation found misappropriation of controlled substances by an RN signing out duplicate narcotic doses without proper documentation, leading to suspension and termination of the nurse.
  • April 17, 2025 routine inspection found two deficiencies related to inconsistent hot water temperatures in resident rooms and improper water temperature measurement procedures.
  • January 16, 2024 complaint investigation revealed 11 deficiencies including delayed abuse reporting, inaccurate MDS submissions, medication errors, inadequate supervision, food safety, and infection control program failures.

Health Inspection History

Inspections since 2019
Total health inspections 6

Missouri average 6.6


Last Health inspection on Apr 2025

Total health citations
39 Rank #186 / 287Health citations — State benchmarkedThis home is ranked 186th out of 287 homes in Missouri. Shows this facility's total health deficiency citations benchmarked to the Missouri State average, with a ranking across all 287 MO facilities. Lower citation counts earn a better rank.Rankings are based only on facilities in Missouri that report data for that category. Facilities without available data are excluded from the ranking.Click the rank badge to see the full State ranking.Click here to see the full State ranking.

Missouri average 36.5

Citations per inspection
6.5 Rank #202 / 287Citations per inspection — State benchmarkedThis home is ranked 202nd out of 287 homes in Missouri. Shows average deficiency citations per CMS inspection for this facility versus the Missouri mean across 287 facilities with citation data. Lower is better.Rankings are based only on facilities in Missouri that report data for that category. Facilities without available data are excluded from the ranking.Click the rank badge to see the full State ranking.Click here to see the full State ranking.

Missouri average 5.67


Health citations are formal notices following inspections when they fail to comply with safety and care standards.

34 of 39 citations resulted from standard inspections; 3 of 39 resulted from complaint investigations; and 2 of 39 came from combined inspections (standard and complaint).

Breakdown of citation severity (last 7 years)
Critical health citations
0
100% better than Missouri average

Missouri average: 0.7


Serious health citations
0
100% better than Missouri average

Missouri average: 1

0 critical citations Missouri average: 0.7

0 serious citations Missouri average: 1

39 moderate citations Missouri average: 33.6

0 minor citations Missouri average: 1.2
Citations history (last 7 years)
Environmental moderate citation Apr 17, 2025
Corrected

Abuse/Neglect moderate citation Jan 16, 2024
Corrected

Infection Control moderate citation Jan 16, 2024
Corrected

Nutrition moderate citation Jan 16, 2024
Corrected

Staffing Data

Reporting period: October 1 – December 31, 2025 (Q4 2025). Source: CMS Payroll-Based Journal report.

Total staff 54
Employees 51
Contractors 3
Staff to resident ratio 1.59 : 1
6% fewer staff per resident than Missouri average
Missouri average ratio: 1.69 : 1 Missouri average ratio: 1.69 : 1See full Missouri ranking
Avg staff/day 17
Average shift 7.5 hours
7% worse than Missouri average
Missouri average: 8.1 hours Missouri average shift: 8.1 hoursSee full Missouri ranking
Total staff hours (quarter) 11,682

Nursing staff breakdown

Q4 2025 · Oct 1 – Dec 31 More info This data comes from the CMS Payroll-Based Journal report covering October 1 – December 31, 2025.
Registered Nurse

Manages medical care and health needs.

RN Staff Info All 3 RN Staff are full-time employees. No contractors work on this role. 3
Average shift length Info Average shift length. Calculated as total hours divided by days worked and average staff per day. 6.8 hours
Licensed Practical Nurse

Assists with medical care and medications.

LPN Staff Info 10 total: 9 full-time employees and 1 contractor. 10
Average shift length Info Average shift length. Calculated as total hours divided by days worked and average staff per day. 6.1 hours
Certified Nursing Assistant

Helps with daily care and mobility.

CNA Staff Info 29 total: 28 full-time employees and 1 contractor. 29
Average shift length Info Average shift length. Calculated as total hours divided by days worked and average staff per day. 7.9 hours

Contractor staffing

Q4 2025 · Oct 1 – Dec 31 More info This data comes from the CMS Payroll-Based Journal report covering October 1 – December 31, 2025.

Total hours from contractors

0.8%

92 contractor hours this quarter

Certified Nursing Assistant: 1 Licensed Practical Nurse: 1 Medical Director: 1

Staff by category

Q4 2025 · Oct 1 – Dec 31 More info This data comes from the CMS Payroll-Based Journal report covering October 1 – December 31, 2025.
Certified Nursing Assistant281296,58692100%7.9
Licensed Practical Nurse91101,85092100%6.1
Medication Aide/Technician60687092100%5.8
RN Director of Nursing2025505459%8.1
Administrator1015286672%8
Nurse Practitioner1015286672%8
Other Dietary Services Staff1014265661%7.6
Registered Nurse3032864043%6.8
Medical Director011592628%2.3
29 Certified Nursing Assistant
% of Days 100%
10 Licensed Practical Nurse
% of Days 100%
6 Medication Aide/Technician
% of Days 100%
2 RN Director of Nursing
% of Days 59%
1 Administrator
% of Days 72%
1 Nurse Practitioner
% of Days 72%
1 Other Dietary Services Staff
% of Days 61%
3 Registered Nurse
% of Days 43%
1 Medical Director
% of Days 28%

Penalties and fines

Federal penalties imposed by CMS for regulatory violations, including civil money penalties (fines) and denials of payment for new Medicare/Medicaid admissions.

Source: CMS Penalties Database

No penalties in the past 3 years

No civil money penalties or payment denials were reported in the last 3 years.

Quality of care over time

These measures show how residents usually do over time at this home, based on health outcomes and preventive care.

High-risk clinical events score Info A composite score based on pressure ulcers, falls with injury, weight loss, walking ability decline, and activities of daily living decline. 7.6
31% better than Missouri average

Missouri average: 10.9

Functional decline score Info A composite score based on activities of daily living decline, walking ability decline, and incontinence. 9.6
51% better than Missouri average

Missouri average: 19.5

Long-stay resident measures
Above average Missouri avg: 2.7 Info CMS star rating based on long-stay quality measure performance. 5 stars = significantly above average, 1 star = significantly below average.
Need for Help with Daily Activities Increased Info Percent of long-stay residents whose need for help with daily activities has increased 15.1%
24% better than Missouri average

Missouri average: 19.8%

Walking Ability Worsened Info Percent of long-stay residents whose ability to move independently worsened 7.7%
63% better than Missouri average

Missouri average: 20.6%

Low Risk Residents with Bowel/Bladder Incontinence Info Percent of low risk long-stay residents who lose control of their bowels or bladder 6.0%
67% better than Missouri average

Missouri average: 18.1%

Falls with Major Injury Info Percent of long-stay residents experiencing one or more falls with major injury 2.5%
39% better than Missouri average

Missouri average: 4.0%

High Risk Residents with Pressure Ulcers Info Percent of long-stay high risk residents with pressure ulcers 5.4%
8% worse than Missouri average

Missouri average: 5.0%

Urinary Tract Infection Info Percent of long-stay residents with a urinary tract infection 13.3%
389% worse than Missouri average

Missouri average: 2.7%

Lost Too Much Weight Info Percent of long-stay residents who lose too much weight 7.1%
28% worse than Missouri average

Missouri average: 5.6%

Depressive Symptoms Info Percent of long-stay residents who have depressive symptoms 7.1%
44% better than Missouri average

Missouri average: 12.8%

Antipsychotic Use Info Percent of long-stay residents who received an antipsychotic medication 6.6%
70% better than Missouri average

Missouri average: 22.0%

Pneumococcal Vaccine Info Percent of long-stay residents assessed and appropriately given the pneumococcal vaccine 86.1%
In line with Missouri average

Missouri average: 85.2%

Influenza Vaccine Info Percent of long-stay residents assessed and appropriately given the seasonal influenza vaccine 81.8%
10% worse than Missouri average

Missouri average: 90.9%

Breakdown by payment type

Medicare

33% of new residents, usually for short-term rehab.

Typical stay 26 days

Private pay

44% of new residents, often for short stays.

Typical stay 8 - 9 months

Medicaid

23% of new residents, often for long-term daily care.

Typical stay 2 years

Facility Characteristics

Source: CMS Long-Term Care Facility Characteristics (Data as of Jan 2026)

Total residents 34
Medicare
1
2.9% of residents
Medicaid
22
64.7% of residents
Private pay or other
11
32.4% of residents
Programs & Services
Residents Group

Residents meet regularly to discuss policies, care quality, and activities

Active Resident Council

Organized group of residents that meets regularly to discuss facility policies, quality of life, and activities.

Finances and operations

Based on CMS SNF Cost Report for fiscal year ending in 12/2023.

Governmental community
Operated by a subsidized facility district.
Net patient revenue Info Net patient revenue — what the home actually collects for resident care, after contractual allowances, bad debt and discounts are subtracted from its gross charges (CMS cost report, Worksheet G-3). It covers resident care only; money the home earns from other sources is shown separately as "Other income."
$2.9M
Net patient income Info Net patient income: net patient revenue minus the home's total operating expenses. A positive figure means it earns more from resident care than it spends to deliver it; a negative figure means the opposite. It excludes non-operating "other income."
-$478.1K
Governmental community Operated by a subsidized facility district.
Net patient revenue Info Net patient revenue — what the home actually collects for resident care, after contractual allowances, bad debt and discounts are subtracted from its gross charges (CMS cost report, Worksheet G-3). It covers resident care only; money the home earns from other sources is shown separately as "Other income."
$2.9M Rank #271 / 292Revenue — State benchmarkedThis home is ranked 271st out of 292 homes in Missouri. Shows this facility's annual revenue compared to the Missouri average. Higher revenue generally means more resources for staffing and capital — read alongside Payroll %.Rankings are based only on facilities in Missouri that report data for that category. Facilities without available data are excluded from the ranking.Click the rank badge to see the full State ranking.Click here to see the full State ranking.
Net patient income Info Net patient income: net patient revenue minus the home's total operating expenses. A positive figure means it earns more from resident care than it spends to deliver it; a negative figure means the opposite. It excludes non-operating "other income."
-$478.1K
Payroll costs Info Staff salaries plus wage-related costs — benefits such as payroll taxes, health insurance and retirement — from the home's own accounting records (CMS cost report, Worksheet A). Contract or agency labor is counted separately, under other operating costs. Rank #227 / 292Payroll — State benchmarkedThis home is ranked 227th out of 292 homes in Missouri. Shows total annual staff payroll benchmarked to the Missouri average. Higher payroll investment relative to peers often signals better staffing and less reliance on cheaper contract labor.Rankings are based only on facilities in Missouri that report data for that category. Facilities without available data are excluded from the ranking.Click the rank badge to see the full State ranking.Click here to see the full State ranking.
$2.2M 75.8% of net patient revenue Info Payroll as a share of revenue: staff salaries and wage-related benefits divided by net patient revenue. A higher figure means more of each revenue dollar goes to staff pay. Rank #13 / 292Payroll % — State benchmarkedThis home is ranked 13th out of 292 homes in Missouri. Shows payroll as a percentage of revenue versus the Missouri average. Well-run Missouri facilities typically land around 60–71% — the top third Statewide. Below 25% may signal understaffing or heavy agency use — read with Staffing ratings.Rankings are based only on facilities in Missouri that report data for that category. Facilities without available data are excluded from the ranking.Click the rank badge to see the full State ranking.Click here to see the full State ranking.
Other operating costs Info Everything it costs to run the home apart from payroll — food, utilities, supplies, maintenance, contract labor and administration. Calculated as total operating expense minus payroll (staff salaries and wage-related benefits).
$1.2M
Total costs Info The home's total operating expense for the year — all the costs of running it, salaries included (CMS cost report, Worksheet G-3).
$3.4M

What does this home offer?

Pets allowed icon
Pets allowed icon

Pets Allowed

Housing options icon

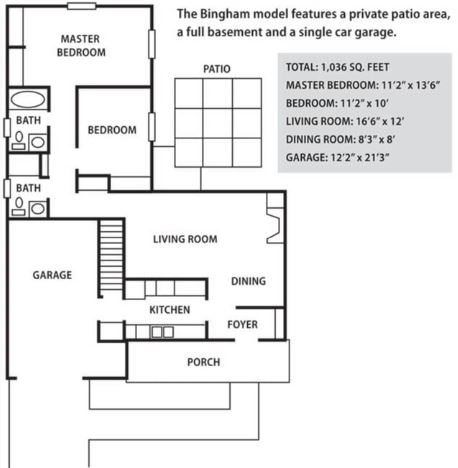
Housing Options: Studio / 1 Bed / 2 Bed / 3 Bed

Transportation services icon

Transportation Services

Fitness and recreation icon

Fitness and Recreation

Who this home usually serves

TYPE OF STAY

Mix of rehab and long-term care

This home supports both short-term rehab and long-term care, with residents staying for a wide range of durations.

New residents most often arrive under private pay (44% of admissions), and a typical private pay stay runs around 8 - 9 months.

Admissions
43 total

Coverage residents most often arrive under.

Medicare 33%
Private pay 44%
Medicaid 23%
Discharges
35 total

Coverage residents most often leave under.

Medicare 20%
Private pay 66%
Medicaid 14%

Living Spaces & Floor Plans for Armour Oaks Senior Living Community

Armour Oaks Senior Living Community 2 Bed C
Armour Oaks Senior Living Community 2 Bed B
Armour Oaks Senior Living Community 2 Bed
Armour Oaks Senior Living Community 1 Bed
Armour Oaks Senior Living Community 1 Bed B
Armour Oaks Senior Living Community Studio

Places of interest near Armour Oaks Senior Living Community

Address 11.7 miles from city center Info Estimated distance in miles from Kansas City's city center to Armour Oaks Senior Living Community's address, calculated via Google Maps. — 2.75 miles to nearest hospital (Research Medical Center)

Calculate Travel Distance to Armour Oaks Senior Living Community

Add your location

Address

Compare Nursing Homes around Kansas

The information below is reported by the Missouri Department of Health and Senior Services, Division of Regulation and Licensure.

5 facilities compared · CMS & MO Dept. of Health data

Kingswood Senior Living Community
NH
AL
IL
MC
Kansas City (South Kansas City)
86
Facility 86
MO AVG 97
Rank #253 / 454
64.0%
Facility 64.0%
MO AVG 66.6%
Rank #244 / 434
-4%
4.21
Facility 4.21
MO AVG 3.74
Rank #78 / 282
+22%+13%
$0
Facility $0
MO AVG $76.9k
Rank #1 / 289
14
Facility 14
MO AVG 36.5
Rank #41 / 287
3.5
Facility 3.5
MO AVG 5.7
Rank #58 / 287
-47-
42
Facility 42
MO AVG 45
Rank #315 / 563
Jeffrey Basler
$4.4M
Facility $4.4M
MO AVG $8.4M
Rank #173 / 292
$1.9M
Facility $1.9M
MO AVG $3.3M
Rank #263 / 292
42.7%
Facility 42.7%
MO AVG 45.6%
Rank #280 / 292
265876
Linden Woods Village
NH
AL
IL
Gladstone
40
Facility 40
MO AVG 97
Rank #419 / 454
85.0%
Facility 85.0%
MO AVG 66.6%
Rank #79 / 434
+28%
4.51
Facility 4.51
MO AVG 3.74
Rank #48 / 282
+31%+21%
$0
Facility $0
MO AVG $76.9k
Rank #1 / 289
12
Facility 12
MO AVG 36.5
Rank #30 / 287
4.0
Facility 4.0
MO AVG 5.7
Rank #77 / 287
-38-
53
Facility 53
MO AVG 45
Rank #217 / 563
Amanda Fizer
$8.5M
Facility $8.5M
MO AVG $8.4M
Rank #73 / 292
$3.8M
Facility $3.8M
MO AVG $3.3M
Rank #98 / 292
44.8%
Facility 44.8%
MO AVG 45.6%
Rank #225 / 292
265855
Carnegie Village
NH
AL
Belton (107)
85
Facility 85
MO AVG 97
Rank #257 / 454
78.8%
Facility 78.8%
MO AVG 66.6%
Rank #125 / 434
+18%
3.46
Facility 3.46
MO AVG 3.74
Rank #171 / 282
0%-7%
$15.6k
Facility $15.6k
MO AVG $76.9k
Rank #195 / 289
44
Facility 44
MO AVG 36.5
Rank #204 / 287
6.3
Facility 6.3
MO AVG 5.7
Rank #196 / 287
170-
55
Facility 55
MO AVG 45
Rank #189 / 563
Carnegie Village Senior Living Community LLC
$10.6M
Facility $10.6M
MO AVG $8.4M
Rank #43 / 292
$4.1M
Facility $4.1M
MO AVG $3.3M
Rank #57 / 292
38.7%
Facility 38.7%
MO AVG 45.6%
Rank #243 / 292
265861
Armour Oaks Senior Living Community
NH
AL
IL
Kansas City (Waldo Homes)
38
Facility 38
MO AVG 97
Rank #424 / 454
100.0%
Facility 100.0%
MO AVG 66.6%
Rank #1 / 434
+50%
3.03
Facility 3.03
MO AVG 3.74
Rank #235 / 282
-27%-19%
$0
Facility $0
MO AVG $76.9k
Rank #1 / 289
39
Facility 39
MO AVG 36.5
Rank #186 / 287
6.5
Facility 6.5
MO AVG 5.7
Rank #202 / 287
-100A+
73
Facility 73
MO AVG 45
Rank #70 / 563
Womens Christian Association Of Kansas City Missouri
$2.9M
Facility $2.9M
MO AVG $8.4M
Rank #271 / 292
$2.2M
Facility $2.2M
MO AVG $3.3M
Rank #227 / 292
75.8%
Facility 75.8%
MO AVG 45.6%
Rank #13 / 292
265802
The Hilltop at Blue River
NH
PC
Kansas City (South Kansas City)
160
Facility 160
MO AVG 97
Rank #42 / 454
89.4%
Facility 89.4%
MO AVG 66.6%
Rank #46 / 434
+34%
2.63
Facility 2.63
MO AVG 3.74
Rank #258 / 282
-14%-30%
$34.7k
Facility $34.7k
MO AVG $76.9k
Rank #219 / 289
50
Facility 50
MO AVG 36.5
Rank #225 / 287
5.6
Facility 5.6
MO AVG 5.7
Rank #167 / 287
2145A+
4
Facility 4
MO AVG 45
Rank #530 / 563
10425 Opco LLC
$14.4M
Facility $14.4M
MO AVG $8.4M
Rank #37 / 292
$6.3M
Facility $6.3M
MO AVG $3.3M
Rank #40 / 292
44.1%
Facility 44.1%
MO AVG 45.6%
Rank #219 / 292
265597

Financial Assistance for
Nursing Home in Missouri

Armour Oaks Senior Living Community is located in Kansas City, Missouri.
Here are the financial assistance programs available to residents in Missouri.

Get Financial aid guidance

Aged and Disabled Waiver

Missouri Medicaid A&D Waiver

Age 65+ or disabled
General Missouri resident, Medicaid- eligible, nursing home-level care need.
Income Limits (2025) ~$2,829/month 300% FBR, individual
Asset Limits $2,000 (individual), $3,000 (couple).
MO

Rural access prioritized.

Benefits
Personal care (5-7 hours/day) Respite (240 hours/year) Adult day care (~$65/day) Home health services

Missouri Supplemental Nursing Care (SNC)

MO SNC

Age 65+
General Missouri resident, in approved facility.
Income Limits ~$1,215/month individual
Asset Limits $2,000 individual
MO

Supplements SSI; facility-based only.

Benefits
Monthly cash payment (~$156-$292/month) for care costs

Structured Family Caregiving Waiver (SFCW)

Missouri Structured Family Caregiving Waiver

Age 65+
General Missouri resident, MO HealthNet-eligible, NFLOC, dementia diagnosis, live with caregiver.
Income Limits (2025) ~$2,901/month (300% FBR, individual); QIT required.
Asset Limits $5,909.25 (individual), $11,818.45 (couple).
MO

Caregiver must be family; small program size.

Benefits
Cash stipend ($1,000-$1,500/month) to family caregiver Respite Training Supplies ($500/year)

MO HealthNet Aged, Blind, and Disabled (ABD)

Missouri MO HealthNet ABD

Age 65+ or disabled
General Missouri resident, MO HealthNet-eligible, needs help with 1+ ADL.
Income Limits (2025) ~$1,690/month (individual, projected); spenddown allowed.
Asset Limits $5,909.25 (individual), $11,818.45 (couple).
MO

Less intensive than waivers; statewide access.

Benefits
Personal care (2-4 hours/day) Homemaker services Limited respite Medical equipment

Medicare Savings Program (MSP)

Missouri Medicare Savings Program

Age 65+ or disabled
General Missouri resident, Medicare Part A/B.
Income Limits (2025) ~$2,510/month (QMB), ~$3,380/month (SLMB), ~$3,598/month (QI)—individual.
Asset Limits $9,430 (individual), $14,130 (couple).
MO

Three tiers; no waitlist; includes Extra Help for Part D.

Benefits
Covers Part B premiums ($174.70/month) Deductibles ($240/year) Copays (~20%)

Missouri Caregiver Program (Customized Caregiver Training & Relief)

Missouri Caregiver Program

Age
General Caregivers of 60+ with dementia, Missouri resident, functional needs (2+ ADLs).
Income Limits (2025) No strict cap; prioritizes low-income ~$24,980/year individual
Asset Limits Not assessed; need-based.
MO

Administered via AAAs and Alzheimer’s Association; rural focus.

Benefits
Respite (4-6 hours/week) Training Assistive tech ($500/year) Supplies

VA Aid and Attendance (A&A) and Housebound Benefits

Missouri VA Aid and Attendance/Housebound

Age 65+ or disabled veteran/spouse
General Missouri resident, wartime service, need for ADL help (A&A) or homebound.
Income Limits (2025) Net income < ~$1,984/month (veteran with dependent, A&A); pension offsets income.
Asset Limits ~$155,356 net worth limit
MO

High veteran demand in rural/urban areas.

Benefits
Cash (~$1,433-$2,642/month veteran, ~$951-$1,318 spouse) for care costs (e.g., in-home, assisted living)

Frequently Asked Questions about Armour Oaks Senior Living Community

What neighborhood is Armour Oaks Senior Living Community in?

Armour Oaks Senior Living Community is in the Waldo Homes neighborhood of Kansas City.

Who is the owner of Armour Oaks Senior Living Community?

The legal owner and operator of Armour Oaks Senior Living Community is Women's Christian Assoc Of Kansas City, Mo.

Is Armour Oaks Senior Living Community in a walkable area?

Armour Oaks Senior Living Community has a walk score of 73. Very walkable. Most errands can be accomplished on foot, and many essentials are within a short walk.

What is the occupancy rate at Armour Oaks Senior Living Community?

Armour Oaks Senior Living Community's occupancy is 100%.

Who is the administrator of Armour Oaks Senior Living Community?

Isaac Smith is the administrator of Armour Oaks Senior Living Community.

How many beds does Armour Oaks Senior Living Community have?

Armour Oaks Senior Living Community has 38 beds.

Are there photos of Armour Oaks Senior Living Community?

Yes — there are 12 photos of Armour Oaks Senior Living Community in the photo gallery on this page.

Guides for Better Senior Living

Care Cost Calculator: See Prices in Your Area

Nursing Home Data Explorer

Don’t Wait Too Long: 7 Red Flag Signs Your Parent Needs Assisted Living Now

The True Cost of Assisted Living in 2025 – And How Families Are Paying For It

Understanding Senior Living Costs: Pricing Models, Discounts & Financial Assistance