Gassville Therapy and Living
Nursing Home, Memory Care & Respite Care · Gassville, AR
CMS overall rating Info CMS (the Centers for Medicare & Medicaid Services) is the federal agency that rates nursing home quality. Its Overall Rating runs from 1 to 5 stars, combining health inspections, staffing, and quality measures, with inspections weighted most heavily.

Gassville Therapy and Living

Nursing Home, Memory Care & Respite Care · Gassville, AR
CMS overall rating Info CMS (the Centers for Medicare & Medicaid Services) is the federal agency that rates nursing home quality. Its Overall Rating runs from 1 to 5 stars, combining health inspections, staffing, and quality measures, with inspections weighted most heavily.
Calculator: See prices in your area
Gassville Therapy and Living accepts Medicare, Medicaid, and private pay.

Overview of Gassville Therapy and Living

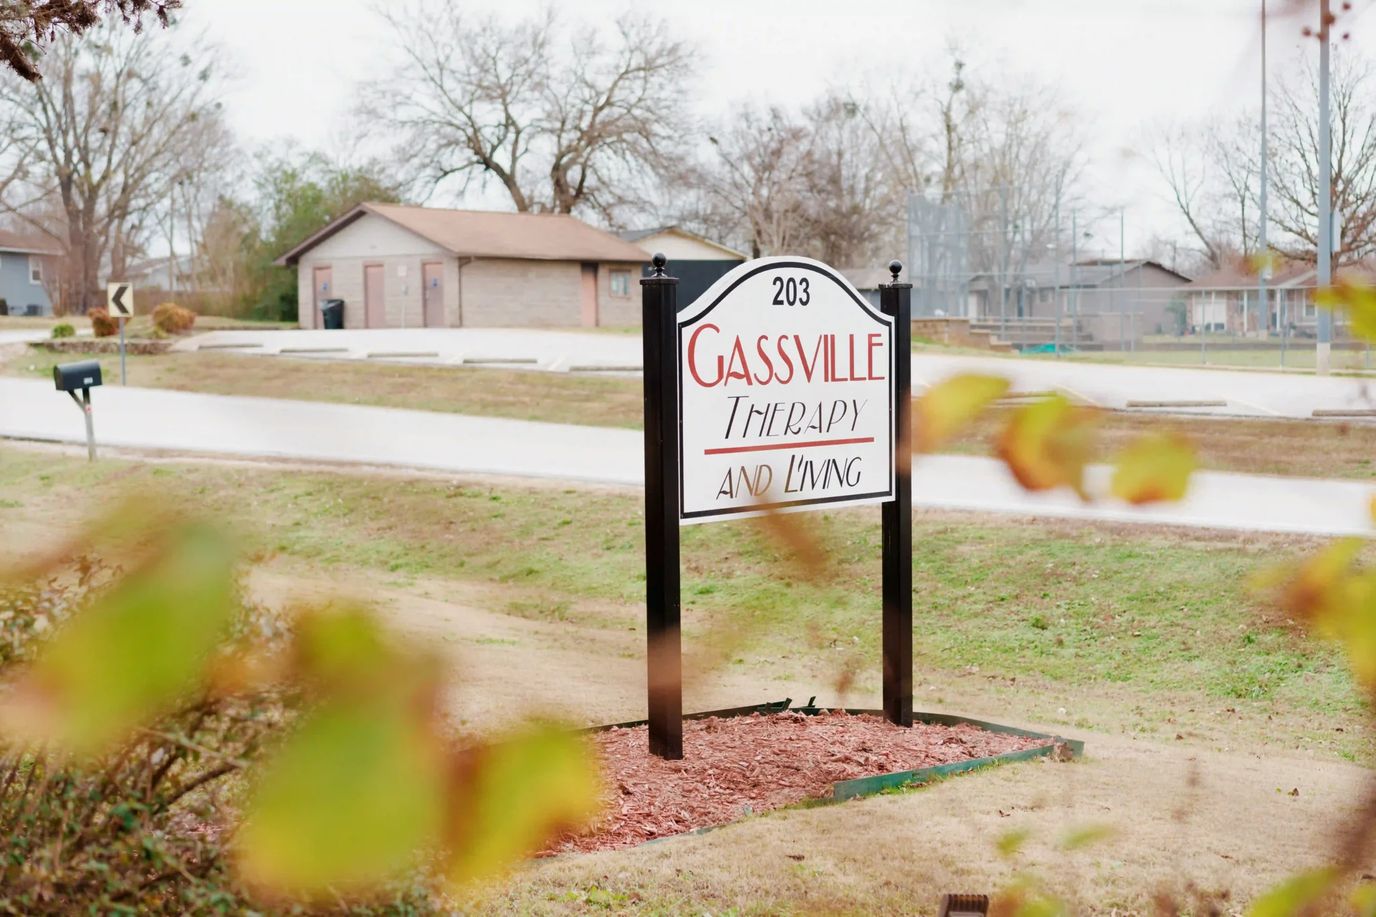
Randy Mcchristian owns Gassville Therapy and Living, a 105-bed care community at 203 Cotter Road in Gassville, Arkansas. Stays at this facility average about 159 days, a timeframe that shows the daily workflow balances short-term post-hospital therapy with permanent residential placements.

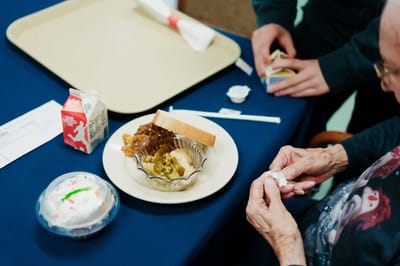
The building relies on 24-hour nursing supervision, with the team logging an average of 4 hours and 24 minutes of direct, hands-on care per resident daily. This crew of registered nurses, practical nurses, and aides handles everyday clinical needs and physical recovery inside an on-site therapy gym. Everyday amenities include a grooming salon, common activity spaces, an outdoor courtyard with a gazebo, and a dining program run by a certified dietary manager serving Southern comfort foods and lighter meals. The property has a 29 walk score, meaning visiting family members will need a car to get around the neighborhood.

State health department surveys for this property have previously noted compliance issues regarding medication and chemical security, food safety management, care documentation, and resident-centered practices. You can go over these specific files with the management team to see exactly how they have handled corrective measures and how they monitor their daily quality control.

Prospective residents can call the admissions coordinator to check on current room layouts or to walk through the general intake steps.

Quality ratings

Measured by Centers for Medicare & Medicaid Services (CMS)

Overall rating Info The Overall CMS Rating combines results from health inspections, staffing levels and quality measures. Health inspections carry the most weight. Staffing and quality scores can increase or decrease the final rating based on performance compared to state and national standards.
Health Inspection Info Based on the results of the facility's three most recent standard inspections and any complaint investigations. CMS reviews the number, scope, and severity of deficiencies, with more recent findings weighted more heavily.
Staffing Info Measures average nursing staff hours per resident per day, including Registered Nurses (RNs) and total nursing staff. Ratings are adjusted based on the level of care residents require and are compared to state and national benchmarks.
Quality Measures Info Based on clinical and physical health indicators reported to CMS, such as hospital readmissions, falls, pressure ulcers, and improvements in mobility. These measures reflect how well residents' health needs are being managed.

Staffing hours breakdown

Info Daily nursing hours per resident by staff type, reported to CMS. Higher is generally better — compare this facility to state and national averages to see where staffing stands.

Hours per resident per day — compared to state averages

Total nursing care / resident Info Total adjusted nursing hours per resident per day, combining RN, LPN, and aide time. CMS adjusts this for case-mix so facilities can be fairly compared.
4h 24m per day
vs avg

3 of 6 metrics below state avg

Standout metric Weekend RN is +125% above state avg
Staff typeHours / Day / Residentvs state avg
Registered Nurse (RN) Info RNs hold the highest nursing license and can assess residents, interpret test results, and direct care plans. More RN hours per day often signals stronger clinical oversight and faster response to health changes. 48m per day ▲ 102% State avg: 24m per day · National avg: 41m per day
LPN / LVN Info Licensed Practical Nurses (LPNs) or Licensed Vocational Nurses (LVNs) deliver routine hands-on care — medication administration, wound dressing, and monitoring vital signs. They work under RN supervision and make up a large share of daily bedside care. 38m per day ▼ 34% State avg: 57m per day · National avg: 52m per day
Nurse Aide Info Certified Nurse Aides (CNAs) provide the most direct day-to-day assistance: bathing, dressing, feeding, and mobility. Nurse aide hours are typically the largest staffing category and directly affect residents' quality of life. 2h 28m per day ▼ 9% State avg: 2h 43m per day · National avg: 2h 20m per day
Weekend Total Nursing Info Combined nursing hours (RN + LPN + Nurse Aide) per resident per day on weekends. Staffing often drops on weekends — this figure reveals whether the facility maintains adequate coverage outside of weekday hours. 3h 30m per day ■ Avg State avg: 3h 29m per day · National avg: 3h 26m per day
Physical Therapist Info Hours per resident per day provided by licensed Physical Therapists (PTs) or PT Assistants. PT services help residents recover mobility after injury or illness and are especially important for post-acute (short-stay) rehabilitation. 0m per day ▼ 88% State avg: 2m per day · National avg: 4m per day
Weekend RN Info Registered nurse hours specifically on weekends. Facilities sometimes reduce RN presence on Saturdays and Sundays — a low weekend RN figure compared to weekday hours can indicate reduced clinical oversight when most administrative staff are absent. 36m per day ▲ 125% State avg: 16m per day · National avg: 28m per day

Capacity and availability

Avg. Length of Stay
159 days
Bed community size
105-bed community Rank #108 / 330Bed count — State benchmarkedThis home is ranked 108th out of 330 homes in Arkansas. Shows this facility's certified or reported bed count compared to other Arkansas facilities. Larger communities may offer more amenities, programs, and on-site services for residents and families.Rankings are based only on facilities in Arkansas that report data for that category. Facilities without available data are excluded from the ranking.Click the rank badge to see the full State ranking.Click here to see the full State ranking.
A larger shared setting that may offer more common spaces and organized community services.
Walk Score
Walk Score: 29 / 100 Rank #240 / 419Walk Score — State benchmarkedThis home is ranked 240th out of 419 homes in Arkansas. Shows how walkable this facility's neighborhood is compared to the average Walk Score across Arkansas facilities. Higher scores benefit residents, families, and staff.Rankings are based only on facilities in Arkansas that report data for that category. Facilities without available data are excluded from the ranking.Click the rank badge to see the full State ranking.Click here to see the full State ranking.
Somewhat walkable. A few nearby services may be reachable on foot, but most trips require transportation.

About this community

License Details

Facility TypeSkilled Nursing Facility With Dual Certified Beds (medicaid/medicare)
CountyBaxter
CMS Certification Number045218
Certification TypeMedicaid / Medicare

Ownership & Operating Entity

Gassville Therapy and Living is administered by William Bonham.

Owner NameGvnc, Inc
Profit StatusFor-profit

Therapy & Rehabilitation

2 services
Rehabilitation Services
Respite Care

Staffing & Medical

1 service
24-Hour Staffing

Contact Information

Fax870-435-2598

Amenities & Lifestyle

Communal Dining Space
Dedicated Activity Area
Therapy Gym
Outdoor Courtyard With Gazebo
Salon Services
Engaging Social Activities
Activities
Specific ProgramsShort-Term Rehab, Additional Services

Contact Gassville Therapy and Living

Inspection History

In Arkansas, the Department of Human Services, Office of Long Term Care is authorized to conduct unannounced inspections and issue official quality of care reports for all senior living providers.

Since 2023 · 3 years of data 28 deficiencies

Inspection Scorecard Info This scorecard compares key inspection, deficiency, and complaint metrics at this facility against the Arkansas state average. Metrics rated ≥15% worse than average are highlighted in red; those ≥15% better are highlighted in green.

Since 2023 vs. Arkansas state average
Overall vs. AR average 2 Worse Metrics worse than Arkansas average:
• Total deficiencies (33% above)
• Deficiencies per year (33% above)
0 Better No metrics in this bucket.
Latest Inspection December 18, 2025 Annual Inspection

Deficiencies Info Deficiencies are formal regulatory issues recorded during state inspections.

This FacilityAR Averagevs. AR Avg
Total deficiencies Info Formal regulatory issues recorded by inspectors across all inspection types. 2821 This facility has 33% more total deficiencies than a typical Arkansas assisted living residence (28 vs. AR avg 21).↑ 33% worse
Deficiencies per year Info Average deficiencies per year since 2023. 9.37 This facility has 33% more deficiencies per year than a typical Arkansas assisted living residence (9.3 vs. AR avg 7).↑ 33% worse

Inspection Reports Summary Info An editor-reviewed summary of the themes and findings across this facility's recent inspection reports.

  • December 18, 2025 annual inspection found no health deficiencies and no complaints.
  • July 11, 2024 complaint investigation revealed six deficiencies including unlocked medication carts, unsecured chemical storage, inadequate grievance investigations, and food safety violations.
  • Multiple prior inspections from 2023 to 2024 showed recurring issues with care plan revisions, food safety, resident dignity, and staff hygiene.

Health Inspection History

Inspections since 2022
Total health inspections 7

State average N/A


Last Health inspection on Nov 2024

Total health citations
31

State average N/A

Citations per inspection
4.43

State average N/A


Health citations are formal notices following inspections when they fail to comply with safety and care standards.

21 of 31 citations resulted from standard inspections; 8 of 31 resulted from complaint investigations; and 2 of 31 came from combined inspections (standard and complaint).

Breakdown of citation severity (last 4 years)
Critical health citations
0
In line with State average

State average: N/A


Serious health citations
0
In line with State average

State average: N/A

0 critical citations State average: N/A

0 serious citations State average: N/A

31 moderate citations State average: N/A

0 minor citations State average: N/A
Citations history (last 4 years)
Environmental moderate citation Nov 19, 2024
Corrected

Resident Rights moderate citation Nov 19, 2024
Corrected

Nutrition moderate citation Jul 11, 2024
Corrected

Nutrition moderate citation Jul 11, 2024
Corrected

Staffing Data

Reporting period: October 1 – December 31, 2025 (Q4 2025). Source: CMS Payroll-Based Journal report.

Total staff 67
Employees 50
Contractors 17
Staff to resident ratio 1.60 : 1
0% compared with State average

State average ratio: 0 : 0

Avg staff/day 24
Average shift 7.6 hours
0% compared with State average

State average: 0 hours

Total staff hours (quarter) 16,688

Nursing staff breakdown

Q4 2025 · Oct 1 – Dec 31 More info This data comes from the CMS Payroll-Based Journal report covering October 1 – December 31, 2025.
Registered Nurse

Manages medical care and health needs.

RN Staff Info All 4 RN Staff are full-time employees. No contractors work on this role. 4
Average shift length Info Average shift length. Calculated as total hours divided by days worked and average staff per day. 8.4 hours
Licensed Practical Nurse

Assists with medical care and medications.

LPN Staff Info All 6 LPN Staff are full-time employees. No contractors work on this role. 6
Average shift length Info Average shift length. Calculated as total hours divided by days worked and average staff per day. 9.1 hours
Certified Nursing Assistant

Helps with daily care and mobility.

CNA Staff Info All 30 CNA Staff are full-time employees. No contractors work on this role. 30
Average shift length Info Average shift length. Calculated as total hours divided by days worked and average staff per day. 7.6 hours

Contractor staffing

Q4 2025 · Oct 1 – Dec 31 More info This data comes from the CMS Payroll-Based Journal report covering October 1 – December 31, 2025.

Total hours from contractors

1.5%

245 contractor hours this quarter

Physical Therapy Assistant: 5 Clinical Nurse Specialist: 4 Respiratory Therapy Technician: 3 Speech Language Pathologist: 3 Physical Therapy Aide: 1 Qualified Social Worker: 1

Staff by category

Q4 2025 · Oct 1 – Dec 31 More info This data comes from the CMS Payroll-Based Journal report covering October 1 – December 31, 2025.
Certified Nursing Assistant300308,88292100%7.6
Licensed Practical Nurse6061,9389199%9.1
Clinical Nurse Specialist3471,4199199%7.4
Registered Nurse4041,32292100%8.4
Medication Aide/Technician2028036065%9.6
Administrator1015286672%8
RN Director of Nursing1015286672%8
Nurse Practitioner1014245358%8
Mental Health Service Worker1013745863%6.4
Other Dietary Services Staff1013394852%7.1
Physical Therapy Aide011544751%1.1
Speech Language Pathologist033453942%1.1
Respiratory Therapy Technician033161516%1
Physical Therapy Assistant055131112%1.2
Qualified Social Worker011455%0.8
30 Certified Nursing Assistant
% of Days 100%
6 Licensed Practical Nurse
% of Days 99%
7 Clinical Nurse Specialist
% of Days 99%
4 Registered Nurse
% of Days 100%
2 Medication Aide/Technician
% of Days 65%
1 Administrator
% of Days 72%
1 RN Director of Nursing
% of Days 72%
1 Nurse Practitioner
% of Days 58%
1 Mental Health Service Worker
% of Days 63%
1 Other Dietary Services Staff
% of Days 52%
1 Physical Therapy Aide
% of Days 51%
3 Speech Language Pathologist
% of Days 42%
3 Respiratory Therapy Technician
% of Days 16%
5 Physical Therapy Assistant
% of Days 12%
1 Qualified Social Worker
% of Days 5%

Penalties and fines

Federal penalties imposed by CMS for regulatory violations, including civil money penalties (fines) and denials of payment for new Medicare/Medicaid admissions.

Source: CMS Penalties Database

No penalties in the past 3 years

No civil money penalties or payment denials were reported in the last 3 years.

Quality of care over time

These measures show how residents usually do over time at this home, based on health outcomes and preventive care.

High-risk clinical events score Info A composite score based on pressure ulcers, falls with injury, weight loss, walking ability decline, and activities of daily living decline. 6.0
22% better than State average

State average: 7.7

Functional decline score Info A composite score based on activities of daily living decline, walking ability decline, and incontinence. 8.0
40% better than State average

State average: 13.3

Long-stay resident measures
Significantly above average State avg: 4.2 Info CMS star rating based on long-stay quality measure performance. 5 stars = significantly above average, 1 star = significantly below average.
Need for Help with Daily Activities Increased Info Percent of long-stay residents whose need for help with daily activities has increased 6.3%
46% better than State average

State average: 11.5%

Walking Ability Worsened Info Percent of long-stay residents whose ability to move independently worsened 6.7%
50% better than State average

State average: 13.4%

Low Risk Residents with Bowel/Bladder Incontinence Info Percent of low risk long-stay residents who lose control of their bowels or bladder 11.0%
27% better than State average

State average: 15.1%

Falls with Major Injury Info Percent of long-stay residents experiencing one or more falls with major injury 5.6%
42% worse than State average

State average: 3.9%

High Risk Residents with Pressure Ulcers Info Percent of long-stay high risk residents with pressure ulcers 6.0%
27% worse than State average

State average: 4.7%

Urinary Tract Infection Info Percent of long-stay residents with a urinary tract infection 0.0%
100% better than State average

State average: 1.3%

Lost Too Much Weight Info Percent of long-stay residents who lose too much weight 5.3%
7% worse than State average

State average: 5.0%

Depressive Symptoms Info Percent of long-stay residents who have depressive symptoms 0.0%
100% better than State average

State average: 1.5%

Antipsychotic Use Info Percent of long-stay residents who received an antipsychotic medication 4.6%
57% better than State average

State average: 10.5%

Pneumococcal Vaccine Info Percent of long-stay residents assessed and appropriately given the pneumococcal vaccine 95.7%
In line with State average

State average: 94.4%

Influenza Vaccine Info Percent of long-stay residents assessed and appropriately given the seasonal influenza vaccine 97.8%
In line with State average

State average: 96.2%

Hospitalizations per 1,000 days Info Number of hospitalizations per 1,000 long-stay resident days. 0.98
50% better than State average

State average: 1.97

ED visits per 1,000 days Info Number of outpatient emergency department visits per 1,000 long-stay resident days. 1.75
20% better than State average

State average: 2.18

Short-stay resident measures
Average State avg: 2.7 Info CMS star rating based on short-stay quality measure performance. 5 stars = much above average, 1 star = much below average.
Pneumococcal Vaccine Info Percent of short-stay residents assessed and appropriately given the pneumococcal vaccine 75.0%
7% worse than State average

State average: 80.9%

Antipsychotic medication increase Info Percent of short-stay residents who newly received an antipsychotic medication 0.0%
100% better than State average

State average: 1.5%

Influenza Vaccine Info Percent of short-stay residents assessed and appropriately given the seasonal influenza vaccine 85.2%
10% better than State average

State average: 77.7%

Re-hospitalized after SNF stay Info Percentage of short-stay residents who were re-hospitalized after their nursing home admission. 46.8%
86% worse than State average

State average: 25.2%

Emergency department visits Info Percentage of short-stay residents who had an outpatient emergency department visit. 4.4%
68% better than State average

State average: 13.8%

Falls with major injury Info Percentage of SNF residents who experience falls with major injury during their stay. 6.5%
738% worse than State average

State average: 0.8%

Ability to care for self at discharge Info Percentage of residents at or above expected ability to care for themselves at discharge. 45.8%
15% worse than State average

State average: 53.7%

Successful return to home or community Info Rate of successful return to home or community from a skilled nursing facility. 47.5%
6% worse than State average

State average: 50.6%

Breakdown by payment type

Medicare

34% of new residents, usually for short-term rehab.

Typical stay 27 days

Private pay

58% of new residents, often for short stays.

Typical stay 2 - 3 months

Medicaid

8% of new residents, often for long-term daily care.

Typical stay 4 - 5 years

Facility Characteristics

Source: CMS Long-Term Care Facility Characteristics (Data as of Jan 2026)

Total residents 42
Medicare
1
2.4% of residents
Medicaid
30
71.4% of residents
Private pay or other
11
26.2% of residents
Programs & Services
Residents Group

Residents meet regularly to discuss policies, care quality, and activities

Active Resident Council

Organized group of residents that meets regularly to discuss facility policies, quality of life, and activities.

Finances and operations

Based on CMS SNF Cost Report for fiscal year ending in 12/2023.

For-profit
Corporation
Net patient revenue Info Net patient revenue — what the home actually collects for resident care, after contractual allowances, bad debt and discounts are subtracted from its gross charges (CMS cost report, Worksheet G-3). It covers resident care only; money the home earns from other sources is shown separately as "Other income."
$5.0M
Net patient income Info Net patient income: net patient revenue minus the home's total operating expenses. A positive figure means it earns more from resident care than it spends to deliver it; a negative figure means the opposite. It excludes non-operating "other income."
-$178.9K
For-profit Corporation
Net patient revenue Info Net patient revenue — what the home actually collects for resident care, after contractual allowances, bad debt and discounts are subtracted from its gross charges (CMS cost report, Worksheet G-3). It covers resident care only; money the home earns from other sources is shown separately as "Other income."
$5.0M
Net patient income Info Net patient income: net patient revenue minus the home's total operating expenses. A positive figure means it earns more from resident care than it spends to deliver it; a negative figure means the opposite. It excludes non-operating "other income."
-$178.9K
Other income Info Money the home earns outside of resident care — such as investments, grants, rentals and other non-operating sources (CMS cost report, Worksheet G-3). It is tracked separately from net patient revenue: it is not part of that figure, and it is not included in net patient income.
$5.6K
Payroll costs Info Staff salaries plus wage-related costs — benefits such as payroll taxes, health insurance and retirement — from the home's own accounting records (CMS cost report, Worksheet A). Contract or agency labor is counted separately, under other operating costs.
$2.4M 47.8% of net patient revenue Info Payroll as a share of revenue: staff salaries and wage-related benefits divided by net patient revenue. A higher figure means more of each revenue dollar goes to staff pay.
Other operating costs Info Everything it costs to run the home apart from payroll — food, utilities, supplies, maintenance, contract labor and administration. Calculated as total operating expense minus payroll (staff salaries and wage-related benefits).
$2.8M
Total costs Info The home's total operating expense for the year — all the costs of running it, salaries included (CMS cost report, Worksheet G-3).
$5.2M

Who this home usually serves

TYPE OF STAY

Mix of rehab and long-term care

This home supports both short-term rehab and long-term care, with residents staying for a wide range of durations.

Most new residents arrive under private pay (58% of admissions), and a typical private pay stay runs around 2 - 3 months.

Admissions
93 total

Coverage residents most often arrive under.

Medicare 34%
Private pay 58%
Medicaid 8%
Discharges
102 total

Coverage residents most often leave under.

Medicare 34%
Private pay 57%
Medicaid 9%

Places of interest near Gassville Therapy and Living

Address 0.0 miles from city center Info Estimated distance in miles from Gassville's city center to Gassville Therapy and Living's address, calculated via Google Maps.

Calculate Travel Distance to Gassville Therapy and Living

Add your location

Address

Compare Nursing Homes around the area

The information below is reported by the Arkansas Department of Human Services, Office of Long Term Care.

Gassville Therapy and Living
NH
MC
RC
Gassville -105 - 29 -
Barnes Healthcare
NH
MC
Lonoke -141 A+ 38 Private / Shared Rooms
Timberlane Health & Rehab
NH
MC
RC
El Dorado -106 A+ 33 -
Bear Creek Healthcare LLC
NH
De Queen -131 - 35 -
Maple Healthcare
NH
Hazen -70 - 21 Private / Shared Rooms

Frequently Asked Questions about Gassville Therapy and Living

Who is the owner of Gassville Therapy and Living?

Gassville Therapy and Living is legally operated by GVNC, Inc., and administered by William Bonham.

Is Gassville Therapy and Living in a walkable area?

Gassville Therapy and Living has a walk score of 29. Somewhat walkable. A few nearby services may be reachable on foot, but most trips require transportation.

What is the occupancy rate at Gassville Therapy and Living?

Gassville Therapy and Living's occupancy is 42.4%.

Does Gassville Therapy and Living operate as a for-profit or non-profit?

Gassville Therapy and Living is registered as a for-profit in AR.

Who is the administrator of Gassville Therapy and Living?

William Bonham is the administrator of Gassville Therapy and Living.

How many beds does Gassville Therapy and Living have?

Gassville Therapy and Living has 105 beds.

Are there photos of Gassville Therapy and Living?

Yes — there are 10 photos of Gassville Therapy and Living in the photo gallery on this page.

Guides for Better Senior Living

Care Cost Calculator: See Prices in Your Area

Nursing Home Data Explorer

Don’t Wait Too Long: 7 Red Flag Signs Your Parent Needs Assisted Living Now

The True Cost of Assisted Living in 2025 – And How Families Are Paying For It

Understanding Senior Living Costs: Pricing Models, Discounts & Financial Assistance