Rector Nursing and Rehab
Nursing Home, Memory Care & Respite Care · Rector, AR
CMS overall rating Info CMS (the Centers for Medicare & Medicaid Services) is the federal agency that rates nursing home quality. Its Overall Rating runs from 1 to 5 stars, combining health inspections, staffing, and quality measures, with inspections weighted most heavily.

Rector Nursing and Rehab

Nursing Home, Memory Care & Respite Care · Rector, AR
CMS overall rating Info CMS (the Centers for Medicare & Medicaid Services) is the federal agency that rates nursing home quality. Its Overall Rating runs from 1 to 5 stars, combining health inspections, staffing, and quality measures, with inspections weighted most heavily.
Calculator: See prices in your area
Rector Nursing and Rehab accepts Medicare, Medicaid, and private pay.

Overview of Rector Nursing and Rehab

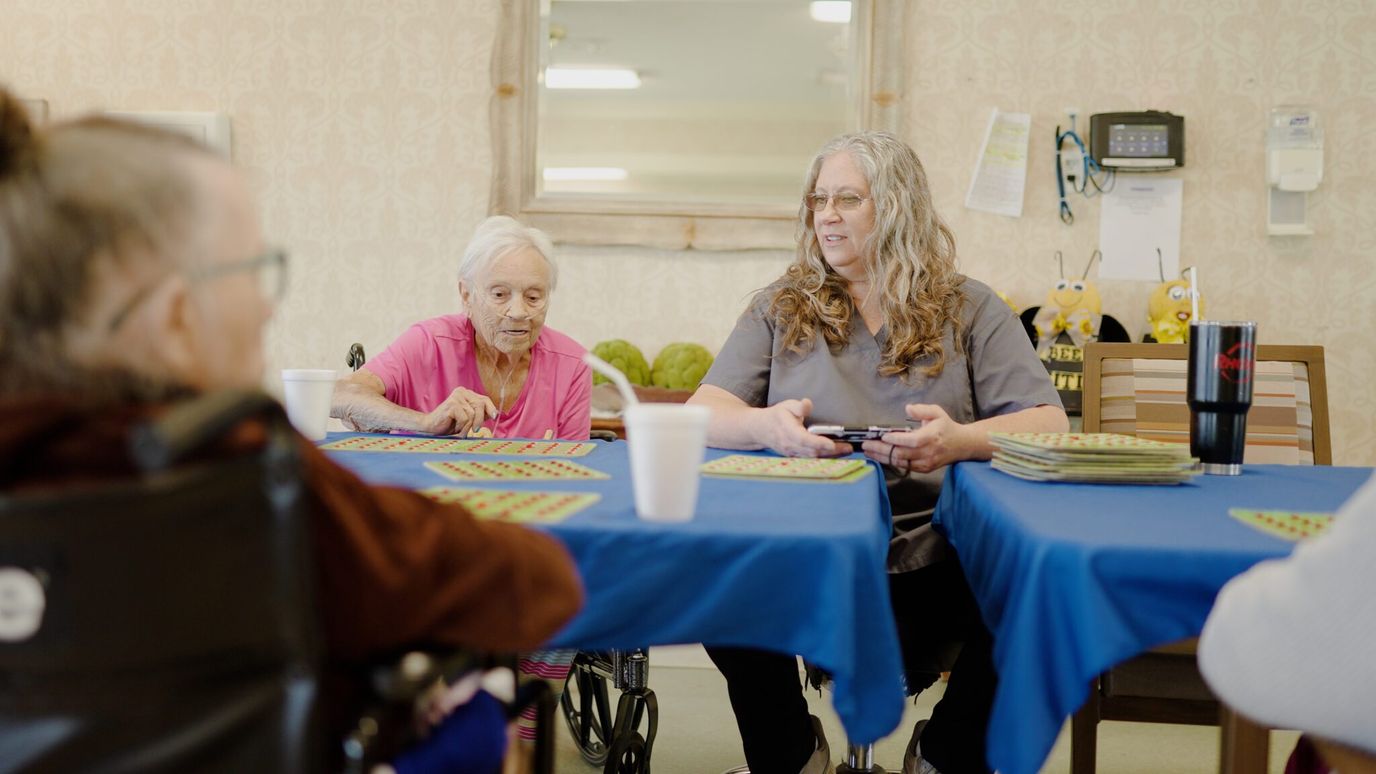
Kathy Speaks serves as the administrator for Rector Nursing and Rehab, a 70-bed care facility in Rector, Arkansas, run by RTNC, Inc. The home handles a blend of long-term nursing, memory support, and short-term therapy, with residents staying for an average of 191 days.

On the floor, the 24-hour nursing team averages 4 hours and 5 minutes of direct, hands-on attention per resident daily. This includes 29 minutes of direct registered nurse coverage, which provides regular clinical oversight for the building’s therapy gym and daily care routines. For amenities, residents have access to an outdoor courtyard, an activity area, hair salon services, and a dining program overseen by a certified dietary manager. The property has a 40 walk score, meaning visitors can handle a few minor tasks on foot, but most errands will require a car.

State health surveys show the building operates with fewer compliance issues than the state average, including zero health deficiencies or complaints during its most recent annual inspection. While prior complaint investigations flagged issues with resident transport protocols and care delivery procedures, the records show these matters have been corrected. You can review the facility’s updated safety protocols and regulatory track record directly with the management team.

Interested individuals can reach out to the admissions desk to check on current bed availability or to find out what paperwork is needed to start the intake process.

Quality ratings

Measured by Centers for Medicare & Medicaid Services (CMS)

Overall rating Info The Overall CMS Rating combines results from health inspections, staffing levels and quality measures. Health inspections carry the most weight. Staffing and quality scores can increase or decrease the final rating based on performance compared to state and national standards.
Health Inspection Info Based on the results of the facility's three most recent standard inspections and any complaint investigations. CMS reviews the number, scope, and severity of deficiencies, with more recent findings weighted more heavily.
Staffing Info Measures average nursing staff hours per resident per day, including Registered Nurses (RNs) and total nursing staff. Ratings are adjusted based on the level of care residents require and are compared to state and national benchmarks.
Quality Measures Info Based on clinical and physical health indicators reported to CMS, such as hospital readmissions, falls, pressure ulcers, and improvements in mobility. These measures reflect how well residents' health needs are being managed.

Staffing hours breakdown

Info Daily nursing hours per resident by staff type, reported to CMS. Higher is generally better — compare this facility to state and national averages to see where staffing stands.

Hours per resident per day — compared to state averages

Total nursing care / resident Info Total adjusted nursing hours per resident per day, combining RN, LPN, and aide time. CMS adjusts this for case-mix so facilities can be fairly compared.
4h 5m per day
vs avg

4 of 6 metrics below state avg

Standout metric Registered Nurse (RN) is +21% above state avg
Staff type Hours / Day / Resident vs state avg
Registered Nurse (RN) Info RNs hold the highest nursing license and can assess residents, interpret test results, and direct care plans. More RN hours per day often signals stronger clinical oversight and faster response to health changes. 29m per day ▲ 21% State avg: 24m per day · National avg: 41m per day
LPN / LVN Info Licensed Practical Nurses (LPNs) or Licensed Vocational Nurses (LVNs) deliver routine hands-on care — medication administration, wound dressing, and monitoring vital signs. They work under RN supervision and make up a large share of daily bedside care. 53m per day ▼ 7% State avg: 57m per day · National avg: 52m per day
Nurse Aide Info Certified Nurse Aides (CNAs) provide the most direct day-to-day assistance: bathing, dressing, feeding, and mobility. Nurse aide hours are typically the largest staffing category and directly affect residents' quality of life. 1h 52m per day ▼ 31% State avg: 2h 43m per day · National avg: 2h 20m per day
Weekend Total Nursing Info Combined nursing hours (RN + LPN + Nurse Aide) per resident per day on weekends. Staffing often drops on weekends — this figure reveals whether the facility maintains adequate coverage outside of weekday hours. 3h 10m per day ▼ 9% State avg: 3h 29m per day · National avg: 3h 26m per day
Physical Therapist Info Hours per resident per day provided by licensed Physical Therapists (PTs) or PT Assistants. PT services help residents recover mobility after injury or illness and are especially important for post-acute (short-stay) rehabilitation. 1m per day ▼ 74% State avg: 2m per day · National avg: 4m per day
Weekend RN Info Registered nurse hours specifically on weekends. Facilities sometimes reduce RN presence on Saturdays and Sundays — a low weekend RN figure compared to weekday hours can indicate reduced clinical oversight when most administrative staff are absent. 18m per day ▲ 11% State avg: 16m per day · National avg: 28m per day

Capacity and availability

Avg. Length of Stay
191 days
Bed community size
70-bed community Rank #206 / 330Bed count — State benchmarkedThis home is ranked 206th out of 330 homes in Arkansas. Shows this facility's certified or reported bed count compared to other Arkansas facilities. Larger communities may offer more amenities, programs, and on-site services for residents and families.Rankings are based only on facilities in Arkansas that report data for that category. Facilities without available data are excluded from the ranking.Click the rank badge to see the full State ranking.Click here to see the full State ranking.
A moderately sized community that may balance personal attention with shared amenities and social activities.
Walk Score
Walk Score: 40 / 100 Rank #159 / 419Walk Score — State benchmarkedThis home is ranked 159th out of 419 homes in Arkansas. Shows how walkable this facility's neighborhood is compared to the average Walk Score across Arkansas facilities. Higher scores benefit residents, families, and staff.Rankings are based only on facilities in Arkansas that report data for that category. Facilities without available data are excluded from the ranking.Click the rank badge to see the full State ranking.Click here to see the full State ranking.
Somewhat walkable. A few nearby services may be reachable on foot, but most trips require transportation.

About this community

Occupancy

Occupancy rate
53%
Lower than the Arkansas average: 71.3%
Occupied beds
37 / 70
Average occupied beds in Arkansas homes 77 beds

License Details

Facility TypeSkilled Nursing Facility With Dual Certified Beds (medicaid /medicare)
CountyClay
CMS Certification Number045394
Certification TypeMedicaid / Medicare

Ownership & Operating Entity

Rector Nursing and Rehab is legally operated by RTNC, Inc., and administered by Kathy Speaks.

Owner NameRtnc, Inc
Profit StatusFor-profit

Type Of Units

Medicaid and Medicare
70 units
Total beds
70 units

Therapy & Rehabilitation

3 services
Rehabilitation Services
Respite Care
Short-Term Rehab

Staffing & Medical

1 service
24-Hour Staffing

Contact Information

Fax870-595-1109

Amenities & Lifestyle

Communal Dining Space
Dedicated Activity Area
Therapy Gym
Outdoor Courtyard
Salon Services
Engaging Social Activities
Activities
Specific ProgramsAdditional Resources

Contact Rector Nursing and Rehab

Inspection History

In Arkansas, the Department of Human Services, Office of Long Term Care is authorized to conduct unannounced inspections and issue official quality of care reports for all senior living providers.

Since 2023 · 3 years of data 6 deficiencies

Inspection Scorecard Info This scorecard compares key inspection, deficiency, and complaint metrics at this facility against the Arkansas state average. Metrics rated ≥15% worse than average are highlighted in red; those ≥15% better are highlighted in green.

Since 2023 vs. Arkansas state average
Overall vs. AR average 0 Worse No metrics in this bucket. 2 Better Metrics better than Arkansas average:
• Total deficiencies (71% below)
• Deficiencies per year (71% below)
Latest Inspection December 2, 2025 Annual Inspection

Deficiencies Info Deficiencies are formal regulatory issues recorded during state inspections.

This Facility AR Average vs. AR Avg
Total deficiencies Info Formal regulatory issues recorded by inspectors across all inspection types. 6 21 This facility has 71% fewer total deficiencies than a typical Arkansas assisted living residence (6 vs. AR avg 21).↓ 71% better
Deficiencies per year Info Average deficiencies per year since 2023. 2 7 This facility has 71% fewer deficiencies per year than a typical Arkansas assisted living residence (2 vs. AR avg 7).↓ 71% better

Inspection Reports Summary Info An editor-reviewed summary of the themes and findings across this facility's recent inspection reports.

  • December 2, 2025 annual inspection found no health deficiencies and no complaints.
  • February 26, 2025 complaint investigation substantiated immediate jeopardy due to untrained transport staff causing a resident to fall and become unresponsive during van transport.
  • June 13, 2024 complaint investigation substantiated three deficiencies including resident dignity at mealtime, contracture care, and unsecured controlled medication storage.

Health Inspection History

Inspections since 2023
Total health inspections 3

State average N/A


Last Health inspection on Feb 2025

Total health citations
6

State average N/A

Citations per inspection
2

State average N/A


Health citations are formal notices following inspections when they fail to comply with safety and care standards.

5 of 6 citations resulted from standard inspections; and 1 of 6 resulted from complaint investigations.

Breakdown of citation severity (last 3 years)
Critical health citations
1
In line with State average

State average: N/A


Serious health citations
0
In line with State average

State average: N/A

1 critical citation State average: N/A

0 serious citations State average: N/A

5 moderate citations State average: N/A

0 minor citations State average: N/A
Citations history (last 3 years)
Quality of Care critical citation Feb 26, 2025
Corrected

Pharmacy moderate citation Jun 13, 2024
Corrected

Quality of Care moderate citation Jun 13, 2024
Corrected

Resident Rights moderate citation Jun 13, 2024
Corrected

Staffing Data

Reporting period: October 1 – December 31, 2025 (Q4 2025). Source: CMS Payroll-Based Journal report.

Total staff 62
Employees 49
Contractors 13
Staff to resident ratio 1.55 : 1
0% compared with State average

State average ratio: 0 : 0

Avg staff/day 18
Average shift 8.2 hours
0% compared with State average

State average: 0 hours

Total staff hours (quarter) 13,596

Nursing staff breakdown

Q4 2025 · Oct 1 – Dec 31 More info This data comes from the CMS Payroll-Based Journal report covering October 1 – December 31, 2025.
Registered Nurse

Manages medical care and health needs.

RN Staff Info All 6 RN Staff are full-time employees. No contractors work on this role. 6
Average shift length Info Average shift length. Calculated as total hours divided by days worked and average staff per day. 9.7 hours
Licensed Practical Nurse

Assists with medical care and medications.

LPN Staff Info All 10 LPN Staff are full-time employees. No contractors work on this role. 10
Average shift length Info Average shift length. Calculated as total hours divided by days worked and average staff per day. 10.5 hours
Certified Nursing Assistant

Helps with daily care and mobility.

CNA Staff Info All 23 CNA Staff are full-time employees. No contractors work on this role. 23
Average shift length Info Average shift length. Calculated as total hours divided by days worked and average staff per day. 9.3 hours

Contractor staffing

Q4 2025 · Oct 1 – Dec 31 More info This data comes from the CMS Payroll-Based Journal report covering October 1 – December 31, 2025.

Total hours from contractors

1.8%

250 contractor hours this quarter

Speech Language Pathologist: 4 Clinical Nurse Specialist: 3 Physical Therapy Assistant: 2 Respiratory Therapy Technician: 2 Physical Therapy Aide: 1 Qualified Social Worker: 1

Staff by category

Q4 2025 · Oct 1 – Dec 31 More info This data comes from the CMS Payroll-Based Journal report covering October 1 – December 31, 2025.
Certified Nursing Assistant 23 0 23 7,104 92 100% 9.3
Licensed Practical Nurse 10 0 10 3,337 92 100% 10.5
Clinical Nurse Specialist 2 3 5 782 62 67% 6.5
Registered Nurse 6 0 6 553 52 57% 9.7
Nurse Practitioner 1 0 1 528 68 74% 7.8
Administrator 1 0 1 464 58 63% 8
Dental Services Staff 2 0 2 348 43 47% 8.1
Dietitian 1 0 1 94 12 13% 7.8
Other Dietary Services Staff 1 0 1 80 10 11% 8
Physical Therapy Aide 0 1 1 80 59 64% 1.4
RN Director of Nursing 1 0 1 64 8 9% 7.9
Speech Language Pathologist 0 4 4 46 40 43% 1.2
Nurse Aide in Training 1 0 1 41 5 5% 8.2
Respiratory Therapy Technician 0 2 2 33 23 25% 1.4
Physical Therapy Assistant 0 2 2 22 11 12% 2
Qualified Social Worker 0 1 1 20 23 25% 0.9
23 Certified Nursing Assistant
% of Days 100%
10 Licensed Practical Nurse
% of Days 100%
5 Clinical Nurse Specialist
% of Days 67%
6 Registered Nurse
% of Days 57%
1 Nurse Practitioner
% of Days 74%
1 Administrator
% of Days 63%
2 Dental Services Staff
% of Days 47%
1 Dietitian
% of Days 13%
1 Other Dietary Services Staff
% of Days 11%
1 Physical Therapy Aide
% of Days 64%
1 RN Director of Nursing
% of Days 9%
4 Speech Language Pathologist
% of Days 43%
1 Nurse Aide in Training
% of Days 5%
2 Respiratory Therapy Technician
% of Days 25%
2 Physical Therapy Assistant
% of Days 12%
1 Qualified Social Worker
% of Days 25%

Penalties and fines

Includes penalties issued in 2025

Federal penalties imposed by CMS for regulatory violations, including civil money penalties (fines) and denials of payment for new Medicare/Medicaid admissions.

Source: CMS Penalties Database (Data as of Jan 2026)

Total fines amount $14K
45% lower than State average

State average: $26K

Number of fines 1
32% fewer fines than State average

State average: 1.5

Payment Denials Info Serious action where Medicare and/or Medicaid temporarily stops payments for new residents until issues are fixed. 0
100% fewer payment denials than State average

State average: 0.2

Fines amount comparison
This facility $14K
State average $26K
Penalty History

Penalties are imposed by CMS for violations of federal nursing home regulations.

1 penalty in the past 3 years

Feb 26, 2025 · $14K

Civil Money Penalty Info Fines imposed for noncompliance, which can be assessed per day or per instance of violation. Feb 26, 2025
$14K

Last updated: Jan 2026

Quality of care over time

These measures show how residents usually do over time at this home, based on health outcomes and preventive care.

High-risk clinical events score Info A composite score based on pressure ulcers, falls with injury, weight loss, walking ability decline, and activities of daily living decline. 8.0
In line with State average

State average: 7.7

Functional decline score Info A composite score based on activities of daily living decline, walking ability decline, and incontinence. 20.8
56% worse than State average

State average: 13.3

Long-stay resident measures
Significantly above average State avg: 4.2 Info CMS star rating based on long-stay quality measure performance. 5 stars = significantly above average, 1 star = significantly below average.
Need for Help with Daily Activities Increased Info Percent of long-stay residents whose need for help with daily activities has increased 17.5%
52% worse than State average

State average: 11.5%

Walking Ability Worsened Info Percent of long-stay residents whose ability to move independently worsened 15.4%
16% worse than State average

State average: 13.4%

Low Risk Residents with Bowel/Bladder Incontinence Info Percent of low risk long-stay residents who lose control of their bowels or bladder 29.3%
94% worse than State average

State average: 15.1%

Falls with Major Injury Info Percent of long-stay residents experiencing one or more falls with major injury 4.8%
22% worse than State average

State average: 3.9%

High Risk Residents with Pressure Ulcers Info Percent of long-stay high risk residents with pressure ulcers 0.8%
84% better than State average

State average: 4.7%

Urinary Tract Infection Info Percent of long-stay residents with a urinary tract infection 0.7%
46% better than State average

State average: 1.3%

Lost Too Much Weight Info Percent of long-stay residents who lose too much weight 1.6%
68% better than State average

State average: 5.0%

Depressive Symptoms Info Percent of long-stay residents who have depressive symptoms 1.5%
5% better than State average

State average: 1.5%

Antipsychotic Use Info Percent of long-stay residents who received an antipsychotic medication 0.0%
100% better than State average

State average: 10.5%

Pneumococcal Vaccine Info Percent of long-stay residents assessed and appropriately given the pneumococcal vaccine 98.0%
In line with State average

State average: 94.4%

Influenza Vaccine Info Percent of long-stay residents assessed and appropriately given the seasonal influenza vaccine 100.0%
In line with State average

State average: 96.2%

Hospitalizations per 1,000 days Info Number of hospitalizations per 1,000 long-stay resident days. 0.62
69% better than State average

State average: 1.97

ED visits per 1,000 days Info Number of outpatient emergency department visits per 1,000 long-stay resident days. 1.48
32% better than State average

State average: 2.18

Short-stay resident measures
Significantly above average State avg: 2.7 Info CMS star rating based on short-stay quality measure performance. 5 stars = much above average, 1 star = much below average.
Pneumococcal Vaccine Info Percent of short-stay residents assessed and appropriately given the pneumococcal vaccine 95.1%
18% better than State average

State average: 80.9%

Antipsychotic medication increase Info Percent of short-stay residents who newly received an antipsychotic medication 1.1%
25% better than State average

State average: 1.5%

Influenza Vaccine Info Percent of short-stay residents assessed and appropriately given the seasonal influenza vaccine 94.6%
22% better than State average

State average: 77.7%

Falls with major injury Info Percentage of SNF residents who experience falls with major injury during their stay. 0.0%
100% better than State average

State average: 0.8%

Ability to care for self at discharge Info Percentage of residents at or above expected ability to care for themselves at discharge. 69.0%
28% better than State average

State average: 53.7%

Successful return to home or community Info Rate of successful return to home or community from a skilled nursing facility. 57.2%
13% better than State average

State average: 50.6%

Breakdown by payment type

Medicare

28% of new residents, usually for short-term rehab.

Typical stay 1 - 2 months

Private pay

49% of new residents, often for short stays.

Typical stay 1 - 2 months

Medicaid

24% of new residents, often for long-term daily care.

Typical stay 1 - 2 years

Facility Characteristics

Source: CMS Long-Term Care Facility Characteristics (Data as of Jan 2026)

Total residents 40
Medicare
4
10% of residents
Medicaid
28
70% of residents
Private pay or other
8
20% of residents
Programs & Services
Residents Group

Residents meet regularly to discuss policies, care quality, and activities

Active Resident Council

Organized group of residents that meets regularly to discuss facility policies, quality of life, and activities.

Finances and operations

Based on CMS SNF Cost Report for fiscal year ending in 12/2023.

For-profit
Corporation
Net patient revenue Info Net patient revenue — what the home actually collects for resident care, after contractual allowances, bad debt and discounts are subtracted from its gross charges (CMS cost report, Worksheet G-3). It covers resident care only; money the home earns from other sources is shown separately as "Other income."
$4.3M
Net patient income Info Net patient income: net patient revenue minus the home's total operating expenses. A positive figure means it earns more from resident care than it spends to deliver it; a negative figure means the opposite. It excludes non-operating "other income."
$210.6K
For-profit Corporation
Net patient revenue Info Net patient revenue — what the home actually collects for resident care, after contractual allowances, bad debt and discounts are subtracted from its gross charges (CMS cost report, Worksheet G-3). It covers resident care only; money the home earns from other sources is shown separately as "Other income."
$4.3M
Net patient income Info Net patient income: net patient revenue minus the home's total operating expenses. A positive figure means it earns more from resident care than it spends to deliver it; a negative figure means the opposite. It excludes non-operating "other income."
$210.6K
Other income Info Money the home earns outside of resident care — such as investments, grants, rentals and other non-operating sources (CMS cost report, Worksheet G-3). It is tracked separately from net patient revenue: it is not part of that figure, and it is not included in net patient income.
$6.7K
Payroll costs Info Staff salaries plus wage-related costs — benefits such as payroll taxes, health insurance and retirement — from the home's own accounting records (CMS cost report, Worksheet A). Contract or agency labor is counted separately, under other operating costs.
$1.9M 44.2% of net patient revenue Info Payroll as a share of revenue: staff salaries and wage-related benefits divided by net patient revenue. A higher figure means more of each revenue dollar goes to staff pay.
Other operating costs Info Everything it costs to run the home apart from payroll — food, utilities, supplies, maintenance, contract labor and administration. Calculated as total operating expense minus payroll (staff salaries and wage-related benefits).
$2.2M
Total costs Info The home's total operating expense for the year — all the costs of running it, salaries included (CMS cost report, Worksheet G-3).
$4.1M

Who this home usually serves

TYPE OF STAY

Mix of rehab and long-term care

This home supports both short-term rehab and long-term care, with residents staying for a wide range of durations.

New residents most often arrive under private pay (49% of admissions), and a typical private pay stay runs around 1 - 2 months.

Admissions
80 total

Coverage residents most often arrive under.

Medicare 28%
Private pay 49%
Medicaid 24%
Discharges
71 total

Coverage residents most often leave under.

Medicare 34%
Private pay 51%
Medicaid 15%

Places of interest near Rector Nursing and Rehab

Address 0.0 miles from city center Info Estimated distance in miles from Rector's city center to Rector Nursing and Rehab's address, calculated via Google Maps.

Calculate Travel Distance to Rector Nursing and Rehab

Add your location

Address

Compare Nursing Homes around the area

The information below is reported by the Arkansas Department of Human Services, Office of Long Term Care.

Rector Nursing and Rehab
NH
MC
RC
Rector - 70 - 40 -
Barnes Healthcare
NH
MC
Lonoke - 141 A+ 38 Private / Shared Rooms
Timberlane Health & Rehab
NH
MC
RC
El Dorado - 106 A+ 33 -
Bear Creek Healthcare LLC
NH
De Queen - 131 - 35 -
Maple Healthcare
NH
Hazen - 70 - 21 Private / Shared Rooms

Frequently Asked Questions about Rector Nursing and Rehab

Who is the owner of Rector Nursing and Rehab?

Rector Nursing and Rehab is legally operated by RTNC, Inc., and administered by Kathy Speaks.

Is Rector Nursing and Rehab in a walkable area?

Rector Nursing and Rehab has a walk score of 40. Somewhat walkable. A few nearby services may be reachable on foot, but most trips require transportation.

What is the occupancy rate at Rector Nursing and Rehab?

Rector Nursing and Rehab's occupancy is 53%.

Does Rector Nursing and Rehab operate as a for-profit or non-profit?

Rector Nursing and Rehab is registered as a for-profit in AR.

Who is the administrator of Rector Nursing and Rehab?

Kathy Speaks is the administrator of Rector Nursing and Rehab.

How many beds does Rector Nursing and Rehab have?

Rector Nursing and Rehab has 70 beds.

Are there photos of Rector Nursing and Rehab?

Yes — there are 9 photos of Rector Nursing and Rehab in the photo gallery on this page.

Guides for Better Senior Living

Care Cost Calculator: See Prices in Your Area

Nursing Home Data Explorer

Don’t Wait Too Long: 7 Red Flag Signs Your Parent Needs Assisted Living Now

The True Cost of Assisted Living in 2025 – And How Families Are Paying For It

Understanding Senior Living Costs: Pricing Models, Discounts & Financial Assistance